
-
If we view USDA's quarterly Grain Stocks report as just another Keno game, which is the correct way to think of it, the key number for Corn is the government's September ending stocks figure of 1.922 billion bushels.
-
The same metric can be applied to Soybeans where the September ending stocks estimate came in at 325.2 million bushels.
-
As for all US wheat, based on what I call the Wheat Reality, the key number is actually the revision to the June 1 quarterly stocks figure of 920.1 million bushels.
Good morning everyone! Do you have your Keno cards[i] ready for USDA’s latest game of chance, this one known as the quarterly Grain Stocks report? Yes, there is also a Small Grains Summary for those who like to play penny-slot machines when visiting Las Vegas. During our Tuesday morning conversation on RFD-TV’s Market Day Report my longtime friend and host Tony St. James asked if the quarterly Grain Stocks report was valuable information, or just another trading opportunity. Back in the day, I used to consider these quarterly reports as valuable to the point of confirming what we already knew about US grain supply and demand by watching things like national cash indexes, basis, and futures spreads. However, times have changed and the industry doesn’t care about real supply and demand anymore. It’s about how USDA’s manufactured numbers relate to pre-report estimates creating a reaction by algorithms. Nothing more. I know that will rub folks the wrong way, but as Rhett Butler would respond, “Frankly, my dear, I don’t give a dam.” (you get the point). Given this, I once again turned to Barchart’s AI analyst CARL to find out what the pre-report estimates are we should be watching Wednesday.
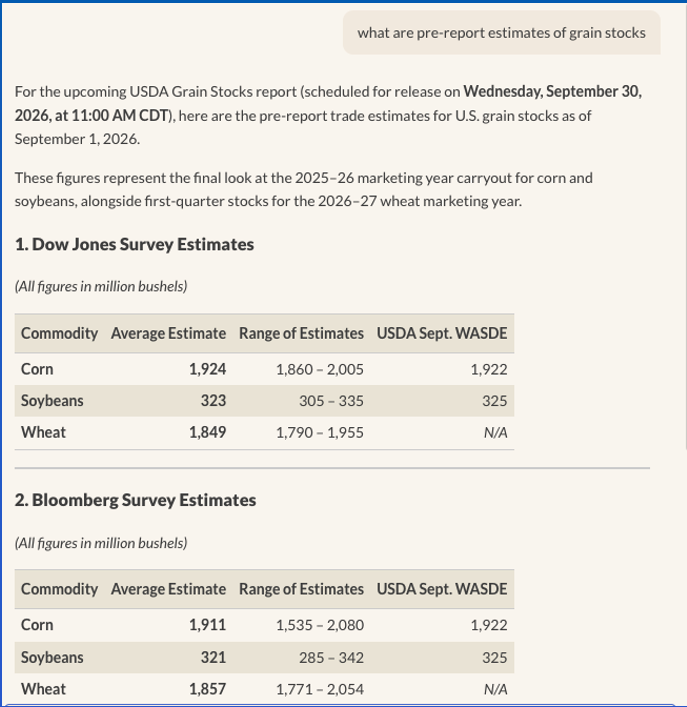
CORN: Let’s start with the King of the Grains sector itself. CARL showed me two different sets of guesses, one from Dow Jones the other Bloomberg. I got the biggest kick out of the latter as the range of pre-report guesses was wide, from a big 2.08 billion bushels (bb) to a relatively microscopic 1.535 bb. The high end was 8.2% above USDA’s September magic number of 1.922 bb, the low end a whopping 20% below. Keep in mind these pre-report guesses largely come from brokerage firms who make a living promoting these reports as trading opportunities[ii]. This raises an interesting Game Theory scenario. Are the brokerage houses putting their guess low doing so thinking USDA’s number will come in larger, prompting algorithms to sell, meaning the brokers have already had their customers get out of long positions or possibly gone short? This ties in with another question Tony asked, “Are pre-report guesses based on what brokerage firms believe is out there or on what it thinks USDA will release?” It’s the latter. As I said before, the industry doesn’t care much about real supply and demand, it’s all about playing the game.
When the envelope is unsealed Wednesday, the key number, in my opinion, will be USDA’s imaginary ending stocks figure of 1.922 bb. If the quarterly stock figure comes in near that mark it would be the highest ending stocks figure since 2.22 bb from September 1, 2019. But here’s where it gets fun. Though USDA goes out of its way to say, “old crop stocks”, meaning bushels from the previous harvest, it tends to include some newly harvested bushels from areas where harvest gets rolling in late summer and hauled to town. This created what I like to call the 300 (400) Consistency: Meaning USDA tends to find and/or lose 300 to 400 mb in its September 1 report. I don’t have a problem with this. The bushels should be counted. The quarterly report is supposed to show what the US had on farm or off, regardless of when it came in. But that kind of thinking screws up the gambling aspect of the report that views the numbers as a score to bet on. So when this happens, as it usually does, USDA will offer an explanation and later revision, usually when the gamblers no longer care. Last but certainly not least, we need to keep in mind funds held near record large net-long and long futures positions as of Tuesday, September 22. If USDA includes the early harvested bushels, it could push the guess beyond the high end of pre-report ranges, triggering a larger round of fund long liquidation selling.
SOYBEANS: While most of the attention will be on corn’s quarterly stocks number, Soybeans could steal some of the spotlight. Heading into game day (report day, if you still want to pretend it’s something other than a game), both sets of pre-report guess show an average near USDA’s manufactured ending stocks figure of 325 million bushels (mb). Dow Jones came in at 323 mb with Bloomberg at 321 mb. As with corn, the Bloomberg range is wide from 342 mb to 285 mb. However, if USDA’s September 1 imaginary number comes in near either of those, it would still be in range of the previous 5-years between 257 mb (2021) and 342 mb (2024).
Given this, the key to how algorithms react could be as simple as USDA’s manufactured September figure of 325.2 mb. It’s interesting to note this would be almost equal to the September 1, 2025, number of 324.8 mb. Even more so than in corn, the wildcard in soybeans is the fact the most recent Commitments of Traders report showed record large noncommercial long (370,525 contracts) and net-long (281,581 contracts) futures positions as of Tuesday, September 22. This past Tuesday-to-Tuesday positioning week the November contract closed 27.75 cents lower indicating some long liquidation took place. This could give funds room to do some renewed buying or continue the process of liquidation as the spotlight shifts to Brazil’s 2027 crop. It’s a coin toss.
WHEAT: When it comes to the wheat sub-sector, the number the gamblers will be looking at, if they look at wheat at all, will be the all-wheat stocks on hand. This will be the Q1 stocks number, with the two average pre-report guesses coming in at 1.849 bb (Dow Jones) and 1.857 bb (Bloomberg). Similar to corn and soybeans, the Bloomberg range is wider, coming in at 1.771 bb to 2.054 bb. If algorithms are paying to wheat at all, which is iffy at best, it will most likely be the average guesses.
My thought on wheat stocks can be wrapped up with what I call the Wheat Reality: One bushel of wheat leftover is too many. Given this, I’ll take a look at revisions to the June 1 stocks number, the de facto ending stocks figure for last marketing year[iii] that initially came in at 920.1 mb. Then, I’ll make note of the previous 5-year high and low September 1 numbers of 2.134 bb (2025) and 1.767 bb (2023).
BOTTOM LINE: If you get nothing else from this piece, remember this: USDA reports are NOT about fundamental transparency or shedding a light on the dark corners of the grain industry’s supply and demand. The purpose of these reports is to generate trade volume. That’s it. You will hear, see, or read those who say otherwise. Ask them one simple question: Why are USDA’s grain reports the only ones released during trading hours? Again, it doesn’t take a rocket scientist to understand what drives the process. If you choose to play the game, know the algos will win and position yourself accordingly before the Keno numbers are released. And if you choose not to play, that’s okay too. You can join me in watching the Major League Baseball (MLB) playoffs.
[i] One of the stories I like to tell is about visits to Las Vegas, sitting in cafes just off the gambling floors, watching those who have lost everything spend their last dollar on a Keno card. Then wait for the house to generate a “random” number. How do you think it usually turned out?
[ii] I know you’ve seen the social media posts by some of these brokerage companies bragging about how report days are their busiest days meaning more commission, win or lose.
[iii] I still don’t like the concept of “marketing years”. Supply and demand are fluid, ever changing, and in reality doesn’t have a cut-off date. But again, because the gambling industry needs to keep score, we have imaginary things called “marketing years”.