Good news: Used car prices continue to fall.
Bad news: They are still really high.
The average used vehicle carried a list price of $26,510 in January, according to Kelley Blue Book, and while that’s down about $600 from January, (about 2.2%) it's not much help when you consider used car prices have risen about 52% since 2019.
A rule of thumb when buying a car is to spend less than 10% of your take-home pay on your car payment and less than 15% to 20% on car expenses overall, according to NerdWallet.
So $26,510 is still a steep price for Americans earning a median income of about $54,000 a year.
It’s a lot easier to buy a car online these days, and you can set a search far and wide on most auto search engines. But if you find the used car of your dreams 2,000 miles away, you’ll need to factor in the cost of getting it home, whether you do that yourself or have it shipped.
A seller like CarMax (KMX), which offers warranties on its used cars, will deliver your car for a fee ranging from zero to $1,999, depending on location, NerdWallet says.
Hiring an open carrier to ship a car like a Toyota Camry can range from $649 from Miami to Boston to as high as $1,700 cross-country from Boston to L.A., according to Consumer Affairs.
Research by TheClunkerJunker.com, a family business based in Palmetto, Florida, that buys junk cars online, found that used cars in Alaska are the most expensive in the country--costing 10.7% more than the national average. That's followed by Hawaii, at 7.8% more than the national average.
It's not a big surprise that cars cost more in these far-flung locations, but shipping from the mainland has its price. According to one transport company, it costs $2,261 to ship a car from Seattle to Anchorage (by sea.) It can cost as much as $4,451 to ship a car from Florida to Alaska. From California to Hawaii, it’s about $1,500.
But depending on where you are, it could be worth it to expand your search. TheClunkerJunker found that Jersey City, N.J., had the lowest average used car price, at 9.08% below national average.
To compare the prices of used cars by state and city, TheClunkerJunker.com pulled the prices of 14 of the most popular car models in every state and the top 200 most populous cities from Cars.com. They pulled 183,640 listings in total.
To account for differences in things like car age and mileage, etc., TheClunkerJunker ran a log-linear regression model (what?) that normalized a list of parameters that we won’t get into, but it includes things like fuel types, transmission types and trim levels. Then they crunched a bunch more numbers to calculate the percentage of difference in prices in each location compared to the national average.
Their data was collected in October 2022. They used a national average price of $30,520 from 2021. Used car prices peaked at over $33,000 that year.
Here are the 10 most expensive cities to buy a used car, followed by the 20 cities where used cars are cheapest, according to the study by TheClunkerJunker.
Cities Where Used Cars Cost the Most
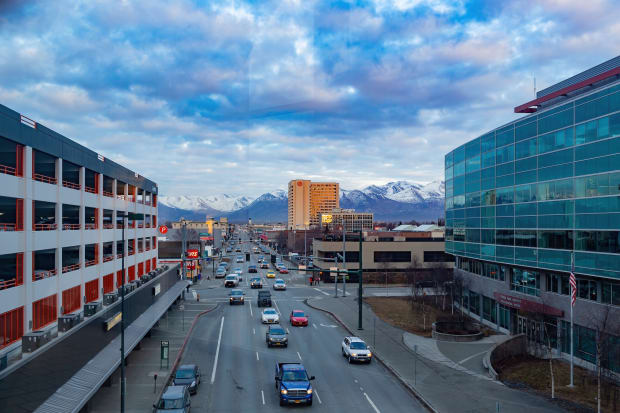
1. Anchorage, Alaska
Price difference from national average: +9.84%
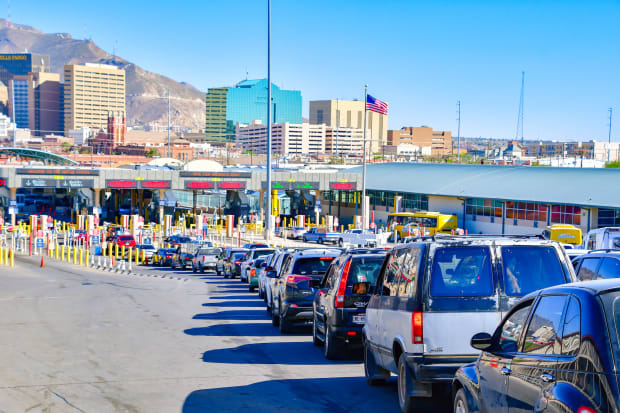
2. El Paso, Texas
Price difference from national average: +8.85%

3. Wichita, Kan.
Price difference from national average: +8.09%
Shutterstock
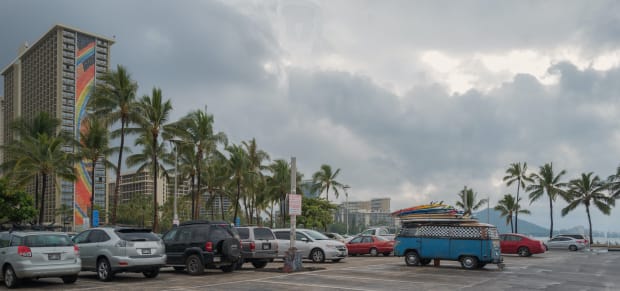
4. Honolulu
Price difference from national average: +7.78%
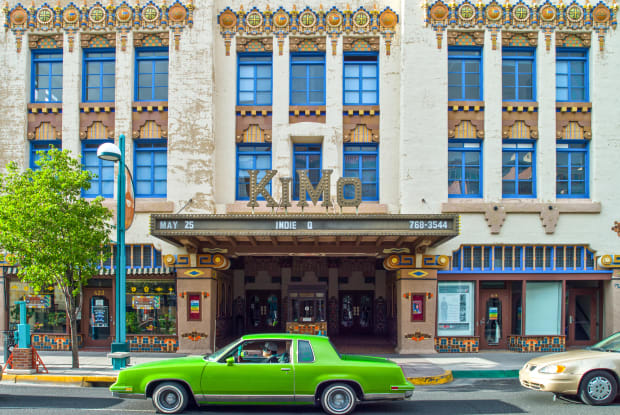
5. Albuquerque
Price difference from national average: +7.73%
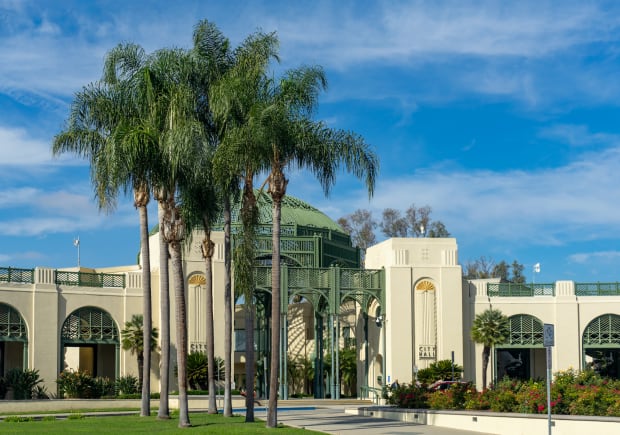
6. Escondido, Calif.
Price difference from national average: +6.97%
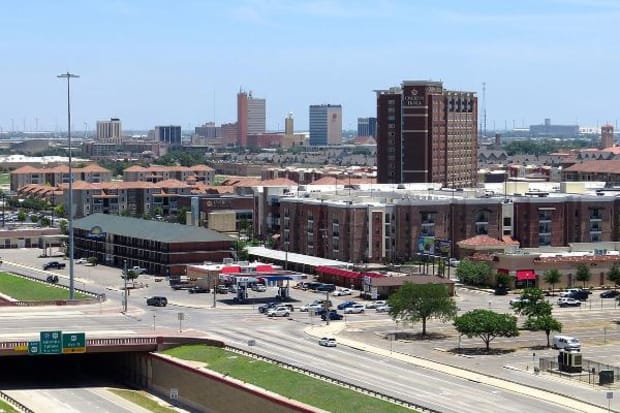
7. Lubbock, Texas
Price difference from national average: +6.28%
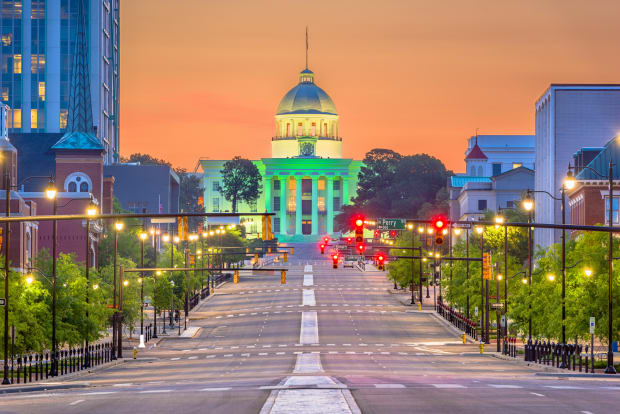
8. Montgomery, Ala.
Price difference from national average: +6.19%
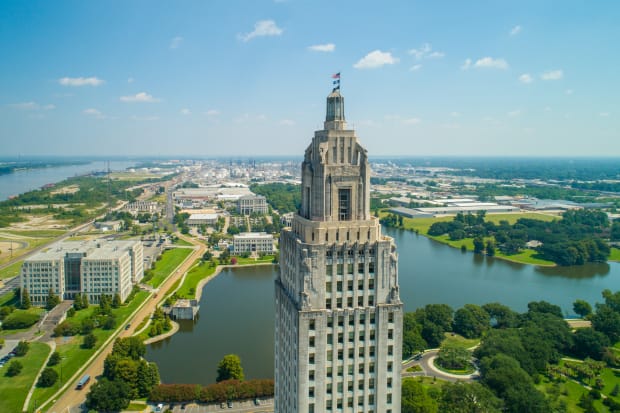
9. Baton Rouge, La.
Price difference from national average: +5.92%
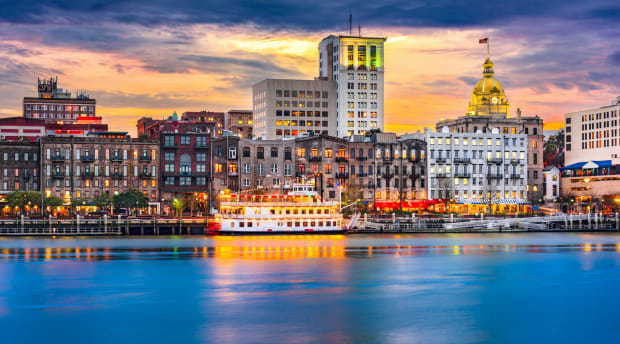
10. Savannah, Ga.
Price difference from national average: +5.89%
Now, here are the cities where used car prices are lowest.
20 Cities Where Used Cars Are Cheaper Than Average
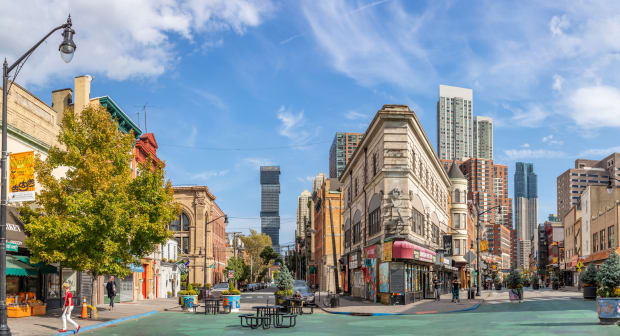
1. Jersey City, N.J.
Price difference from national average: -9.08%
At 9.08% below the national average, Jersey city has the cheapest used car prices. In terms of affordability, Jersey City also tops the list, requiring only 37.4% of the annual wage in the region to buy an average used car.
Remember that Jersey City was one of the places with serious flooding from Hurricane Ida in 2021. One auction site lists over 130 flood-damaged cars in the area.
Be vigilant for these types of cars wherever you shop, as the cars are often moved to other areas and sold without disclosure of flood damage, Consumer Reports says. Water can ruin electronics, lubricants, and mechanical systems, and corrosion can find its way to the car’s vital electronics, including airbag controllers, according to Consumer Reports.
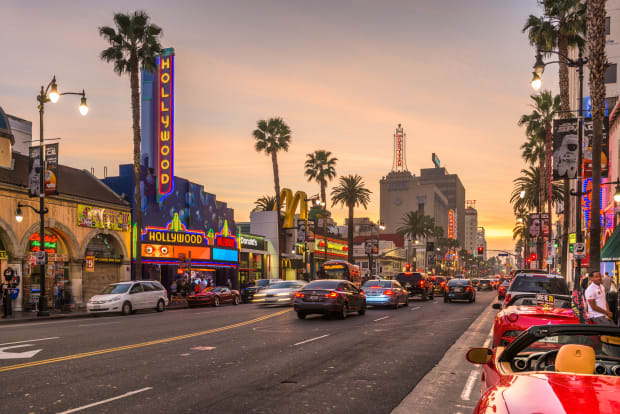
2. Hollywood, Calif.
Price difference from national average: -8.96%
Several areas in California also experienced flooding recently.
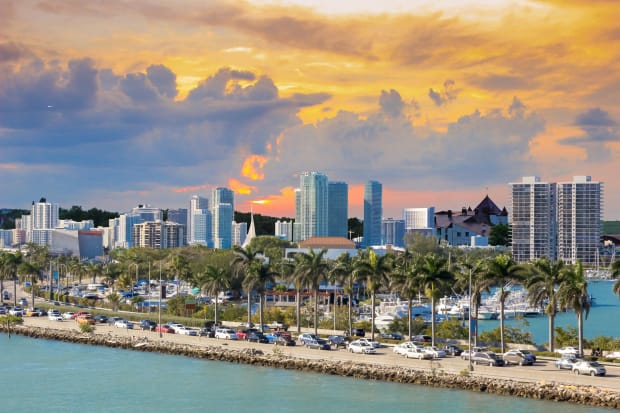
3. Miami
Price difference from national average: -7.95%
Carfax estimates the widespread flooding across Florida and the Carolinas in the wake of Hurricane Ian potentially damaged as many as 358,000 vehicles. That's in addition to the 400,000 water-damaged cars that Carfax data shows were already on the road in 2022 before Hurricane Ian.
Waterlogged vehicles can resurface anywhere around the country. Texas and Florida continue to lead the nation when it comes to the number of flood-damaged cars on the road, but Carfax says these vehicles also show up in states where flooding might not be top-of-mind for car shoppers.
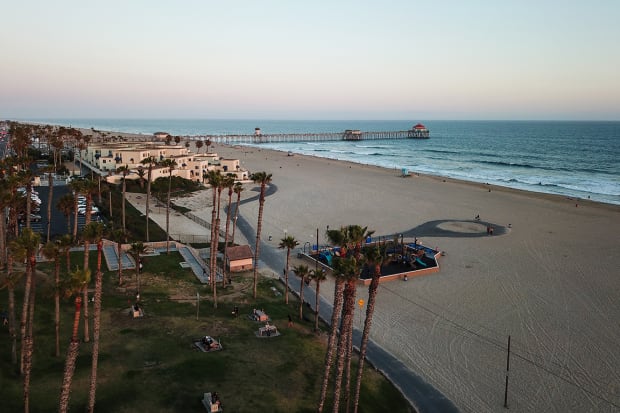
4. Huntington Beach, Calif.
Price difference from national average: -6.97%
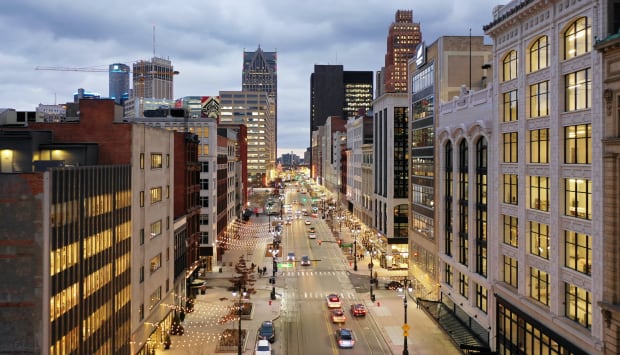
5. Detroit
Price difference from national average: -5.98%
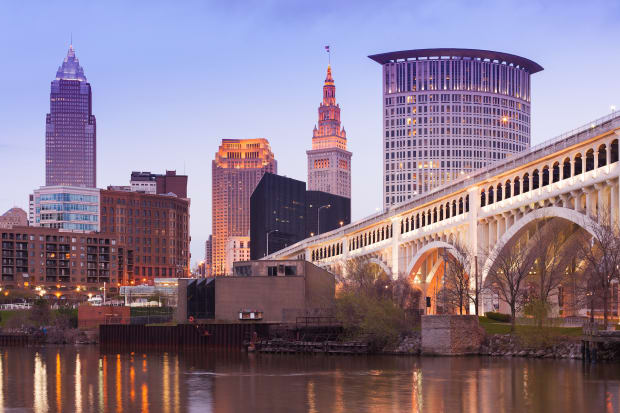
6. Cleveland
Price difference from national average: -4.31%
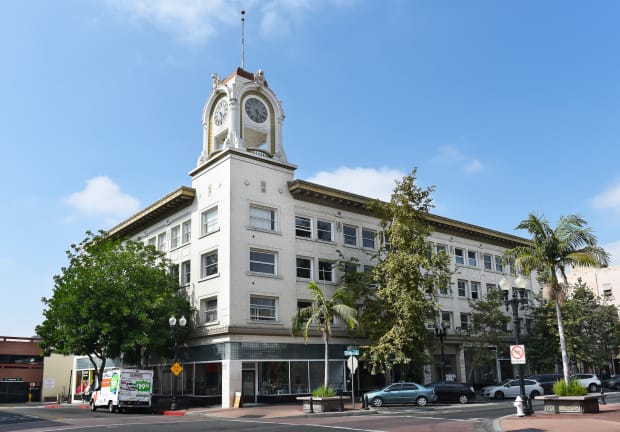
7. Santa Ana, Calif.
Price difference from national average: -4.28%
Shutterstock
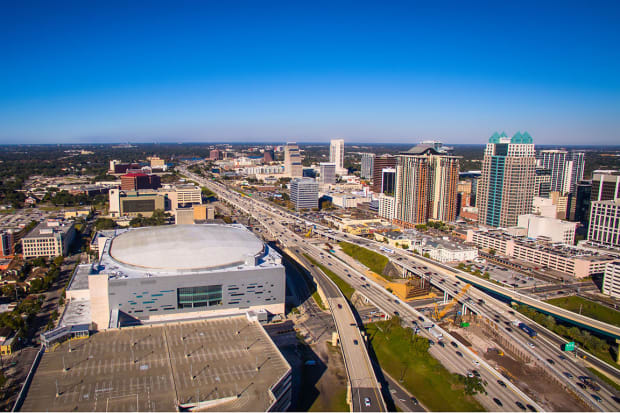
8. Orlando, Fla.
Price difference from national average: -4.11%
Shutterstock
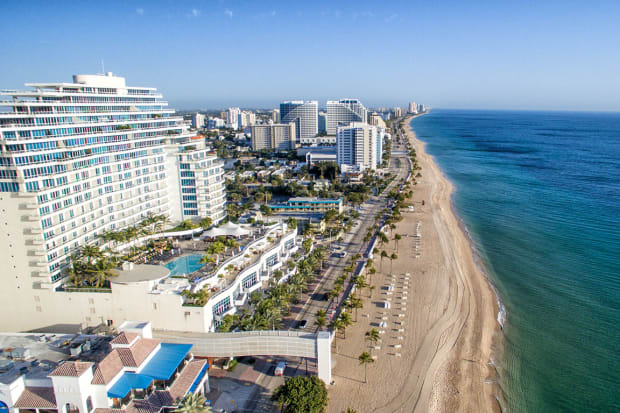
9. Fort Lauderdale, Fla.
Price difference from national average: -3.92%
Look for telltale signs of flood damage in a used car, like a musty odor or loose upholstery, Carfax advises.
Shutterstock
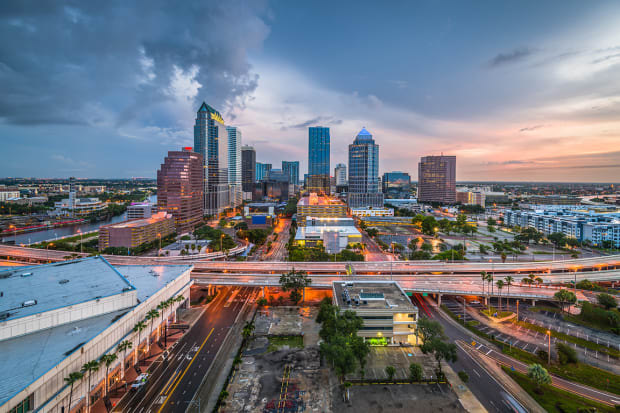
10. Tampa, Fla.
Price difference from national average: -3.78%
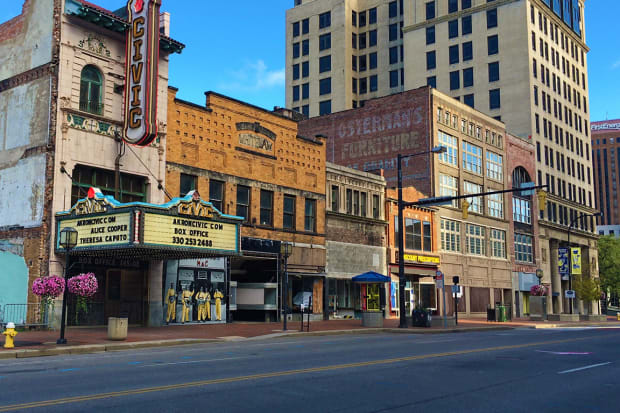
11. Akron, Ohio
Price difference from national average: -3.66%
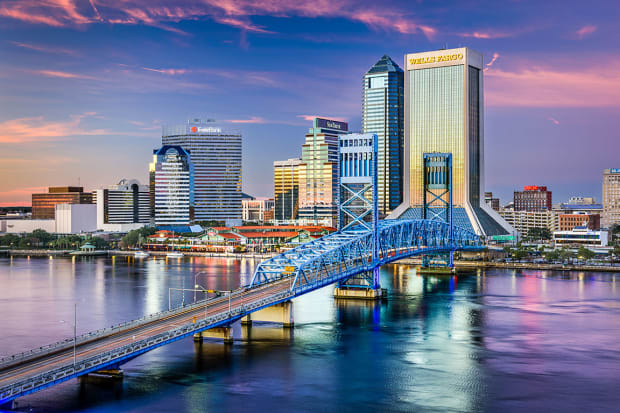
12. Jacksonville, Fla.
Price difference from national average: -3.45%

13. Kansas City, Kan.
Price difference from national average: -3.11%

14. Philadelphia
Price difference from national average: -2.89%
Shutterstock
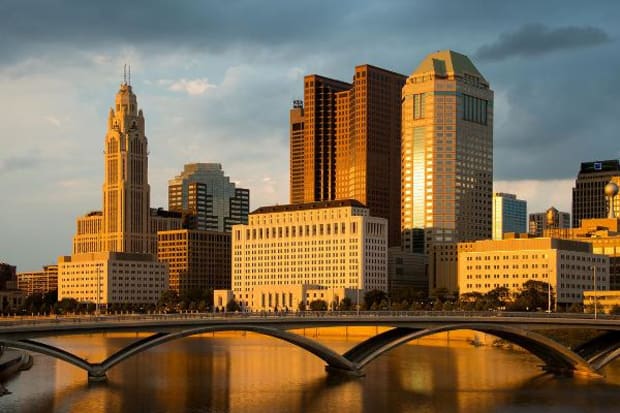
15. Columbus, Ohio
Price difference from national average: -2.88%
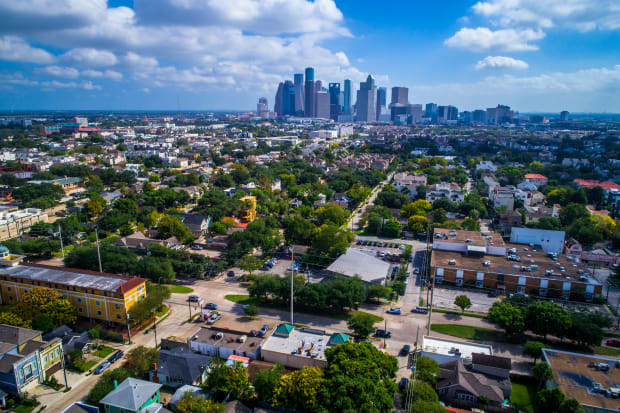
16. Houston
Price difference from national average: -2.75%

17. Tempe, Ariz.
Price difference from national average: -2.69%
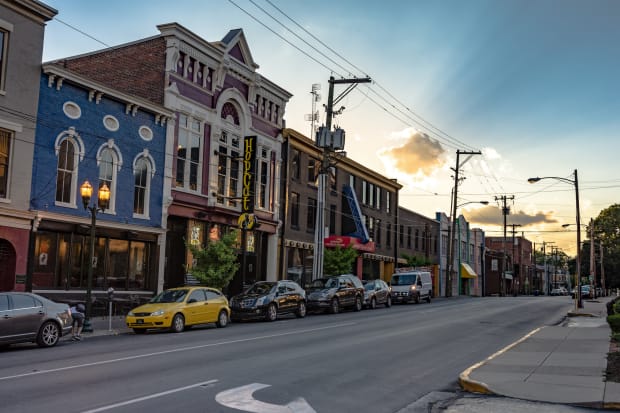
18. Lexington, Ky.
Price difference from national average: -2.52%
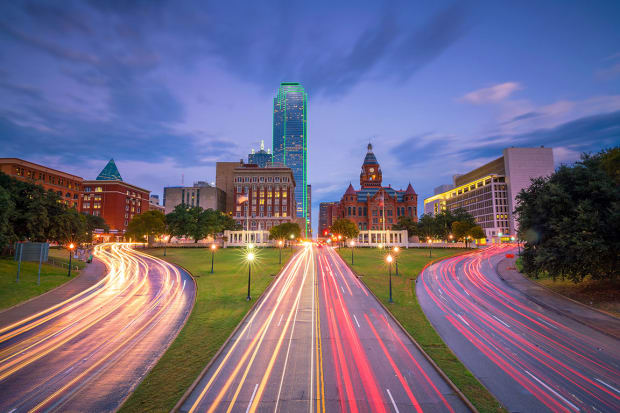
19. Dallas
Price difference from national average: -2.34%
Shutterstock
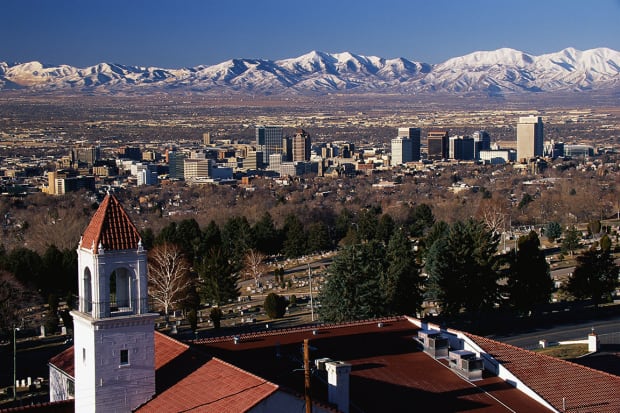
20. Salt Lake City, Utah
Price difference from national average: -2.28%
Read more about the methodology of this ranking at TheClunkerJunker.com.


