Amazon.com Inc. (NASDAQ:AMZN) was trading flat in the premarket on Tuesday after a bearish Monday saw the stock gap down 1.82% and slide an additional 1.84% intraday.
The Seattle e-commerce giant has been trading in sync with the S&P 500 recently, while Apple Inc. (NASDAQ:AAPL), the largest holding, has shown relative strength in comparison.
When the S&P 500 rejected the 200-day simple moving average (SMA) on Aug. 16, it sent a warning the bear cycle isn’t over. The recent bullish price action, which took traders through the summer earnings season, may have been merely a short-term bull rally.
Like the S&P 500, Amazon rejected the 200-day SMA on the same day. Since then, neither the market ETF nor Amazon has had enough power to attempt to break up the important bellwether indicator for a second time.
In contrast, Apple has been trading above the 200-day SMA since July 29, which has caused confusion amongst many traders and investors trying to gauge the longer-term direction of the market.
Monday’s sharp decline put Amazon close to a lower gap, which was left behind on July 29 following a bullish reaction to the company’s quarterly earnings print. For conservative bullish traders, the stock falling to fill the empty trading range may be a gift.
Want direct analysis? Find me in the BZ Pro lounge! Click here for a free trial.
The Amazon Chart: Patience may be the best way to play Amazon over the coming days because gaps on charts fill about 90% of the time. When a gap is close by, traders would prefer to see the gap filled sooner rather than later so that the stock is no longer pressured into the direction of the gap.
- If Amazon falls down to completely fill the gap, which exists between $122.84 and $132.41, traders can watch for the stock to print a bullish reversal candlestick, such as a doji or hammer candlestick, near the bottom of the range.
- On Monday, Amazon printed a bearish kicker candlestick, which indicates lower prices will come on Tuesday. The second most likely scenario is that Amazon will trade sideways for a period of time to consolidate the steep drop. If that happens, traders will want to see the average daily volume begin to decline, which could indicate the stock is running out of sellers.
- For bearish traders, Amazon left behind a small upper gap on Monday, which is also likely to be filled in the future, if the Seattle-based company bounces up to print its next lower high within the downtrend pattern, the stock may form a bearish reversal candlestick at the top of the upper gap.
- Amazon has resistance above at $136.83 and $142.18 and support below at $131 and $125.93.
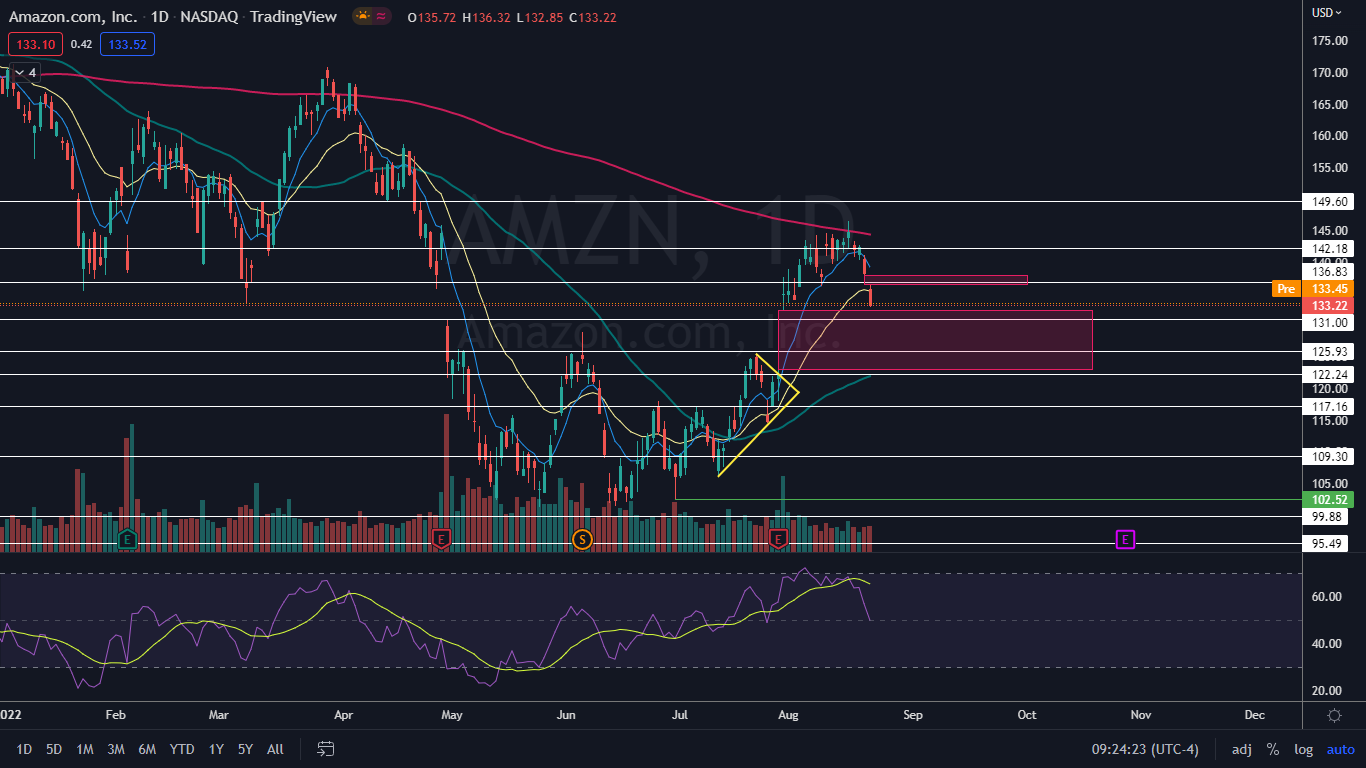
Photo by christian-wiediger via Unsplash