
As the WNBA’s 2026 awards roll out, the eye test could use a little backup. Three advanced metrics measure player value, each in its own way.
Regularized Adjusted Plus-Minus (RAPM) begins with lineups. It accounts for who is on the floor to estimate which players affect their team’s scoring margin the most. Win Probability Added (WPA) starts with, well, win probability. It measures which players are responsible for actions that shift their team’s chances of winning. Statistical Plus-Minus (SPM) uses—wait for it—the player stats. It assigns positive and negative values to a player’s stat line to estimate how impactful their production is.

Each method has its drawbacks. RAPM isn’t stable. WPA accounting is an imprecise process. SPM excludes key player skills. Defense, in particular, remains difficult to isolate at the individual level for all three metrics. There is considerable noise in a short, 44-game season, and no approach handles it perfectly. In other words, all-in-one metrics are not the arbiters of truth. They are pieces of evidence, evidence that should be checked alongside intuition and what can be seen with the naked eye.
With that being said, RAPM, WPA and SPM do offer three ways of answering who the most valuable player in the WNBA is. So, together, who is the WNBA MVP according to those all-in-one metrics?
You probably don’t need any numbers to tell you that.
Advanced Stats MVPs
The table shows each player’s rank in each of the advanced stats.
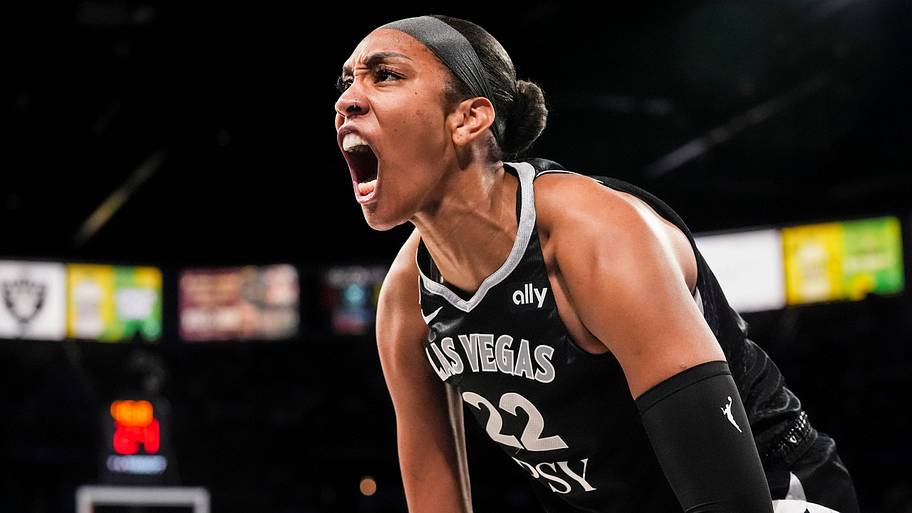
But if you do, A’ja Wilson ranks second in RAPM, first in WPA and first in SPM. Her average rank (1.3) across all three metrics is the highest of any player. Let’s break down each one, in reverse order.
Statistical Plus-Minus
SPM is the one common all-in-one metric that we haven’t touched on this season, so please excuse the preamble. The basic idea behind SPM is that it uses box score data to predict some measure of player impact. Traditionally, that measure is RAPM. Why? RAPM is divorced from traditional stats—think along the lines of plus-minus, which assigns the same point differential to every player on the floor regardless of which individual player scored—and is a somewhat useful proxy for a player’s value.
When individual stats are used to predict RAPM, the resulting mathematical model assigns positive and negative weights to each statistical category and adds them all up to get a rating. To oversimplify: The concept isn’t wholly unlike how fantasy points work. The differences are that those “weights” are learned from data, and that the SPM model used here allows the value of a particular stat to change at different levels of production.
The natural question, then, is which stats get fed in as inputs? The answer for this model:
- Shooting: two-point field goals made, two-point field goals missed, three-point field goals made, three-point field goals missed, free throws made and free throws missed, all per 100 offensive possessions.
- Ballhandling: assists and turnovers, both per 100 offensive possessions.
- Rebounding: defensive and offensive rebounds, both per 100 defensive rebounding and offensive rebounding opportunities while a player was on the court. (An opportunity is a missed shot.)
- Foul-related: Non-shooting fouls drawn and shooting fouls committed, per 100 offensive and defensive possessions, respectively.
- Defense: blocks recovered by the defense and steals, both per 100 defensive possessions.
Each of these stats helps the model predict RAPM better, but they don’t capture every aspect of the game worth quantifying. Notice how few measures of defensive performance are included. Defense, without the same level of tracking data the NBA provides, and even with it, is difficult to measure at the individual level. As a result, SPM as constructed here likely underrates players with strong defensive skills, particularly those whose defensive abilities don’t always manifest in steals and blocks.
What SPM does do is reward players for statistical efficiency. It ranks players highly who consistently produce positive outcomes and avoid negative plays at a high rate. It also punishes players for the reverse.
All of that is to say the top five players by SPM should make sense.
Wilson, the best player by SPM, ranked first in usage rate (32.0%) and still had the 11th-best true shooting percentage (62.4%). To put a historical spin on those numbers: She became just the third player in WNBA history to have a usage rate above 30% and a true shooting percentage above 60%. She’s also a high-end rebounder, a premier rim protector and the league’s top foul drawer. Top-tier statistical production looks a lot like what Wilson does on a night-in, night-out basis.
It’s also not a surprise to see Kelsey Mitchell and Caitlin Clark rank so highly. Mitchell’s season, like Wilson’s, was historic. She became the first guard in league history to shoot at least 50% on twos, 45% on threes and 85% on free throws; the model estimated that she added more value through shooting than any other player this season. Clark wasn’t far behind Mitchell. Her shooting contribution ranked fifth, while she also added substantial value through assists and drawing fouls. (Some of that value was offset by her 7.3 turnovers per 100 possessions, the highest in the league among players who played at least 500 minutes.)
Speaking of turnovers, Veronica Burton and Paige Bueckers find their way near the top of the list in part because they generate assists at a high rate while avoiding coughing up the ball. Burton was the fourth player to start every game and finish with an assist-to-turnover ratio above 3.5—Debbie Black, Sue Bird and Courtney Vandersloot were the others—and her net playmaking contribution ranked first this season. She also finished fifth in steals and 10th in fouls drawn per 100 possessions, bringing significant pressure on her opponents on both ends of the floor. Bueckers, meanwhile, became the first player to shoot at least 55% on twos and 40% on threes and average at least five assists per game.
Win Probability Added
WPA is straightforward: It credits players for how much they move their team’s chances of winning, using makes, misses, assists, rebounds, turnovers, steals, blocks and fouls. The odds of winning can swing considerably in close games, so a player who often performs in clutch situations can accumulate more WPA. (A made basket with 2:33 left in the first quarter counts for much less than a buzzer-beating game-winner.)
Here, again, Wilson ranks first. The metric partially rewards accumulators, which helps explain why Jessica Shepard ranks second on this list. She had the sixth-highest combination of points, rebounds and assists and the fifth-highest field goal percentage in the league. She also became the second player to average at least 10.0 rebounds per game and have an assist-to-turnover ratio of 2.5 or better.
One new face and two usual suspects round out the top five. Olivia Miles had the third-highest offensive WPA (scoring, assists, offensive rebounds, fouls drawn and turnovers) in the WNBA. Alyssa Thomas produced more WPA through assists than anyone, and Breanna Stewart did a little bit of everything, as usual. Of any player, she added the most win probability through blocks and steals.
Without assists and defensive rebounds (conservative WPA), Mitchell, Kayla McBride and Nneka Ogwumike ascend further up the rankings. Talk about going out on a high note: In her final season, Ogwumike was the WNBA's second-most clutch player.
(Prior-Informed) RAPM
As mentioned in the beginning, RAPM accounts for teammate and opponent strength to better estimate which players impact scoring margins the most. Prior-informed RAPM takes this one step further by slightly nudging players to their previous historical baseline so that the model doesn’t have to start from a blank slate. It is essentially a more sensible form of plus-minus.
The rankings haven’t changed much since the FIBA Women’s World Cup break. The two new entrants into the top 10 both play for the Dream: Jordin Canada and Angel Reese. Reese and Canada had the 10th- and 13th-highest net rating splits (+11.5 and +10.4, respectively) in the league. Reese, specifically, had the second-best defensive rating split (-7.9) in the league, meaning the Dream allowed 7.9 fewer points per 100 possessions when she was on the court compared to when she was off of it.
Are the numbers perfect? No. They are only approximations of player value. What they can do, though, is help back up what the eye can clearly see: A’ja Wilson is truly one of one.
MORE WNBA FROM SPORTS ILLUSTRATED
- Breanna Stewart Must Carry FIBA World Cup Intensity Into Liberty’s Lynx Matchup
- Expert Picks, Bold Predictions for 2026 WNBA Playoffs
- WNBA Playoffs First-Round Matchups: Breaking Down Each Team’s Strengths, Weaknesses
- Cheryl Reeve Has Already Cemented Her Legacy, But She’s Nowhere Near Finished
- Ranking the Five Best WNBA Rookies of the 2026 Season