Bitcoin (CRYPTO: BTC) has settled into a bullish flag pattern on the daily chart. The bull flag pattern is created with a sharp rise higher forming the pole, which is then followed by a consolidation pattern that brings the stock lower between a channel with parallel lines.
- For bearish traders, the "trend is your friend" (until it's not) and the stock may continue downward within the following channel for a short period of time. Aggressive traders may decide to short the stock at the upper trendline and exit the trade at the lower trendline.
- Bullish traders will want to watch for a break up from the upper descending trendline of the flag formation, on high volume, for an entry. When a stock breaks up from a bull flag pattern, the measured move higher is equal to the length of the pole and should be added to the lowest price within the flag.
A bull flag is negated when a stock closes a trading day below the lower trendline of the flag pattern or if the flag falls more than 50% down the length of the pole.
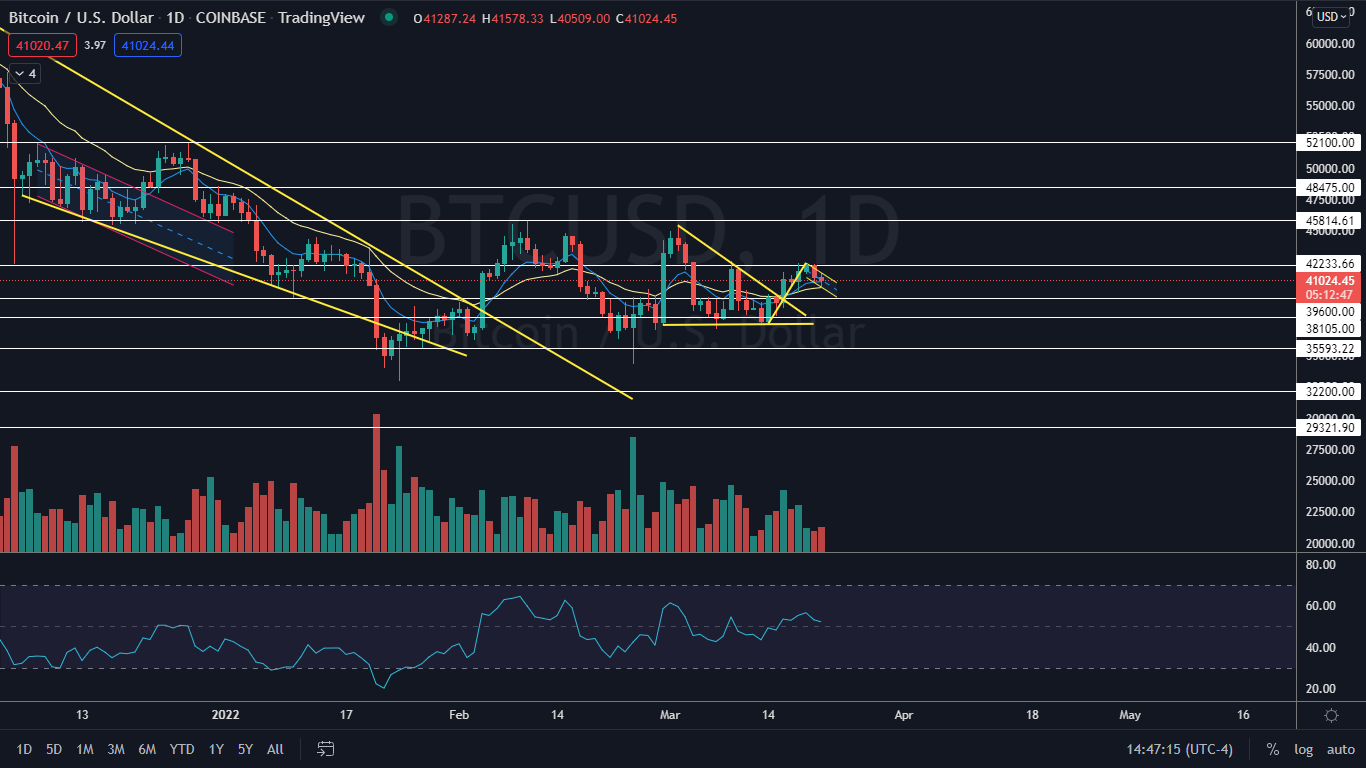
The Bitcoin Chart: On March 16, Bitcoin broke up from a descending triangle pattern on the daily chart and the move, combined with the upwards trend between March 14 and March 19, may be the pole of a bull flag pattern, with the move slightly lower on Sunday and Monday forming the flag.
If the pattern is recognized, the measured move is about 13%, which indicates Bitcoin could soar toward the $45,400 level in the future.
- If big bullish volume comes in on the break of the upper descending trendline of the flag, Bitcoin could reach the level quickly due to its inherent volatility.
- On Monday, Bitcoin looked to be printing a doji candlestick, which could indicate the break from the bull flag will come on Tuesday, as a doji is a reversal candlestick. If higher prices do come, the doji will also mark the higher low of a new uptrend pattern that Benzinga called out Sunday.
- The consolidation on Monday was being made on lower-than-average volume, which is healthy and indicates a lack of selling pressure. By midafternoon, Bitcoin’s volume was measuring in at about 8,700 compared to the 10-day average of 11,937.
- Bitcoin has resistance above at $42,223 and $45,814 and support below at $39.600 and $38.105.