
Advanced Micro Devices, Inc (NASDAQ:AMD) has settled into a bullish flag pattern on the daily chart. The bull flag pattern is created with a sharp rise higher forming the pole, which is then followed by a consolidation pattern that brings the stock lower between a channel with parallel lines.
- For bearish traders, the "trend is your friend" (until it's not) and the stock may continue downwards within the following channel for a short period of time. Aggressive traders may decide to short the stock at the upper trendline and exit the trade at the lower trendline.
- Bullish traders will want to watch for a break up from the upper descending trendline of the flag formation, on high volume, for an entry. When a stock breaks up from a bull flag pattern, the measured move higher is equal to the length of the pole and should be added to the lowest price within the flag.
A bull flag is negated when a stock closes a trading day below the lower trendline of the flag pattern, or if the flag falls more than 50% down the length of the pole.
See Also: M&A Deals Top $5 Trillion For First Time Ever In 2021, No Signs Of Slowing In 2022
The Advanced Micro Devices Chart: On March 21, AMD broke up bullishly from a descending trendline, which Benzinga predicted would happen before the market opened that day. On the two trading days since, AMD has back tested the trendline as support and held above the level.
- The rise up from a bottom at the $101.04 mark through the trendline combined with the two-day back test has settled AMD into a bull flag pattern. The measured move of the bull flag if it’s recognized is 16.36%, which indicates AMD could trade up toward the $130 level in the future.
- Traders and investors can watch for an upward break from the flag on higher-than-average volume on Thursday or Friday to indicate the pattern was recognized.
- AMD is also trading in a strong uptrend, with the most recent lower high most likely created on Wednesday. If the stock closes the trading day flat or near the high-of-day, it will print a doji or hammer candlestick, which indicates AMD will trade higher on Thursday and possibly break from the bull flag.
- AMD has resistance above at $118.13 and $122.49 and support below at $112.61 and $106.99.
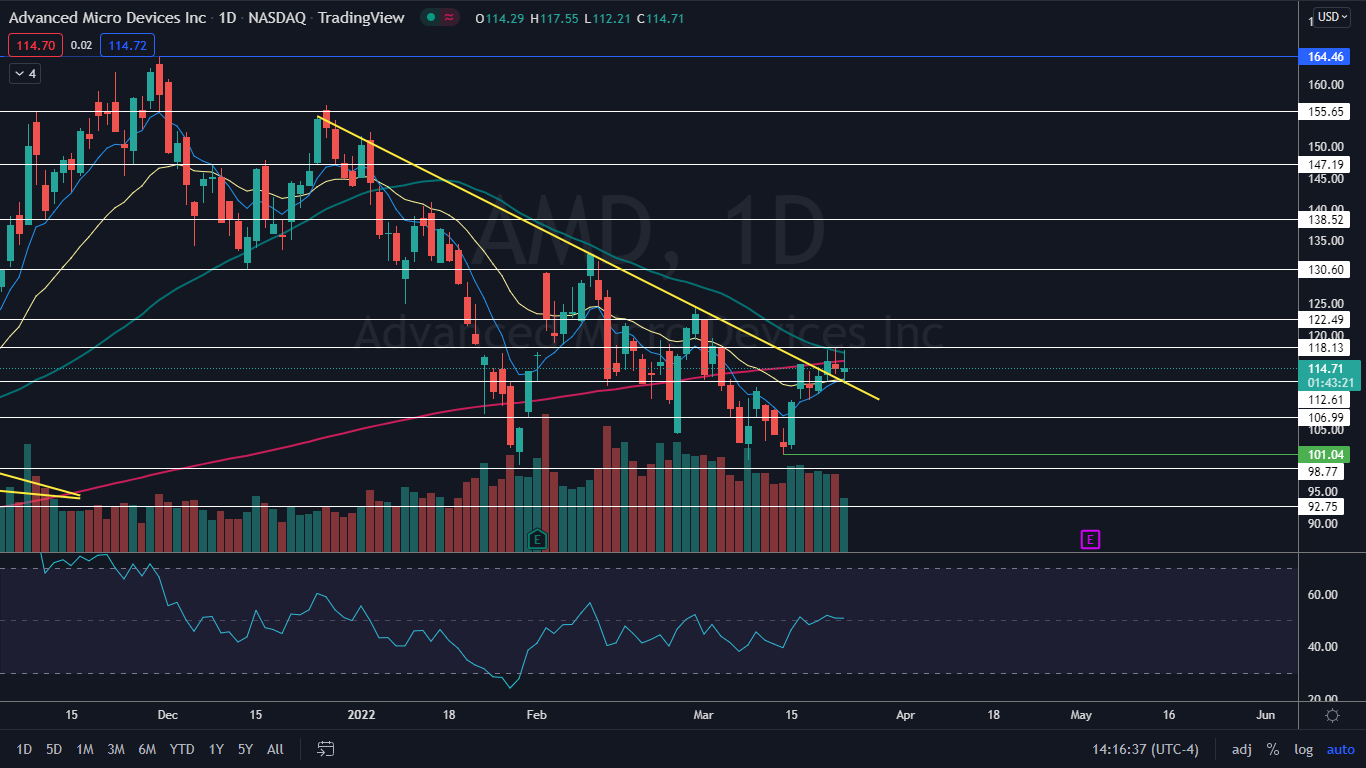
Photo: Courtesy of amd.com