On Sunday evening, Benzinga asked its followers on Twitter what they’re buying at the open on Monday. From the replies, Benzinga selected one ticker for technical analysis.
@KellySm99123652 and @thrumyeyeview is buying Advanced Micro Devices, Inc (NASDAQ:AMD).
Advanced Micro Devices reached an all-time high of $164.46 on Nov. 30, 2021, and between that date and Jan. 28 of this year, the stock declined almost 40% before bouncing up slightly. The stock then bounced up to reach a high of $132.96 on Feb. 9 before entering into another downtrend, which took the stock down to the $100.08 level on March 8 before reversing into an uptrend at that level.
The new uptrend may be partially due to a number of shorts deciding to cover their positions because the short interest on AMD has decreased considerably. Of AMD’s 1.19 billion share float, 46.21 million shares (meaning just 2.85%) are held short, according to the latest available data. The number is down from 68.31 million in January.
See Also: 28 Stocks Moving in Monday’s Pre-Market Session
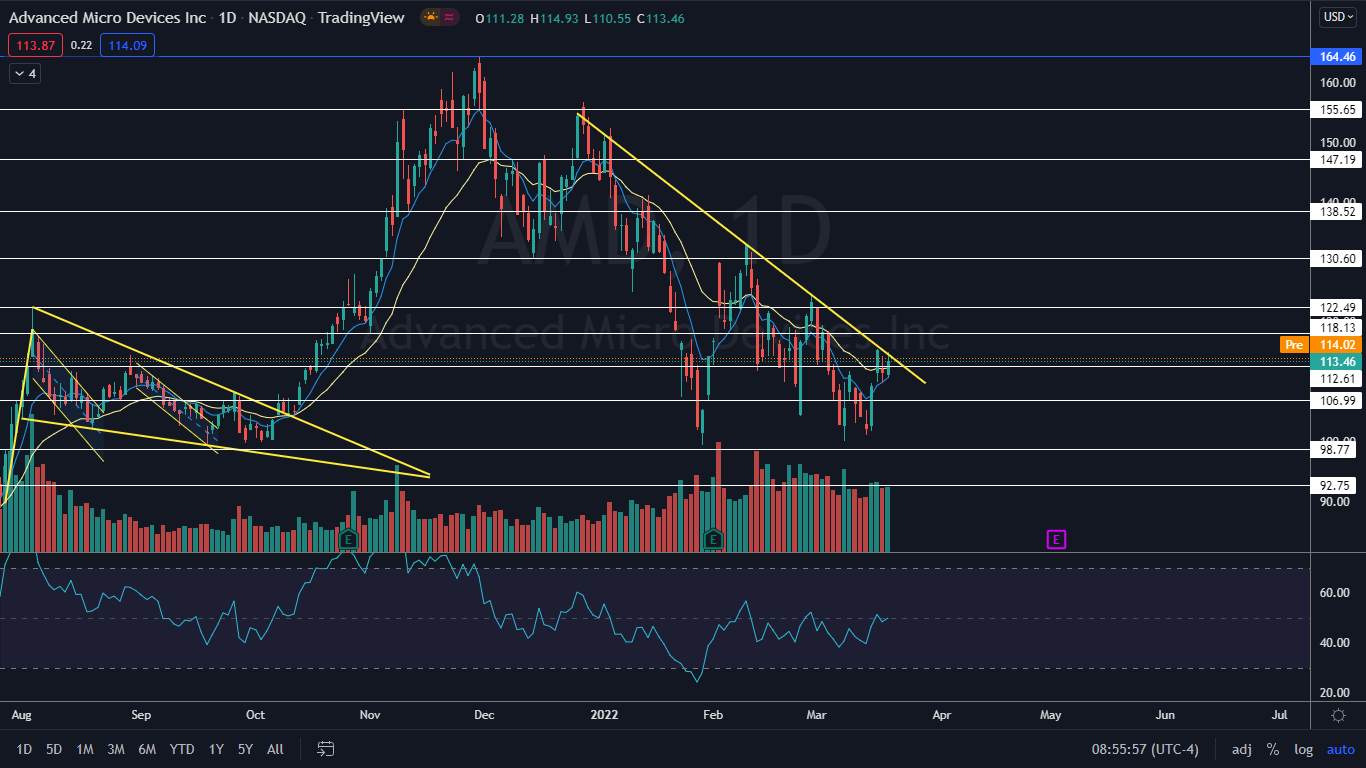
The AMD Chart: Since reversing into an uptrend, AMD has made a consistent series of higher highs and higher lows, with the most recent higher low formed on March 17 at the $109.71 mark and the most recent higher high created the day prior at $115.42. To continue in the trend, AMD will need to make another higher high on Monday or Tuesday but the stock is being held down by a descending trendline on the daily chart.
The descending trendline has been holding AMD down since Dec. 27, 2021 and each time the stock has attempted to break up from the area, AMD has rejected the trendline as resistance. If AMD makes a higher high over the coming trading sessions, the stock will break above the trendline and if that happens on higher-than-average volume, bullish traders can confirm the pattern has been recognized and a larger move to the upside is likely in the cards.
If the break of the trendline doesn’t take place on Monday and AMD continues to consolidate, the stock looks to be forming into a bull flag pattern beneath the trendline, with the pole created on March 14 and March 16 and the flag created over the trading days that have followed. If the bull flag pattern is recognized, the measured move is about 15%, which indicates AMD could trade up toward the $126 level.
AMD is trading above the eight-day and 21-day exponential moving averages (EMAs) but with the eight-day EMA trending below the 21-day. If the stock is able to hold above the 21-day EMA for a longer period of time, the eight-day EMA will cross above the 21-day, which would give bulls more confidence going forward.
Want direct analysis? Find me in the BZ Pro lounge! Click here for a free trial.
- Bullish traders want to see continued consolidation within the bull flag pattern or for big bullish volume to come in and break AMD up from the descending trendline without further sideways trading. The stock has resistance above at $118.13 and $122.49.
- Bears want to see the upper trendline continue to act as heavy resistance and for the area to continue pushing AMD down until the stock loses support at the psychologically important $100 level. Before the stock could reach that area, AMD has support at $112.61 and $106.99.

See Also: Morning Brief: Top Stories Dominating Financial Media on Monday, March 21


