Microsoft Corporation (NASDAQ:MSFT) is set to print its fiscal third-quarter financial results after the market closes on Tuesday. The stock was trading about 3.5% lower heading into the event.
When the tech giant printed its second-quarter results on Jan. 25, the stock gapped up over 6% the following day but eventually resumed its downtrend, which brought Microsoft shares to a nine-month low of 271.52 on Feb. 24.
For the second quarter, Microsoft reported an adjusted EPS of $2.48 on revenue of $51.7 billion. Both numbers topped consensus analyst estimates of $2.31 and $50.9 billion, respectively.
From a technical analysis perspective, Microsoft’s stock looks set to fall lower over the coming days but it should be noted that holding stocks or options over an earnings print is akin to gambling because stocks can react bullishly to an earnings miss and bearishly to an earnings beat. Options traders particularly, those who are holding close dated calls or puts, take on extra risk because the intuitions writing the options increase premiums to account for implied volatility.
Want direct analysis? Find me in the BZ Pro lounge! Click here for a free trial.
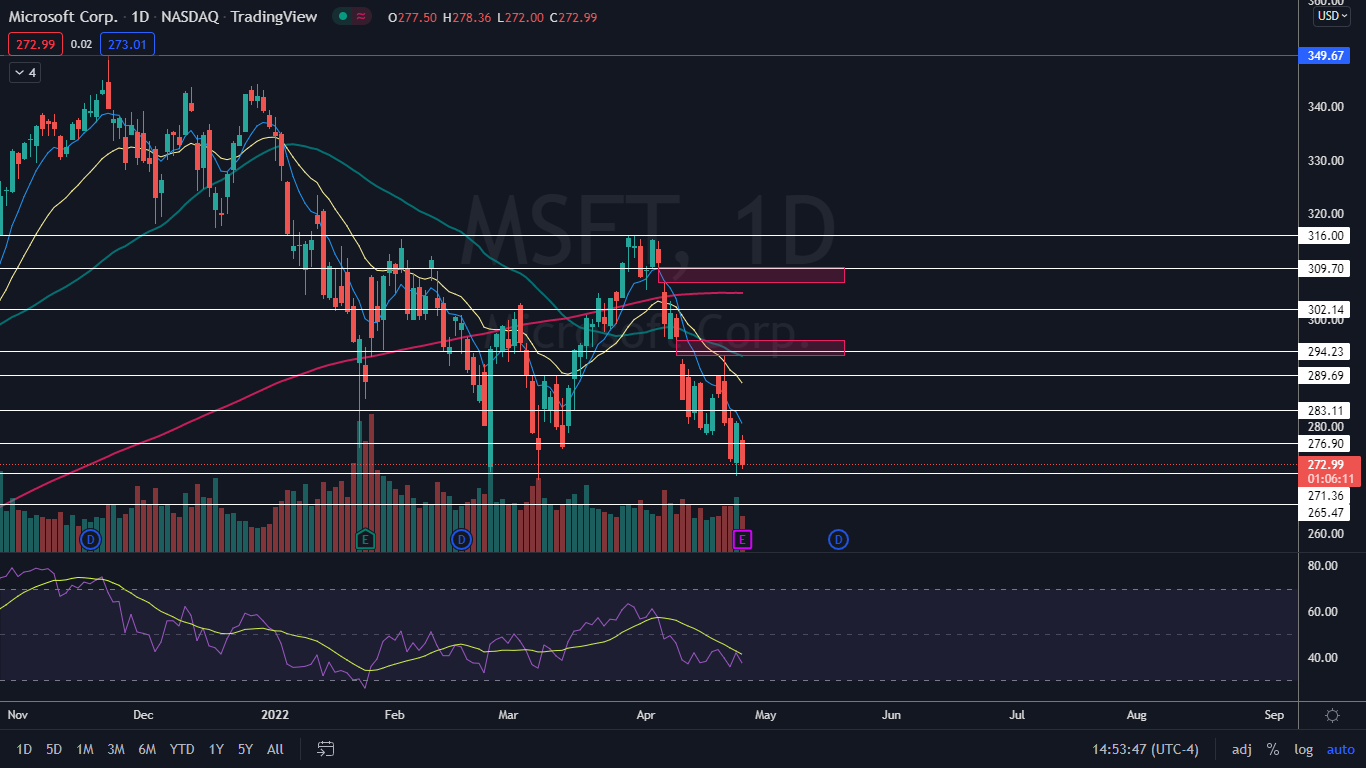
The Microsoft Chart: Microsoft has been trading in a steep downtrend since April 4, when the stock formed a bearish quadruple top pattern at the $316 level. The most recent lower high was printed at the $293.30 level on April 21 and the most recent confirmed lower low was printed on April 18 and April 19 at $278.34.
- On Tuesday, Microsoft was forming an inside bar pattern on the daily chart, with all of the price action within the range of Monday’s mother bar. The formation leans bullish in this case because Microsoft was trading lower before forming the inside bar but traders and investors can watch for a break up or down from Monday’s candlestick on higher-than-average volume to gauge future direction.
- If Microsoft closes the trading day near its low-of-day price, it will print a bearish Marubozu candlestick, which could indicate lower prices will come on Wednesday. Bulls would prefer to see the stock bounce up to print a hammer candlestick, which could indicate higher prices are on the horizon and Monday’s low-of-day is another lower low.
- Microsoft has two gaps above on the chart, with the first between $293.30 and $296.28 and the second between the $307 and $309.87 levels. Gaps on charts fill about 90% of the time, which indicates Microsoft is likely to eventually fill both empty trading ranges.
- Microsoft has resistance above at $276.90 and $283.11 and support below at $271.36 and $265.47.
See Also: This Investor Prefers Meta Stock Over Amazon And Microsoft: Here's Why