In a recent opinion article, Economic Advisory Council member Shamika Ravi article raised concerns about the quality of data that India’s national surveys – the National Sample Survey (NSS), the Periodic Labour Force Survey (PLFS), and the National Family Health Survey (NFHS) – collect.
Dr. Ravi raises two main issues: overestimation of rural populations and different response rates across wealth groups proxied by income/expenditure, with lower response rates in wealthier groups. The combined inference is that these surveys may be biased towards underestimating urban, wealthier groups.
There are quality issues
We agree that Dr. Ravi has valid concerns about data quality and about representativeness or generalisability. It would be safe to assume such issues should concern only the statisticians assisting the survey design or the researchers and analysts using these data for insights. But Dr. Ravi suggests that these issues concern us all because they “systematically underestimate India’s progress and development”.
If we agree on the existence of data quality issues, we must assess their magnitude. The two points of discussion on the overestimation of the rural population are its depiction and the extent.
Truncated axis
Other responses to Dr. Ravi’s article have noted that an accompanying graph, depicting the rural population percentage, was misleading because the x-axis had been truncated. Dr. Ravi has responded that the “grammar of graphics” supports her visualisation choice. We disagree. Truncating an axis, especially without explicit breaks or an accompanying explanation, is a well-documented problem.
Multiple studies have shown that axis truncation leads to a distorted perception of the effect size, i.e. readers view differences to be larger than they really are. Leading scientific publishers, including Nature and the American Medical Association, advise against truncated axes.
(For all discussion below, we focus on NSS data, but similar results can be demonstrated for PLFS and NFHS data as well.)
We created Dr. Ravi’s rural overestimation graph ab initio (figure 1). We calculated estimates for eight NSS surveys and took Census-based projections from the Report of the Technical Group on Population Projections (RTG-PP; 2019). All the data used and the scripts are available here. Comparing this figure with the one in Dr. Ravi’s article shows that the differences between projections and survey estimates appeared larger there than they really are.

The error bars for the estimates in Dr. Ravi’s figure are also more spread out than they ought to be. Sampling errors for basic variables like population become very small with large sample sizes in such surveys.
Acceptable overestimation
The difference in the survey estimates and projections for the rural population fraction range from 2.57% points to 4.40% points. This brings us to the more challenging discussion: How much overestimation of the rural population is acceptable – 1%, 3%, 5%? This is a difficult technical problem.
A few days after Dr. Ravi’s article appeared, she and her collaborators released a working paper attempting to answer this question. They applied a metric called data defect correlation. They assessed the overestimation of rural and other population groups in two parts of the NSS 68 survey (2011-2012): ‘Household Consumption Expenditure’ and ‘Employment-Unemployment’. They used the 2011 Census data as the reference or a ‘ground truth’.
Although Dr. Ravi didn’t use the metric in her article, it follows the similar tradition of comparing the Census-based projections with sample survey estimates. The problem here is that the data defect correlation metric isn’t built to allow survey estimates to be compared to projections because projections cannot be taken as reliable reference So, comparing population projections and survey estimates wouldn’t tell us anything useful about data quality.
Response rates
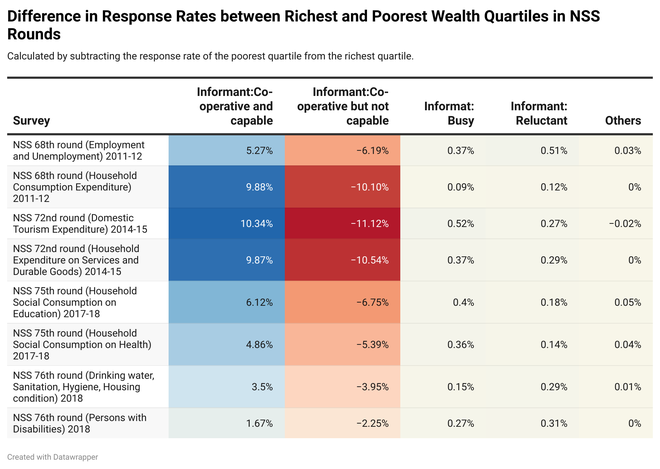
The second issue is the differential response rates across wealth groups. The validity of this concern depends on the magnitude of such differences. We analysed national estimates for multiple response categories across wealth quartiles in eight NSS surveys.
Figure 2 shows the differences between response-rate estimates for the richest and the poorest quartiles for each response category. The positive differences in the fraction of respondents who were cooperative and capable between the richest and poorest quartiles denote a disagreement with Dr. Ravi’s concern.
Further, the percentage-point difference in the fraction of reluctant respondents between the richest and poorest quartiles varies from 0.12% to 0.51% while that for busy respondents ranges from 0.09% to 0.52% across surveys. So, the response rates for these categories are negligibly different.

The negative differences also show that respondents who are cooperative but not capable belong more to the poorest than the richest quartiles. So there’s limited reason to believe that the responses from the wealthier sections of the population were significantly discounted in the NSS.
Scholarly response
Data quality concerns about surveys all around the world are often raised by those working with them. Xiao-Li Meng, who originated the data defect correlation metric, has often criticised the quality of data produced by U.S. surveys. People have also noted other concerns with the NSS, such as non-representativeness and non-coverage issues in some Indian states, discrepancies in sex, marital status, and other variables, going back to 1988. Demographic and health surveys – of which the NFHS is a type – have been criticised for biases in stillbirth and early neonatal mortality as well.
But these concerns have also been justified through rigorous analyses followed by scholarly editorial checks and peer-review, before being released to the people at large. Further, such cautionary flags have almost always been accompanied by direct corrective measures to help those dealing with these data. In fact, devising ways to deal with various issues in survey data is an active area of research in India and beyond.
Maturity of methods
This said, the idea that large surveys can be non-representative and induce bias as a result is new. Professor Meng’s method of quantifying such bias is only five years old and was first applied to a major example in vaccination surveys in the U.S. only two years ago. Researchers need more time for these methods to mature and to be adopted in the appropriate contexts. Only then can they inform crucial changes.
For example, if researchers find that a part of the rural overestimation bias is due to a lack of the appropriate sampling frame, given the 2011 Census is 13 years old now, we will need Census 2021 to be undertaken and completed posthaste to improve the data quality. In this sense, we agree with Dr. Ravi that discussions, and actions if warranted, around data quality are the need of the hour.
Most Indians live in rural areas
Our final concern is about a suggestion in Dr. Ravi’s article, articulated as “gap between ground realities and survey estimates”, “population projections falling short of rapid pace of change on ground”, and that “these surveys grossly and systematically underestimate India’s progress and development”.
A question arises: if no data (from surveys or projections) capture rapid urbanisation, how can we claim that it exists? Our own work has found strong agreement between modelled data from reliable international sources and India’s Census-based projections for total, rural, and urban populations for 2017.
Dr. Ravi’s suggestion that “progress” in other dimensions, including health, wealth, and social development, that are tied to urbanisation is being underestimated opens the door to a more serious problem: that of rural-urban disparity. That is, if our rural populations did as well as urban populations on all such indicators – overestimated or not – there wouldn’t be any concerns about systematic underestimation of improvements across the economy.
But data from various sources confirm that rural India lags behind its urban counterpart, which makes its overestimation a problem beyond the valid data-quality concerns. Focusing on rural-urban disparities in health, wealth, etc. is essential given we all agree that most Indians live in rural areas.
In his 2018 paper, Prof. Meng noted that his interest in the representativeness bias problem arose from the question, “Which one should we trust more, a 5% survey sample or an 80% administrative dataset?” The corollary here might be: Which one should we trust more, biased survey estimates or unsupported optimistic speculations about on-ground progress?
Siddhesh Zadey is cofounder of the non-profit think-and-do tank Association for Socially Applicable Research (ASAR) India and a researcher at the Global Emergency Medicine Innovation and Implementation (GEMINI) Researcher Centre, Duke University US. Pushkar Nimkar is an engineer turned economist currently volunteering as a data analyst with ASAR. He also works at the Department of Economics at Duke University. Parth Sharma is a physician and a public health researcher who volunteers at ASAR. He is also the founder of Nivarana.org.


