Ethereum Classic (CRYPTO: ETC) was showing strength in comparison to many other cryptos Wednesday, surging up about 7% at one point, compared to Bitcoin (CRYPTO: BTC) and Ethereum (CRYPTO: ETH), which were trading near flat.
Ethereum Classic may be showing strength ahead of Ethereum’s Merge, which takes Ethereum from proof-of-work to proof-of-stake, with one of the aims of lowering its environmental impact.
Related Link: Wen Merge? When The Ethereum Merge Will Likely Happen — And What It Means For The Cryptocurrency
The transition may be making Ethereum Classic more attractive because Ethereum will no longer be able to be mined.
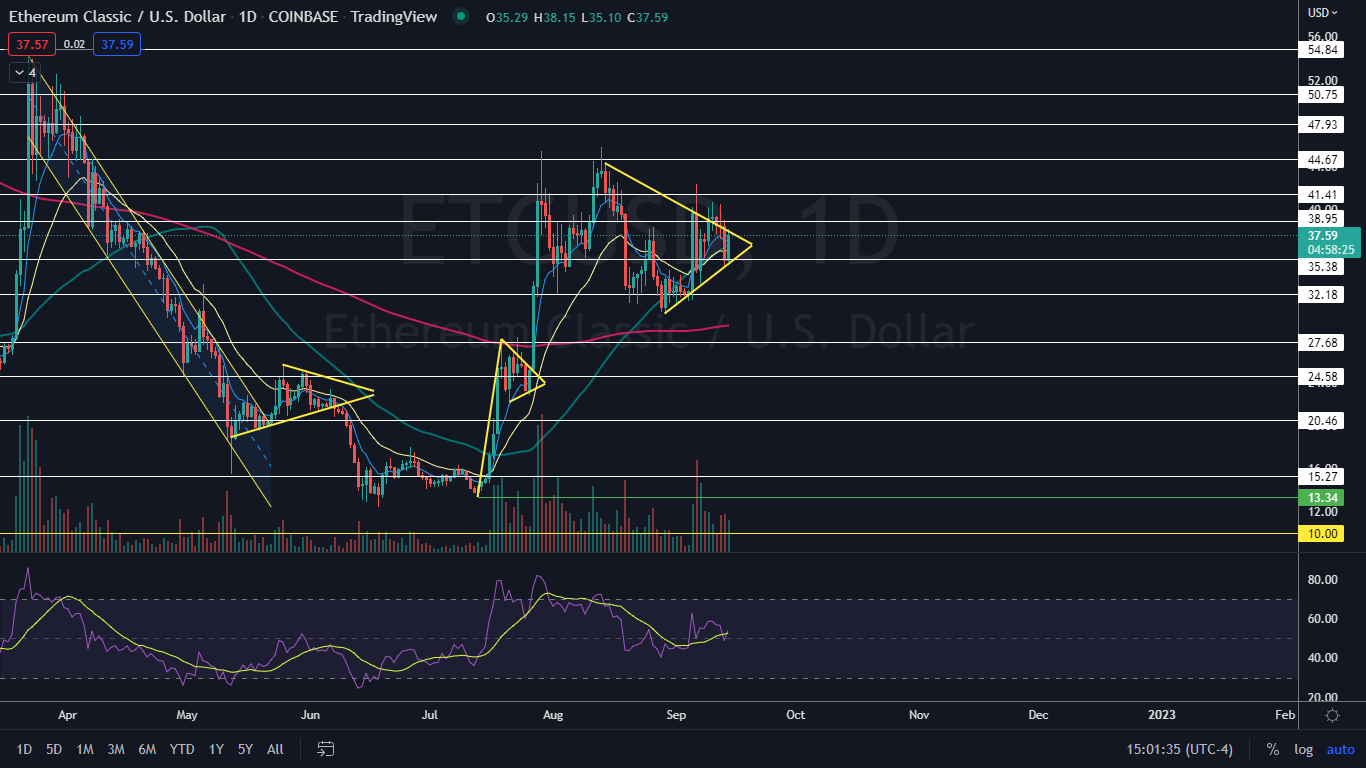
The move higher within Tuesday’s trading range had Ethereum Classic forming an inside bar on the daily chart.
An inside bar pattern indicates a period of consolidation and is usually followed by a continuation move in the direction of the current trend.
An inside bar pattern has more validity on larger time frames (four-hour chart or larger). The pattern has a minimum of two candlesticks and consists of a mother bar (the first candlestick in the pattern) followed by one or more subsequent candles. The subsequent candle(s) must be completely inside the range of the mother bar and each is called an "inside bar."
A double, or triple inside bar can be more powerful than a single inside bar. After the break of an inside bar pattern, traders want to watch for high volume for confirmation the pattern was recognized.
Bullish traders will want to search for inside bar patterns on stocks that are in an uptrend. Some traders may take a position during the inside bar prior to the break while other aggressive traders will take a position after the break of the pattern.
For bearish traders, finding an inside bar pattern on a stock that's in a downtrend will be key. Like bullish traders, bears have two options of where to take a position to play the break of the pattern. For bearish traders, the pattern is invalidated if the stock rises above the highest range of the mother candle.
Want direct analysis? Find me in the BZ Pro lounge! Click here for a free trial.
The Ethereum Classic Chart: Ethereum Classic’s inside bar is neutral because the crypto is also trading within a symmetrical triangle on the daily chart. If Ethereum Classic breaks up or down from Tuesday’s mother bar on higher-than-average volume, the crypto will also break north or south from the triangle pattern, which could help to indicate direction over a longer time period.
- Ethereum Classic is trading above the 50-day and 200-day simple moving averages (SMAs), with the 50-day SMA trending above the 200-day, which indicates the crypto is currently experiencing a bull market. A golden cross appeared on Ethereum Classic’s chart when the 50-day crossed above the 200-day on Aug. 20, which indicated bullish price action was likely to continue.
- Ethereum Classic will hit the apex of its symmetrical triangle on Sept. 20 and if the crypto doesn’t break from the inside bar pattern before then, traders can watch for Ethereum Classic to continue consolidating sideways on lower-than-average volume.
- Ethereum Classic has resistance above at $38.95 and $41.41 and support below at $35.38 and $32.18.

Photo: Shutterstock


