As Bengaluru grows further outwards and faster than it can cope, water supply is one of the first casualties. Attempting to piece together the puzzle – where Bengaluru’s water comes from, where it is stored, who consumes it, where the wastewater goes – is an essential first step to reduce the city’s vulnerability to floods and drought. We zoom into four different aspects to do this.
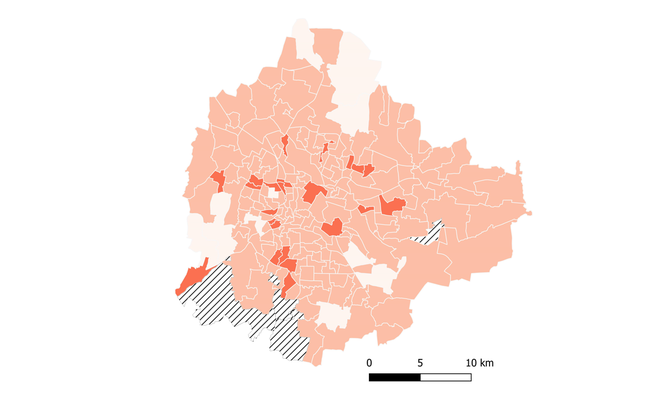
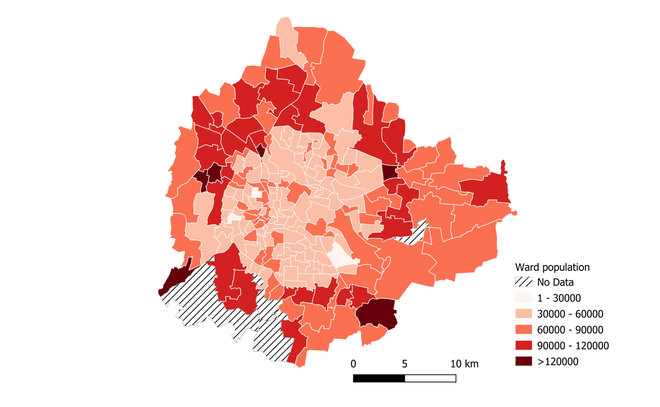
The city’s population increased from 8.7 million in 2011 to about 12.6 million in 2021 (projected). Most of the growth has been in the periphery (Maps 1 and 2).
Also watch: Watch | Why is Bengaluru staring at a severe water shortage?
Map 1 | The map shows the ward population in Bengaluru in 2011.
Map 2 | The map shows the ward population in Bengaluru in 2021.
Maps appear incomplete? Click to remove AMP mode
We estimate that the total demand for freshwater is approximately 2,632 million litres per day (MLD), which is higher than what is officially supplied through the Cauvery and through groundwater sources. Water from Cauvery that is used for the city’s needs has increased from 940 MLD to 1,460 MLD in the same period which, after subtracting losses, only serves half the demand. In addition, Bengaluru consumes an estimated 1,392 MLD of groundwater. This is worrying because groundwater recharge rates remain significantly lower than extraction rates.
Also read: Bengaluru, the parched IT capital of India
Map 3 | The map shows the variation in groundwater levels between 2022 and 2023.
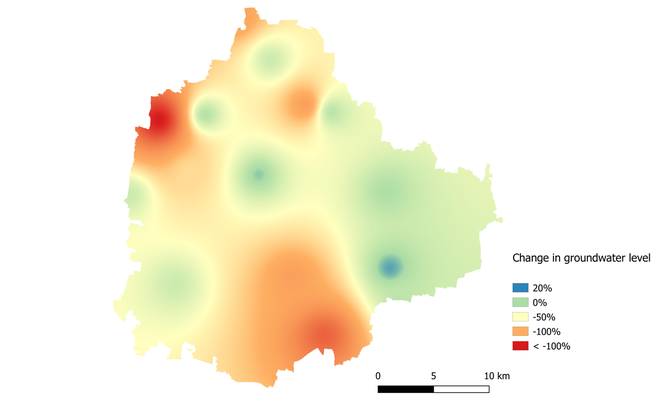
Bengaluru recorded an above-average rainfall in 2022 while 2023 ended in a deficit. As the rainfall levels dropped, so did the groundwater level, and the periphery was impacted the most (Map 3).
Map 4 | The map shows the BWSSB water supply lines in Bengaluru.
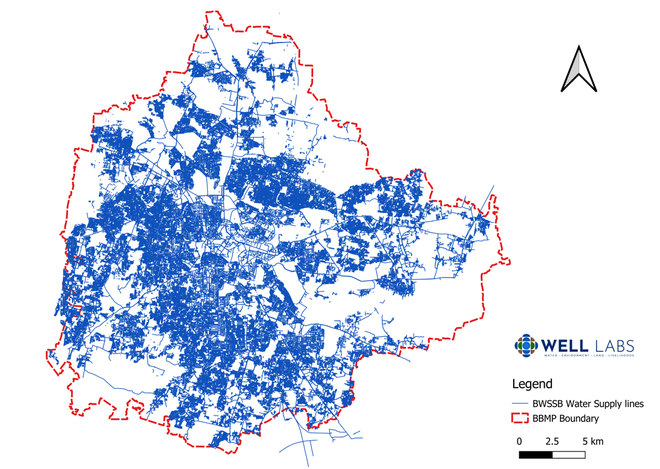
As the water table drops, these areas now face borewell failures. Moreover, as shown in Map 4 , many areas in the periphery don’t yet have access to piped supply.
Bengaluru was not always dependent on pipelines or borewells. Most of its water bodies were originally ‘tanks’, rainwater harvesting structures constructed mainly to serve irrigation and livestock. The undulating terrain of the city allowed for man-made cascading lake systems, which played a critical role in water supply. When piped water supply was introduced, lakes began to lose importance. Today, with rapid urbanisation, lakes have either been directly encroached upon or are drying out as the connections between them are lost. This has not only resulted in a more parched city but also aggravated the risk of flooding. The lakes and storm water drains have also become a dumping ground for sewage from the buildings around them and in their catchment, affecting the possibility of them being used to capture rainwater or storm water.
The maximum volume available to be held in lakes is about 41,600 million litres, but through a model we developed, we estimate that about 1,000 million litres of sewage is released into lakes every day making it unsuitable for use as a source of water.
Map 5 | The map shows the perrenial and seasonal lakes in Bengaluru.
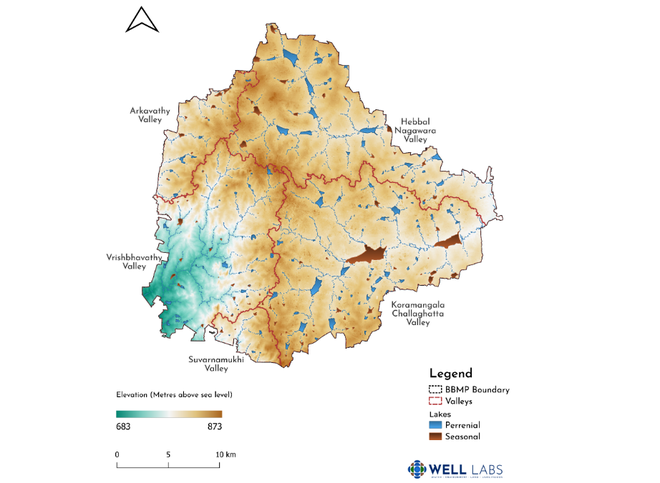
In Map 5 (for Bruhat Bengaluru Mahanagara Palike alone), we differentiate between perennial and seasonal lakes. Most of the water bodies in the city were once seasonal, meaning they captured and stored rainfall. The ones that are left are now largely perennial as a result of sewage entering them and keeping them full throughout the year.
Rainwater harvesting could make a dent on the freshwater needs of the city but it pales in comparison to wastewater. Currently, only one third of the city’s wastewater is redirected for external reuse, which means it is taken to Kolar, Chikkaballapur, and Devanahalli where it is used to replenish both groundwater and surface water sources. The remaining water flows into lakes and runs off land to join rivers downstream. This means the huge quantum of wastewater generated in the city is an untapped resource. Once treated to the required quality, wastewater can significantly mitigate freshwater consumption and can be crucial in making the city water resilient during low rainfall years.
Rashmi Kulranjan and Shashank Palur are hydrologists at Well Labs
Source: Directorate of Economics and Statistics, Karnataka; India-WRIS; Sentinal; Karnataka State Disaster Management Authority; Bangalore Water Supply and Sewage Board and the Karnataka State Pollution Control Board
Watch our Data video: Watch | Electoral bonds banned: Which party benefitted the most while it existed?
