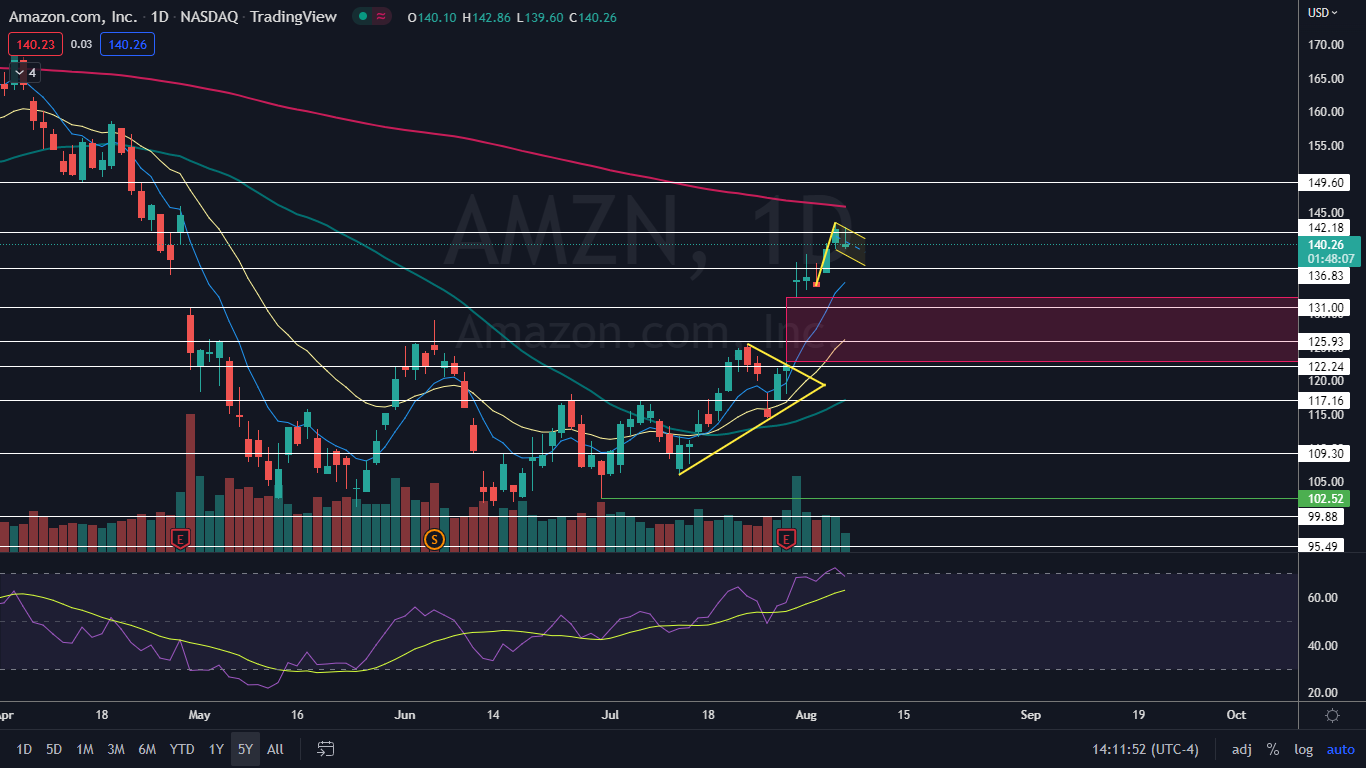
Amazon.com, Inc. (NASDAQ:AMZN) was trading about 1.3% lower on Friday in consolidation after soaring up over 18% between July 28 and Thursday, which was in response to the company printing a second-quarter revenue beat.
Although shares of Amazon have increased significantly as of late, market bear Steve Weiss became a big-tech bull on Thursday, purchasing shares of Amazon, Apple Inc (NASDAQ:AAPL) and Alphabet, Inc (NASDAQ:GOOG) (NASDAQ:GOOGL).
Weiss said on CNBC’s "Fast Money Halftime Report" that he sees “a clear field ahead" for the group of stocks but that he doesn’t plan to hold any of the three companies for a long period of time.
Amazon has a big level of resistance to clear at the 200-day simple moving average, which is trending about 4.5% above the current share price. If the stock can regain the level over the coming days, a bull cycle may occur to lift the stock even higher.
Want direct analysis? Find me in the BZ Pro lounge! Click here for a free trial.
The Amazon Chart: Amazon has been trading in a consistent uptrend since June 30, with the most recent higher high formed on Thursday at $143.46 and the most recent higher low printed at the $134.09 mark on Tuesday. On Friday, Amazon as forming an inside bar pattern on the daily chart, with all the price action taking place within Thursday’s mother bar.
- The inside bar pattern is a form of consolidation, which Amazon is in need of because the stock’s relative strength index has been hovering above the 70% level since July 29. When a stock’s RSI reaches or rises above that level, it becomes overbought, which can be a sell signal for technical traders.
- Amazon’s inside bar leans bullish because the stock was trading higher before forming the pattern. Trades can watch for a break up or down from Thursday’s mother bar on Monday to gauge the future direction.
- If the inside bar breaks bearishly but on low volume, Amazon may form a bull flag pattern on the daily chart. Both the inside bar or a bull flag pattern may eventually give Amazon the strength to break up above the 200-day SMA, which would give bullish traders more confidence going forward.
- Amazon has resistance above at $142.18 and $149.60 and support below at $136.83 and $131.


