XRP (CRYPTO: XRP) and Cardano (CRYPTO: ADA) are down over 5% over the past 24 hours as sellers dragged the two large-cap altcoins back toward the critical support zones that have held the market together since early fall.
XRP Weakens As Sellers Push Price Toward Trendline Support
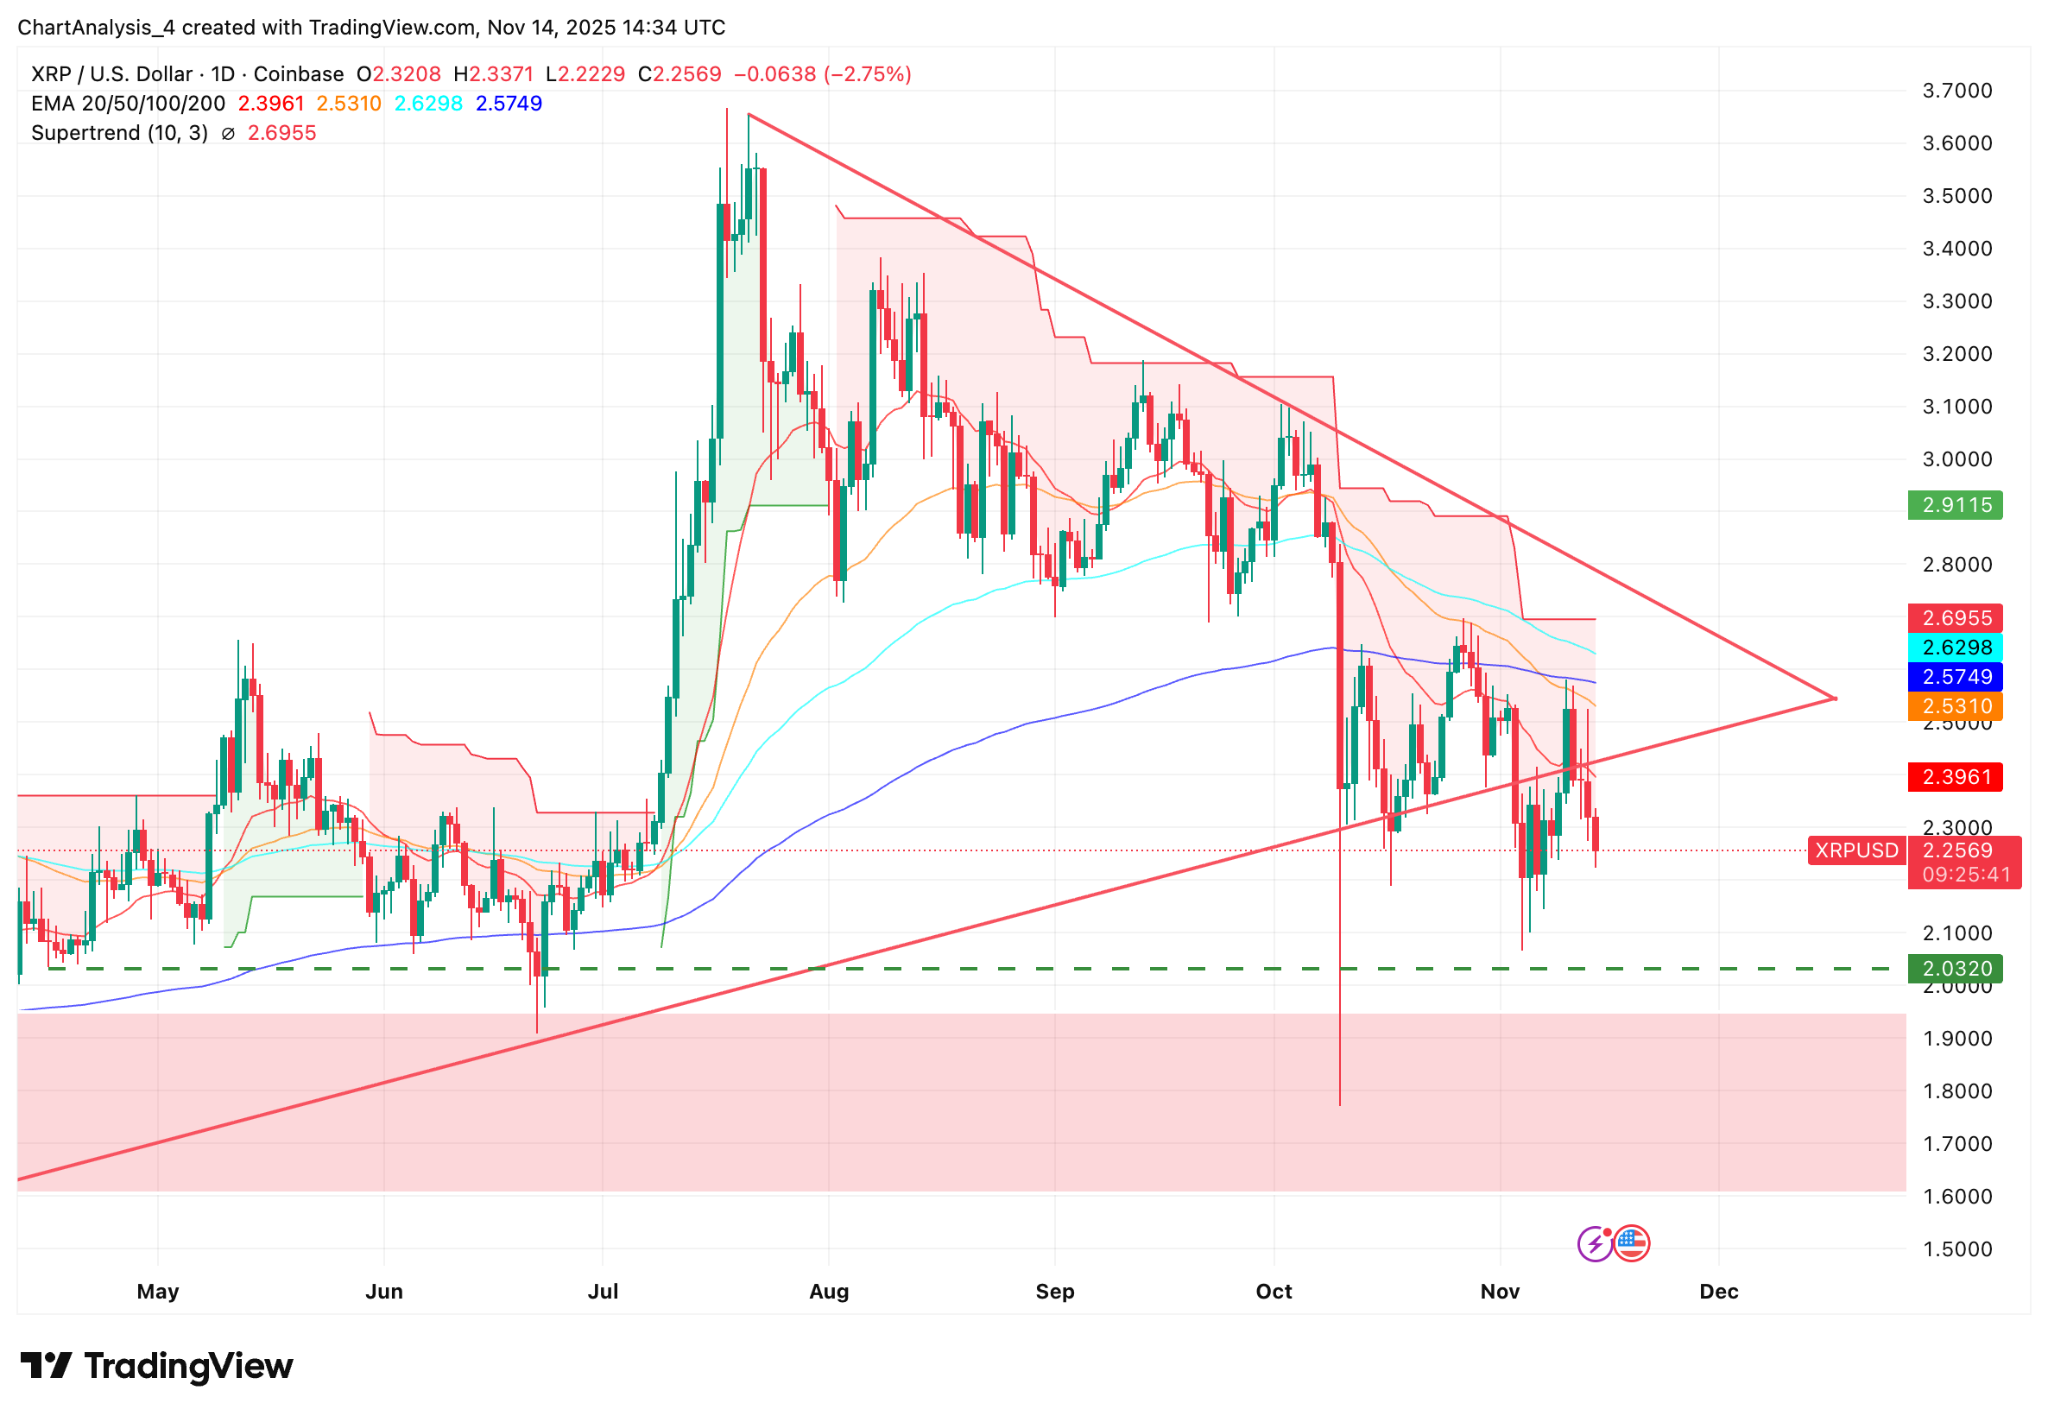
XRP Price Action (Source: TradingView)
XRP trades near $2.25 after persistent selling pressure weighed on the month-long triangle structure.
The token remains below the 20-day EMA at $2.39 and cannot reclaim the 50-day EMA at $2.53.
Each rebound fades quickly, and repeated failures at the descending trendline confirm that momentum stays controlled by sellers.
The market is now pressing one of the most important long-term support levels in the pattern, formed by a rising trendline from the March base.
Outflows Deepen As XRP Loses Grip On Key EMA Cluster
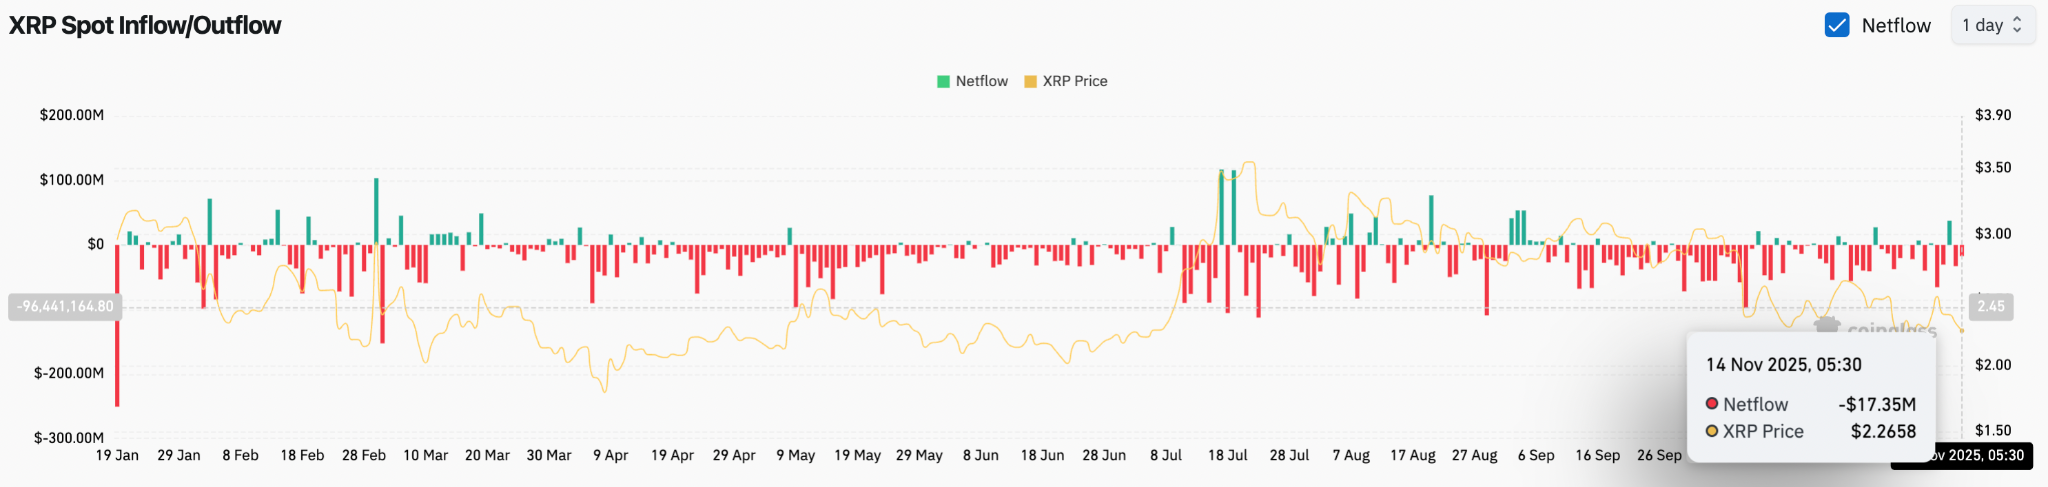
XRP Netflows (Source: Coinglass)
Spot netflows registered a $17.35 million outflow on Nov. 14, marking another session dominated by selling.
Red prints have been consistent for months, showing limited accumulation and minimal whale interest.
The supertrend stays red, and XRP trades under every major EMA between $2.53 and $2.69.
This cluster has become a ceiling, and the path lower remains open until price reclaims it.
A break below the rising trendline could expose $2.03 as the next target.
A deeper slide toward the $1.75–$1.60 region may follow if sellers accelerate pressure.
ADA Extends Weekly Decline As Breakdown Gains Momentum
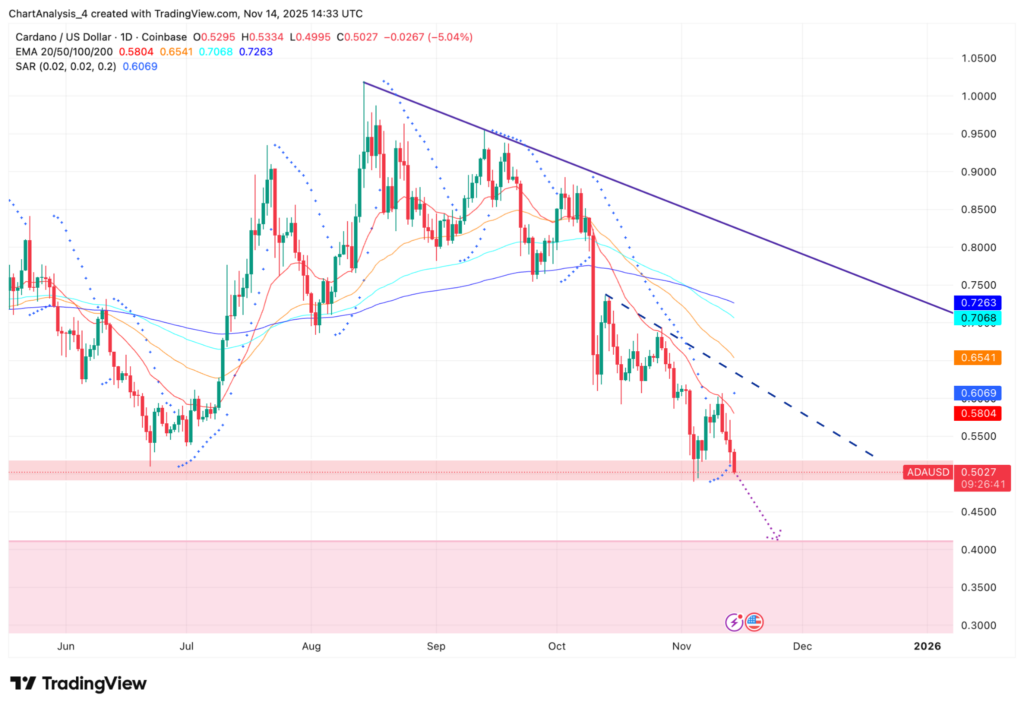
Cardano Price Dynamics (Source: TradingView)
ADA trades near $0.50 after losing the $0.53–$0.55 support shelf earlier this week.
The token is down about 15% over the past seven days, reflecting one of the steepest weekly drops among large-cap assets.
The market has respected a dominant descending trendline since late summer, and each rally into the EMA cluster has been rejected.
The breakdown through support pushed ADA directly into a lower liquidity region, leaving it just above a broad demand zone between $0.42 and $0.36.
ADA price trades well below the 20-day EMA at $0.58 and the 50-day EMA at $0.65.
The parabolic SAR also continues printing above price, indicating persistent downside pressure.
A clean break could send price into the $0.44–$0.41 pocket quickly.
A deeper test near $0.38–$0.36 becomes likely if sell volume expands.
Read Next:
Image: Shutterstock