/Alphabet%20Inc_%20and%20Google%20logos%20by%20IgorGolovinov%20via%20Shutterstock.jpg)
I normally wouldn't want to bet against a powerhouse like Google (GOOG) (GOOGL), given its almost monopolistic characteristics and what seemed, until recently, an unending positive cash flow and bankroll.
But the cost of staying on top keeps rising. Just this week, Google and other artificial intelligence (AI) hyperscalers pledged to join the White House’s “ratepayer protection pledge” – which Politico dubbed the “build your own power plant pledge” – to provide power for the AI buildout.
Adding onto this, Google joined the likes of corporate giants such as Amazon (AMZN) and JPMorgan Chase (JPM) to sign a $100 million effort to fund projects that cut climate superpollutants such as methane, black carbon, and refrigerant gases. The campaign, called the Superpollutant Action Initiative, is set to supply financing through 2030.
For a taste of what it might mean, Axios reports, “Randy Spock, Google's carbon credits and removals lead, cited potential project areas like cutting landfill methane and stemming the release of refrigerant gases when HVAC systems are replaced.”
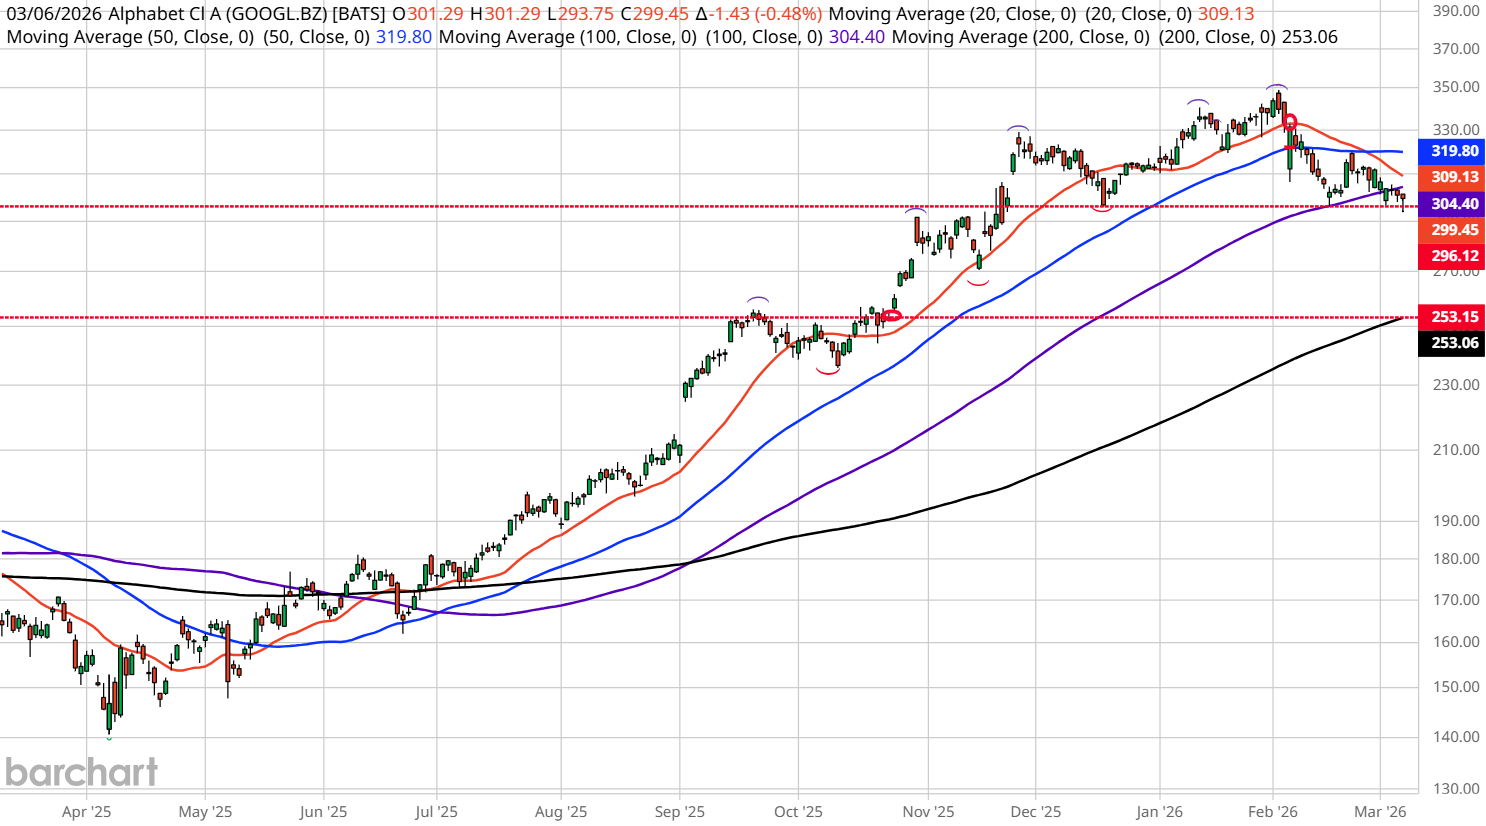
And it seems the market is starting to take notice of all this extraneous spending. Google has spent the longest stretch beneath its 50-day moving average since early 2025, and is now knocking on the critical December 2025 low around $296 for the third time.
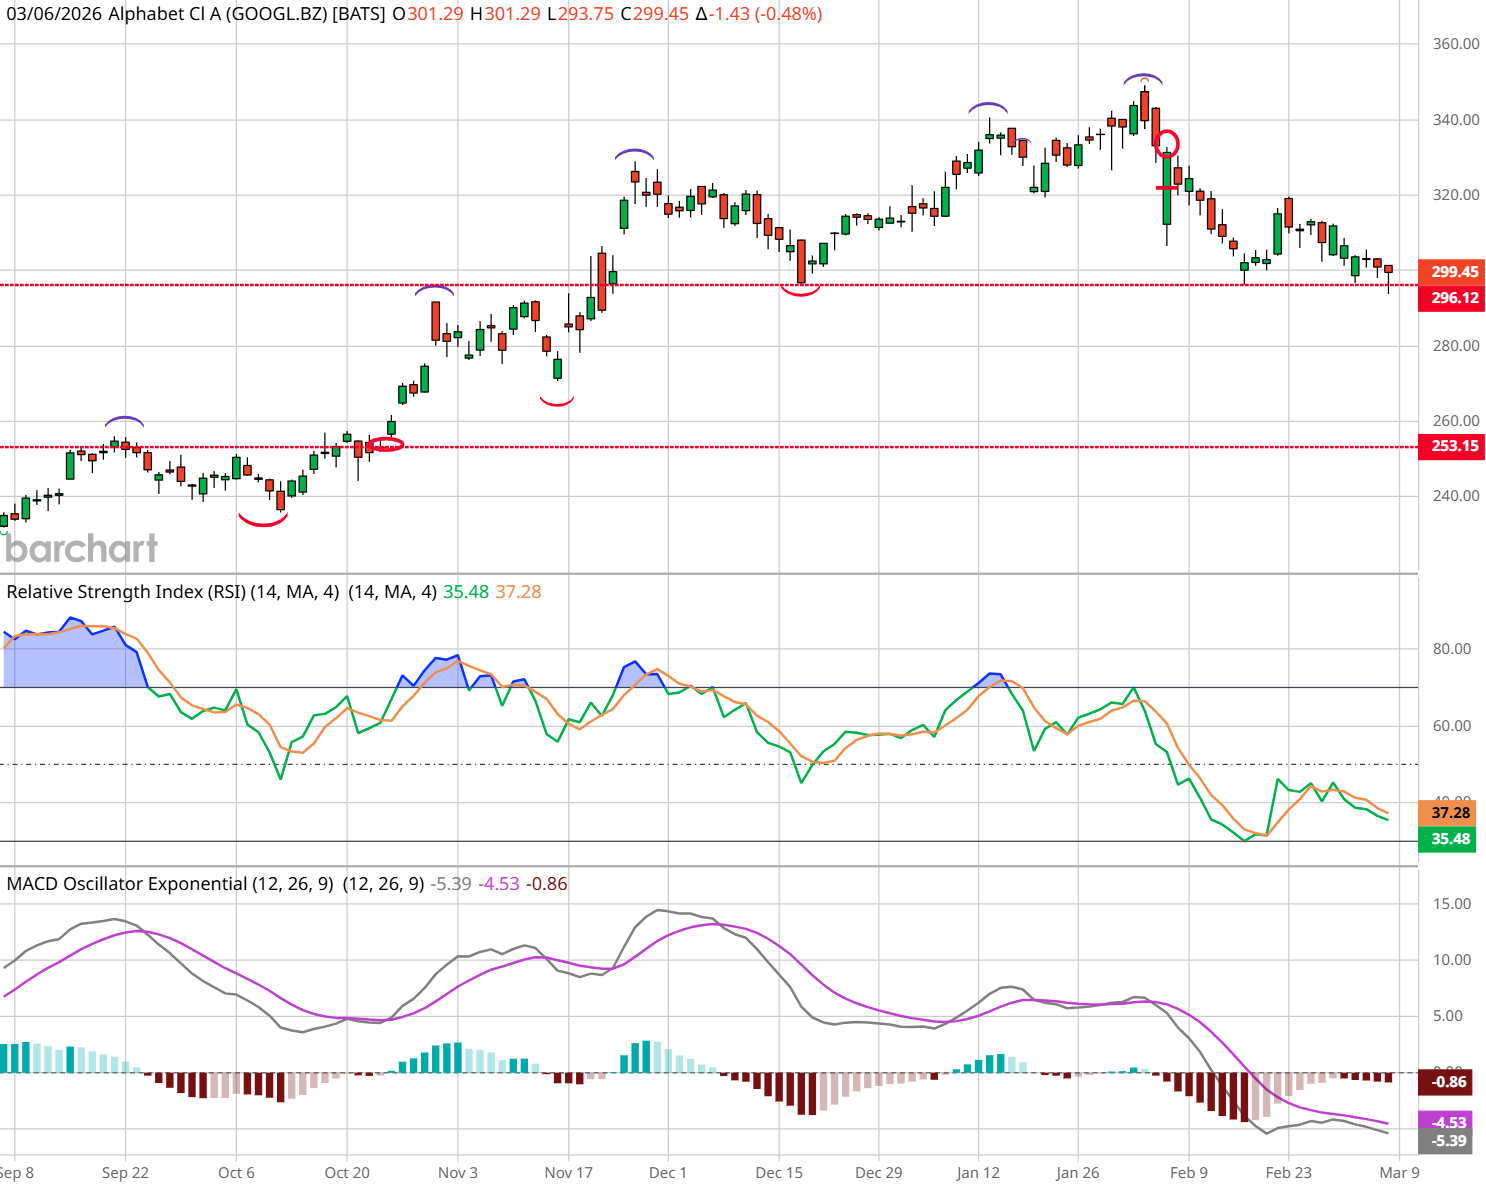
As I said before, it's difficult to bet against a stock that’s not only a Magnificent 7 leader, but is so deeply ingrained in the "Buy the Dip" investor mentality. But on the other hand, key technical indicators like the RSI and MACD are showing negative momentum for GOOGL, and have fallen below levels that would be considered supportive of an uptrend.
And with GOOGL clearly below the weekly Bollinger Band mean ($308), and the benchmark 200-day moving average at $253, this seems like a low-risk, higher-reward, high-probability trade to me.
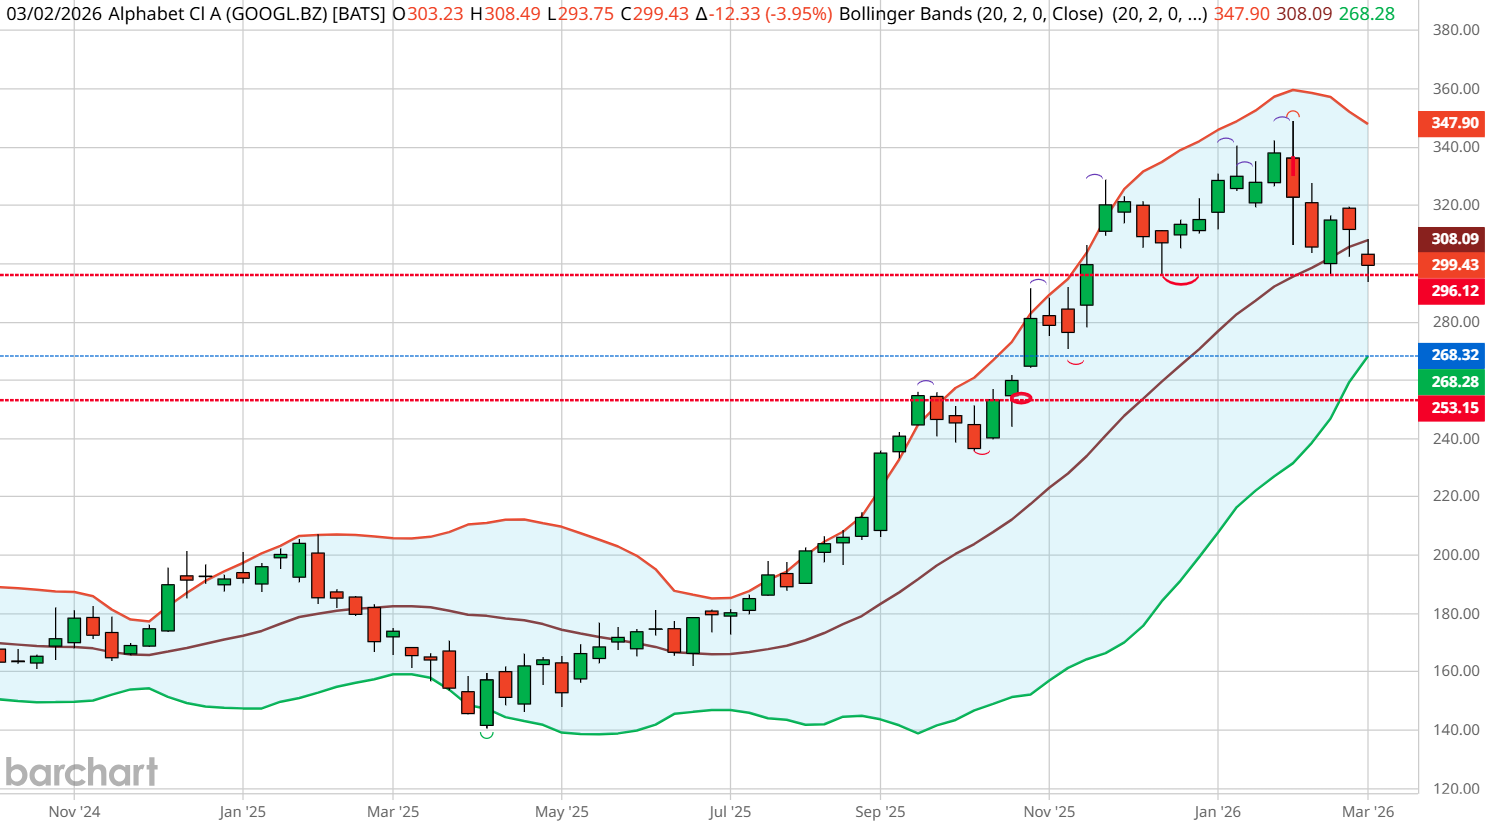
Looking at the April monthly options expected move, it's clearly inside that lower-range target.
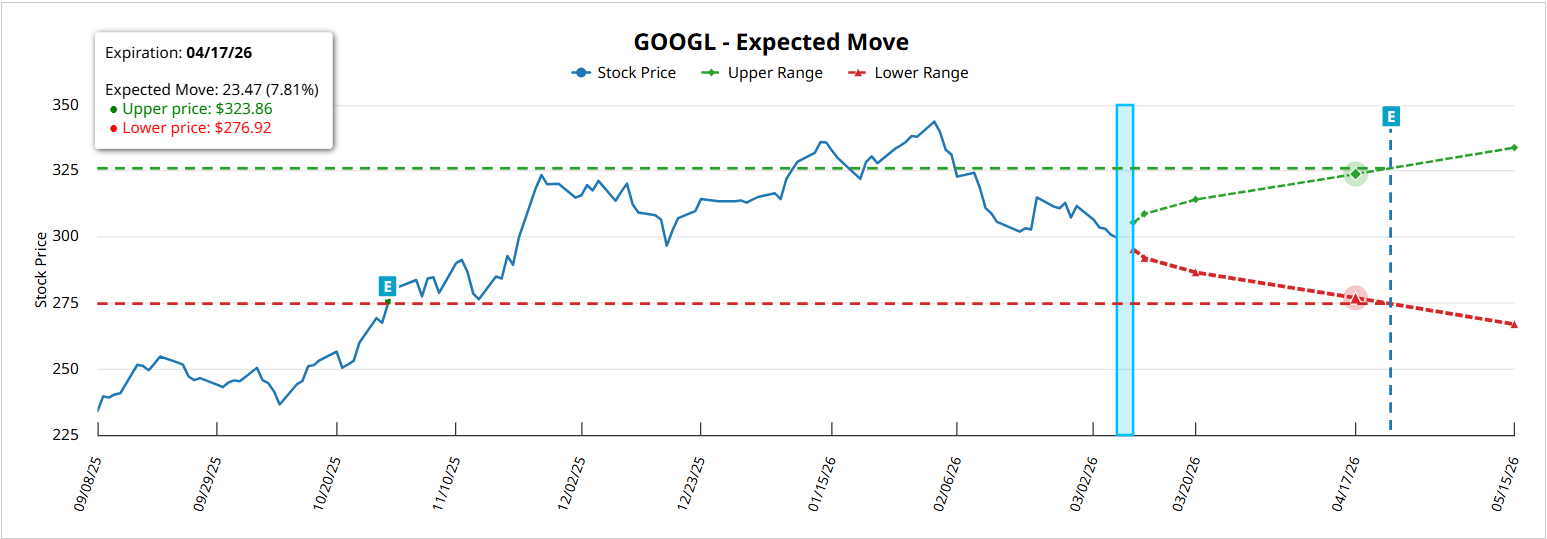
To capitalize on these bearish technical signals, I bought an in-the-money April 320 put where my extrinsic cost (time premium) is less than 2% of the current price. This allows me to fully enjoy any favorable price depreciation without incurring excessive theta decay costs.
I'll be using a weekly close above the Bollinger Band mean to tell me I'm wrong, and $271-268 will serve as my profit-taking target.
– John Rowland is Barchart’s Senior Market Strategist and the host of Market on Close.