
Nike Inc (NYSE:NKE) was rallying almost 5% on Thursday with continued momentum from Wednesday’s price action, when the stock began to react to a bullish double bottom pattern.
A double bottom pattern is a reversal indicator that shows a stock has dropped to a key support level, rebounded, back tested the level as support and is likely to rebound again. It's possible the stock may retest the level as support again creating a triple bottom or even quadruple bottom pattern.
The formation is always identified after a security has dropped in price and is at the bottom of a downtrend whereas a bearish double top pattern is always found in an uptrend. A spike in volume confirms the double bottom pattern was recognized and subsequent increasing volume may indicate the stock will reverse into an uptrend.
- Aggressive bullish traders may choose to take a position when the stock’s volume spikes after the second retest of the support level. Conservative bullish traders may wait to take a position when the stock’s share price has surpassed the level of the initial rebound (the high before the second bounce from the support level).
- Bearish traders may choose to open a short position if the stock rejects at the level of the first rebound or if the stock falls beneath the key support level it created the double bottom pattern at.
Want direct analysis? Find me in the BZ Pro lounge! Click here for a free trial.
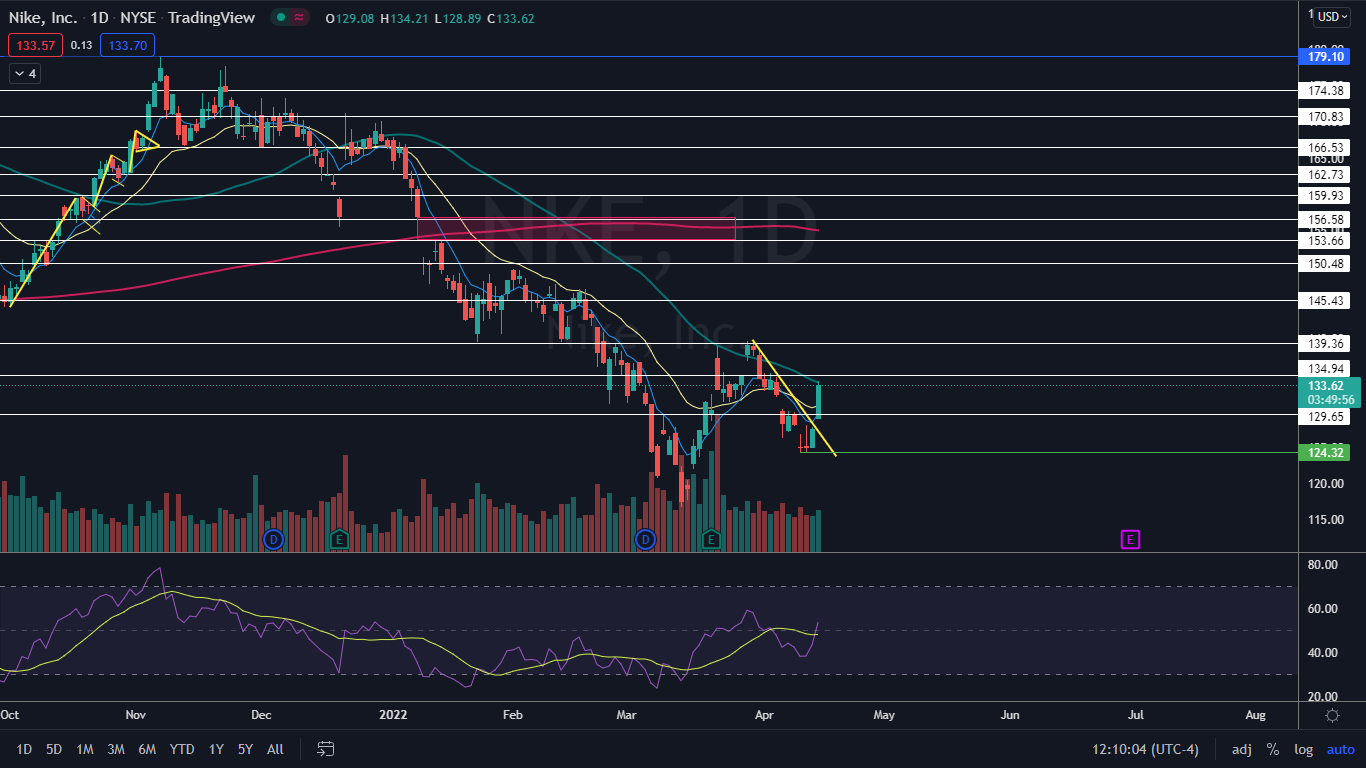
The Nike Chart: Nike formed a bullish double bottom pattern near the 124.32 level on Monday and Tuesday and reversed course out of the downtrend the stock had been trading in since March 30. Although the stock hasn’t confirmed its trading in an uptrend, because it has yet to print a higher low on the daily chart, the downtrend was negated on Thursday when Nike printed a high above the April 12 lower high of $128.10.
- Thursday’s rise came on higher-than-average volume, which indicates a high level of trader and investor interest has returned to the stock. At press time, over 5 million shares of Nike had exchanged hands compared to the 10-day average of 5.78 million.
- If Nike closes the trading session near its high-of-day price, it will print a bullish kicker candlestick, which may indicate higher prices will come on Monday. If higher prices don’t come, Nike may form an inside bar pattern to consolidate the move higher, which would cause the stock to print a higher low and confirm an uptrend.
- The rally has caused Nike to regain support at the eight-day and 21-day exponential moving averages (EMAs) and if the stock is able to continue trading above the levels, the eight-day EMA will cross above the 21-day, which would be bullish. On Thursday, Nike was rejecting the 50-day simple moving average, and bullish traders will want to see the stock regain the level as support over the coming days.
- Nike has a gap above on the chart between $153.60 and $156.86. Gaps on charts fill about 90% of the time, which makes it likely the stock will trade up into the range in the future. If the stock is able to fill the upper gap, it represents a further 17% rise from the current share price.
- Nike has resistance above at $134.94 and $139.36 and support below at $129.65 and the $124 level.
See Also: Balancing 4/20's Activism History With A Modern Sales Holiday