Microsoft Corporation (NASDAQ:MSFT) is trading higher in a strong uptrend that was confirmed on Wednesday. An uptrend occurs when a stock consistently makes a series of higher highs and higher lows on the chart.
The higher highs indicate the bulls are in control, while the intermittent higher lows indicate consolidation periods. Traders can use moving averages to help identify an uptrend, with rising lower timeframe moving averages (such as the eight-day or 21-day exponential moving averages) indicating the stock is in a steep shorter-term uptrend and rising longer-term moving averages (such as the 200-day simple moving average) indicating a long-term uptrend.
A stock often signals when the higher high is in by printing a reversal candlestick such as a doji, bearish engulfing or hanging man candlestick. Likewise, the higher low could be signaled when a doji, morning star or hammer candlestick is printed. Moreover, the higher highs and higher lows often take place at resistance and support levels.
In an uptrend the "trend is your friend" until it’s not, and in an uptrend there are ways for both bullish and bearish traders to participate in the stock:
- Bullish traders who are already holding a position in a stock can feel confident the uptrend will continue unless the stock makes a lower low. Traders looking to take a position in a stock trading in an uptrend can usually find the safest entry on the higher low.
- Bearish traders can enter the trade on the higher high and exit on the pullback. These traders can also enter when the uptrend breaks and the stock makes a lower low, indicating a reversal into a downtrend may be in the cards.
See Also: 5 Things You Might Not About Melinda Gates
The Microsoft Chart: When Microsoft fell to its low-of-day at the $297.72 level on Wednesday, it printed another higher low above the previous higher low that was printed on March 14 at the $275.82 mark. If the stock closes the trading session near its opening price or near its high-of-day, it will print a doji or a hammer candlestick, respectively, which could indicate higher prices will come on Thursday.
- If higher prices come, it will cause Microsoft to regain the 200-day simple moving average (SMA) as support and if the stock can trade above the level for a period of time the 50-day SMA will cross above the 200-day, which will form a golden cross on the chart.
- If Microsoft trades slightly lower again on Thursday, the stock will form a bull flag pattern and traders and investors can watch for a break of the pattern on Friday or Monday on higher-than-average volume to gauge whether the pattern was recognized.
- If Microsoft forms into a bull flag pattern on the daily chart, the measured move is a whopping 10%, which indicates the stock could soar up to the $330 level in the future.
- Microsoft has resistance above at $302.14 and $309.70 and support below at $294.23 and $289.69.
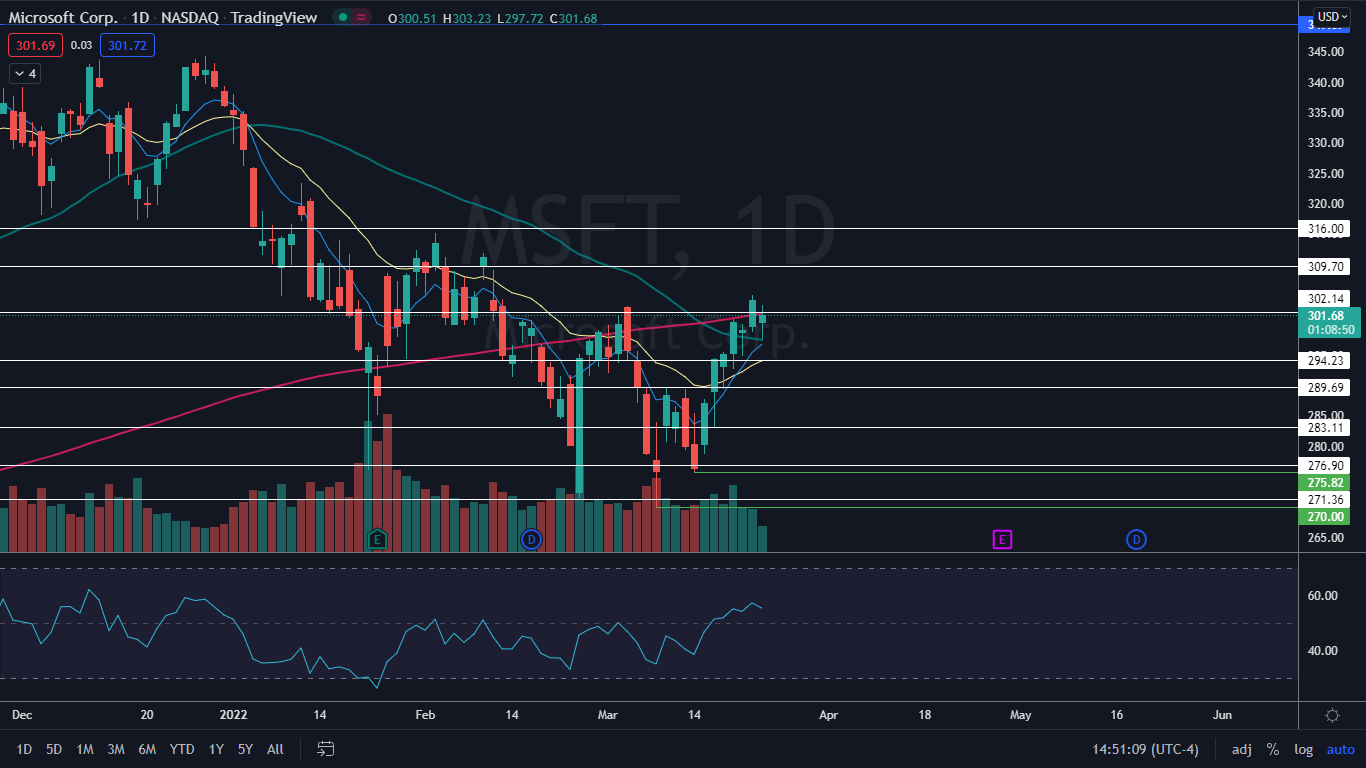
Photo: Courtesy of Mike Mozart on Flickr