Costco Wholesale Corporation (NASDAQ:COST) shares are trading lower Friday, continuing to fall after reporting second-quarter earnings results on Thursday. EPS was reported at $2.92, beating the $2.73 estimate. Sales came in at $51.9 billion, beating the estimate of $51.37 billion. The stock has been trending throughout the past few days on social media sites such as Stocktwits.
Costco was down 1.34% at $525.93 Friday at publication.
Costco Daily Chart Analysis
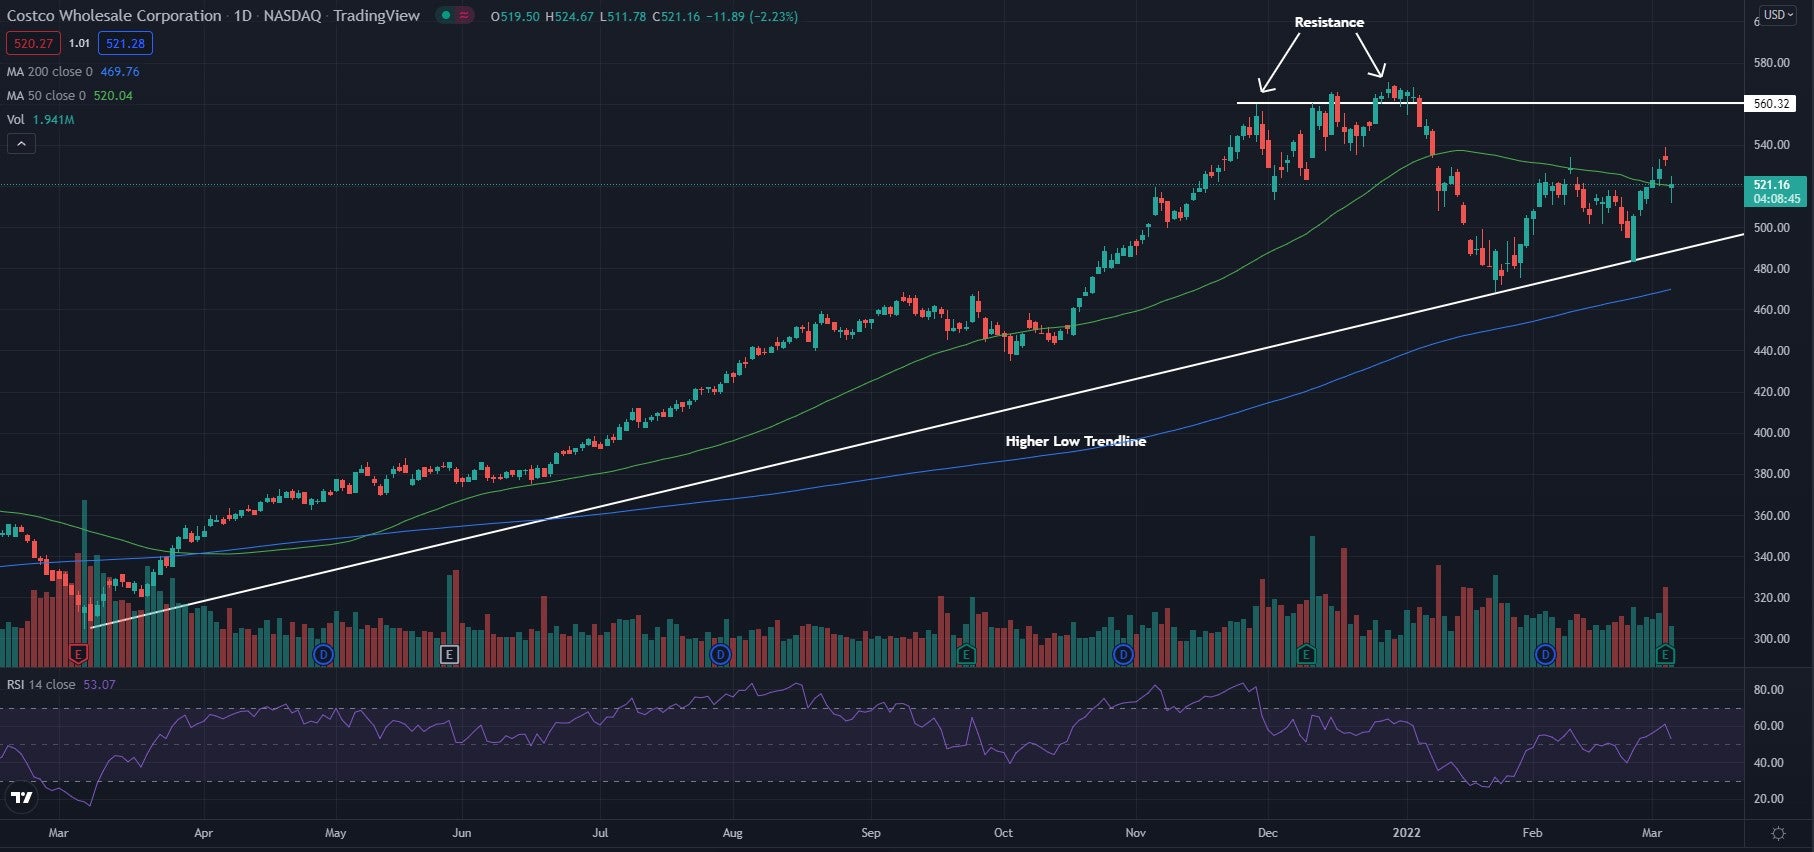
- The stock is trading in an ascending triangle pattern and sits right in the middle of support and resistance. If the stock can hold inside of the pattern for a few more weeks it could see a breakout over the resistance level and possibly a strong bullish move. Resistance in the past has been found near the $560 level.
- The stock trades above both the 50-day moving average (green) and the 200-day moving average (blue). This indicates bullish sentiment and each of these moving averages may hold as an area of support in the future.
- The Relative Strength Index (RSI) has been climbing again for the past couple of weeks and sits at 53. This shows the stock has more buying pressure than selling pressure. If the RSI continues to hold above the middle line, it is a good sign for bulls looking for the breakout.

What’s Next For Costco?
Costco is sitting in the bullish continuation pattern and looks good as it is situated between support and resistance. The stock could see a breakout in the coming weeks if it can hold above the higher low trendline. Bullish traders are in control of the stock as it sits and want higher lows to continue to form and the price to cross above the $560 resistance level. Bearish traders want the stock to fall below the moving averages, as well as the higher low trendline, for a possible strong bearish move to happen.


