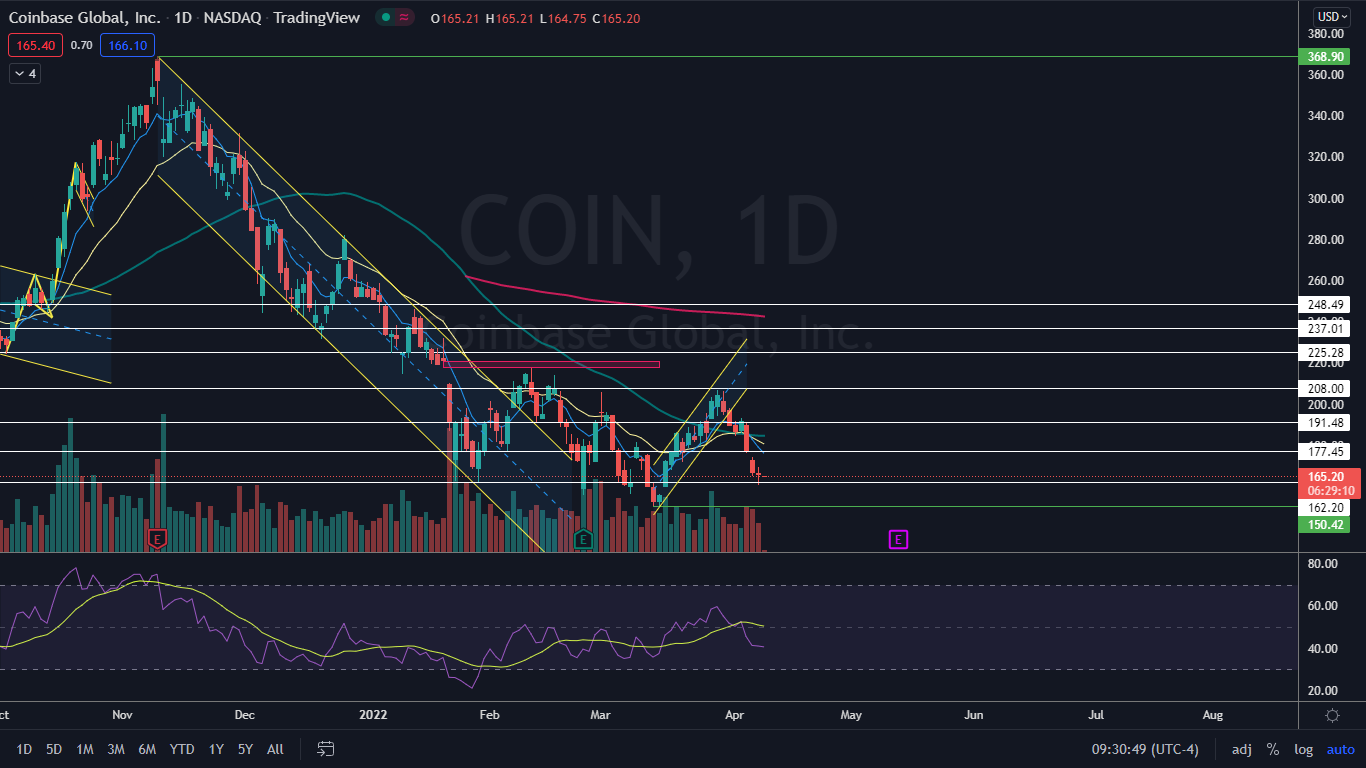
Coinbase Global, Inc (NASDAQ:COIN) was trading flat in the premarket after closing Thursday flat, which caused the stock to print a doji reversal candlestick on the daily chart.
A number of analysts have recently weighed in on Coinbase and lowered their price targets, after poor yearly performance has seen the stock lose about 60% of its value since going public on April 14, 2021.
On Friday morning, Goldman Sachs maintained a Buy rating on Coinbase but lowered its price target to $240. JMP Securities maintains a Market Outperform on the stock on Thursday and lowers the price target to $394. The day prior, Mizuho maintained its Neutral rating and lowered the price target to $190.
If the beaten-down stock could rise up to even the lowest new price target, it would represent about a 15% increase on Coinbase.
On Thursday, Coinbase went live in India, providing the ability for users in the Asian country to trade cryptocurrencies such as Bitcoin (CRYPTO: BTC) and Ethereum (CRYPTO: ETH). The U.S.-based crypto trading platform also launched its "Join UPI waitlist,” to eventually allow its users add money to and complete withdrawals from their wallets using the UPI network.
A subdivision of India’s central bank, the National Payments Corporation of India, said it wasn’t aware of any cryptocurrency platforms using UPI, however.
Although Coinbase continues to grow internationally, the stock price has suffered greatly, falling from the all-time high of $429.54, which was reached on the day of its market debut to a March 14 and March 15 all-time low of $150.42.
A reversal may be in the cards because Coinbase has begun to flash signals the downtrend, at least temporarily, is over.
Want direct analysis? Find me in the BZ Pro lounge! Click here for a free trial.
The Coinbase Chart: On Wednesday, Coinbase printed a bearish kicker candlestick, which indicated lower prices would come again on Thursday. Lower price did come but when the stock closed the trading day flat, it resulted in Coinbase printing a doji candlestick, which is often found at the end of a trend and can indicate a reversal is on the horizon.
Coinbase is trading in a confirmed downtrend, with the most recent lower high created at the $193.07 level on April 4 and the most recent lower low formed the day prior at $184.93. If Thursday’s doji marks the next lower low in the pattern, at least a bounce up to form another lower high will come.
The stock has a gap above on the chart between $217.49 and $220.84. Gaps on charts fill about 90% of the time, which makes it very likely the stock will rise up to fill the empty trading range in the future.
Coinbase is trading below the eight-day and 21-day exponential moving averages (EMAs), with the eight-day EMA trending below the 21-day, both of which are bearish indicators. The stock is also trading below both the 50-day and 200-day simple moving averages, which indicates long-term sentiment is bearish.
- Bulls want to see big bullish volume come in and drive Coinbase up to print a higher high, which would negate the downtrend. Coinbase has resistance above at $177.45 and $191.48.
- Bears can watch for Coinbase to confirm another lower high and print a reversal candlestick below the April 4 high-of-day, which would provide a solid entry point for a short position. Coinbase has support below at $162.20 and at the all-time low.


