Ford Motor Company (NYSE:F) stock spiked 5% when the markets opened on Friday, following a report the legacy-turning-electric vehicle manufacturer had filed a patent for a feature called Pet Mode that keeps the air-conditioning on, plays music and can open and close the sunroof for animals inside the vehicle when the owners are away.
The feature, which will likely be available in Ford’s upcoming EV line up, will launch the company further into direct-competitor status with Tesla, which has a similar feature called Dog Mode.
At 10:30 a.m. EST, a report stated Ford CEO Jim Farley is mulling ways to operate the company's electric vehicle business separately, causing a bearish reaction on the stock and Ford fell almost 3% lower over the 1 1/2 hours that followed before recovering slightly.
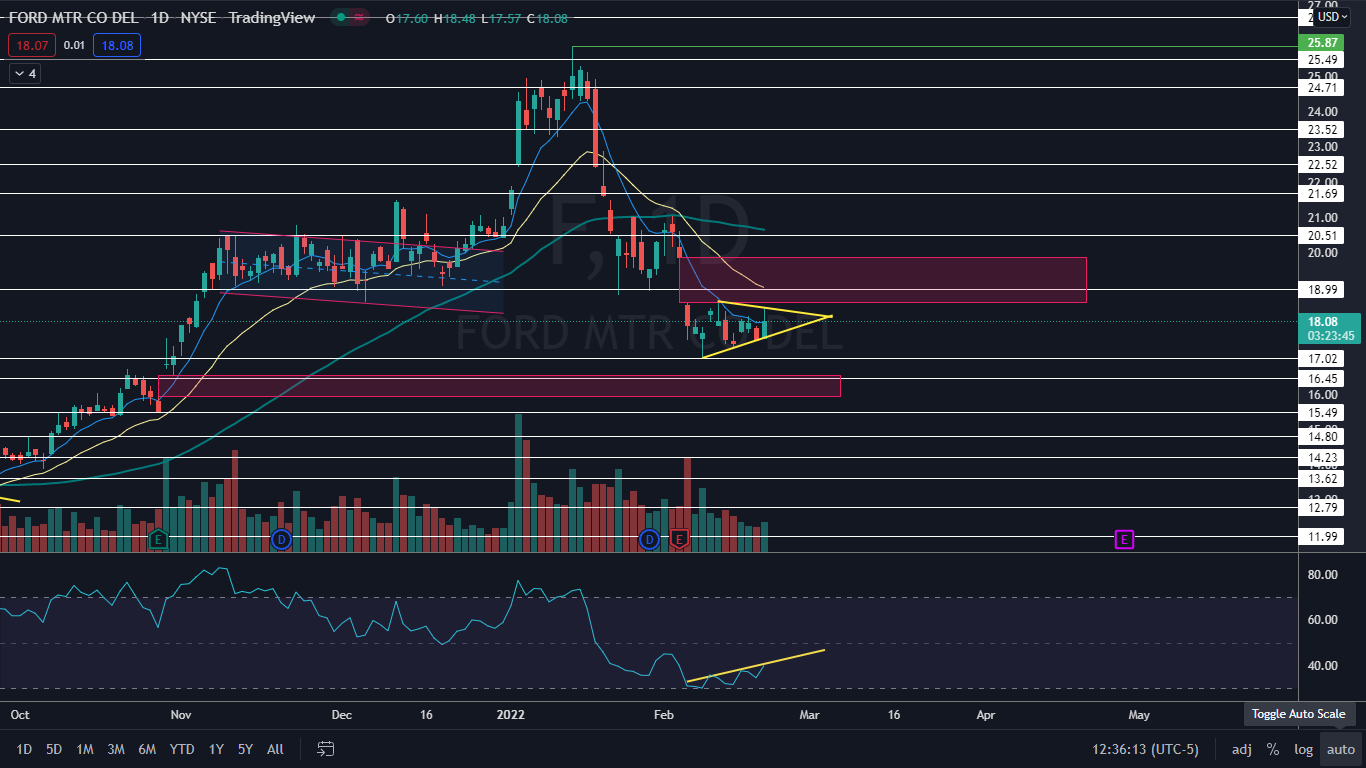
Although Ford plummeted 34% between its Jan. 13 high of $25.87 and the low of $17.02 it printed on Feb. 8, the stock has shown relative strength over the past 10 days compared to the SPDR S&P 500 ETF Trust (NYSE:SPY), which has been in a downtrend since Feb. 2.
As the saying goes, “There’s always a bull market somewhere,” and perhaps as the world continues to switch over to EVs, the sector will offer some relief from the overall market turmoil experienced so far in 2022, although there are some bearish signs on Ford’s chart traders should be aware of.
See Also: Ford Partners With Tesla Co-founder's EV Battery Recycling Venture Program In California
The Ford Chart: On Feb. 8, Ford reversed course into an uptrend and has since made a consistent series of higher highs and higher lows, with the most recent higher high printed on Feb. 10 at the $18.59 level and the most recent higher low created on Thursday at $17.54. When Ford spiked up higher Friday morning it was unable to print another higher high, which may give bulls concern if the stock isn’t able to make the move in short order.
When Ford was unable to print a higher high on Friday it developed hidden bearish divergence on the chart, where the relative strength index made a higher high, but the stock did not. Bullish traders may want to watch for the divergence to correct before taking a position.
If Ford is unable to make a higher high, the stock may tighten into a triangle, with an apex of March 3. If the pattern is recognized, traders can watch for a break of the pattern on higher-than-average volume to gauge direction and possibly take a position.
Ford is trading slightly above the eight-day exponential moving average (EMA) but below the 21-day EMA, with the eight-day EMA trending below the 21-day, which leans bearish. The stock is also trading below the 50-day simple moving average, which indicates longer-term sentiment is bearish.
Want direct analysis? Find me in the BZ Pro lounge! Click here for a free trial.
- Bulls want to see big bullish volume break Ford up from the triangle to make a higher high and confirm the uptrend is still intact. The stock has resistance above at $18.99 and $20.51.
- Bears want to see big bearish volume come in and drop Ford down through the bottom ascending trendline of the triangle, which could cause Ford to close a lower gap between $15.92 and $16.55. There is support below the current share price at $17.02 and $16.45.

Photo by Andrew Pons on Unsplash


