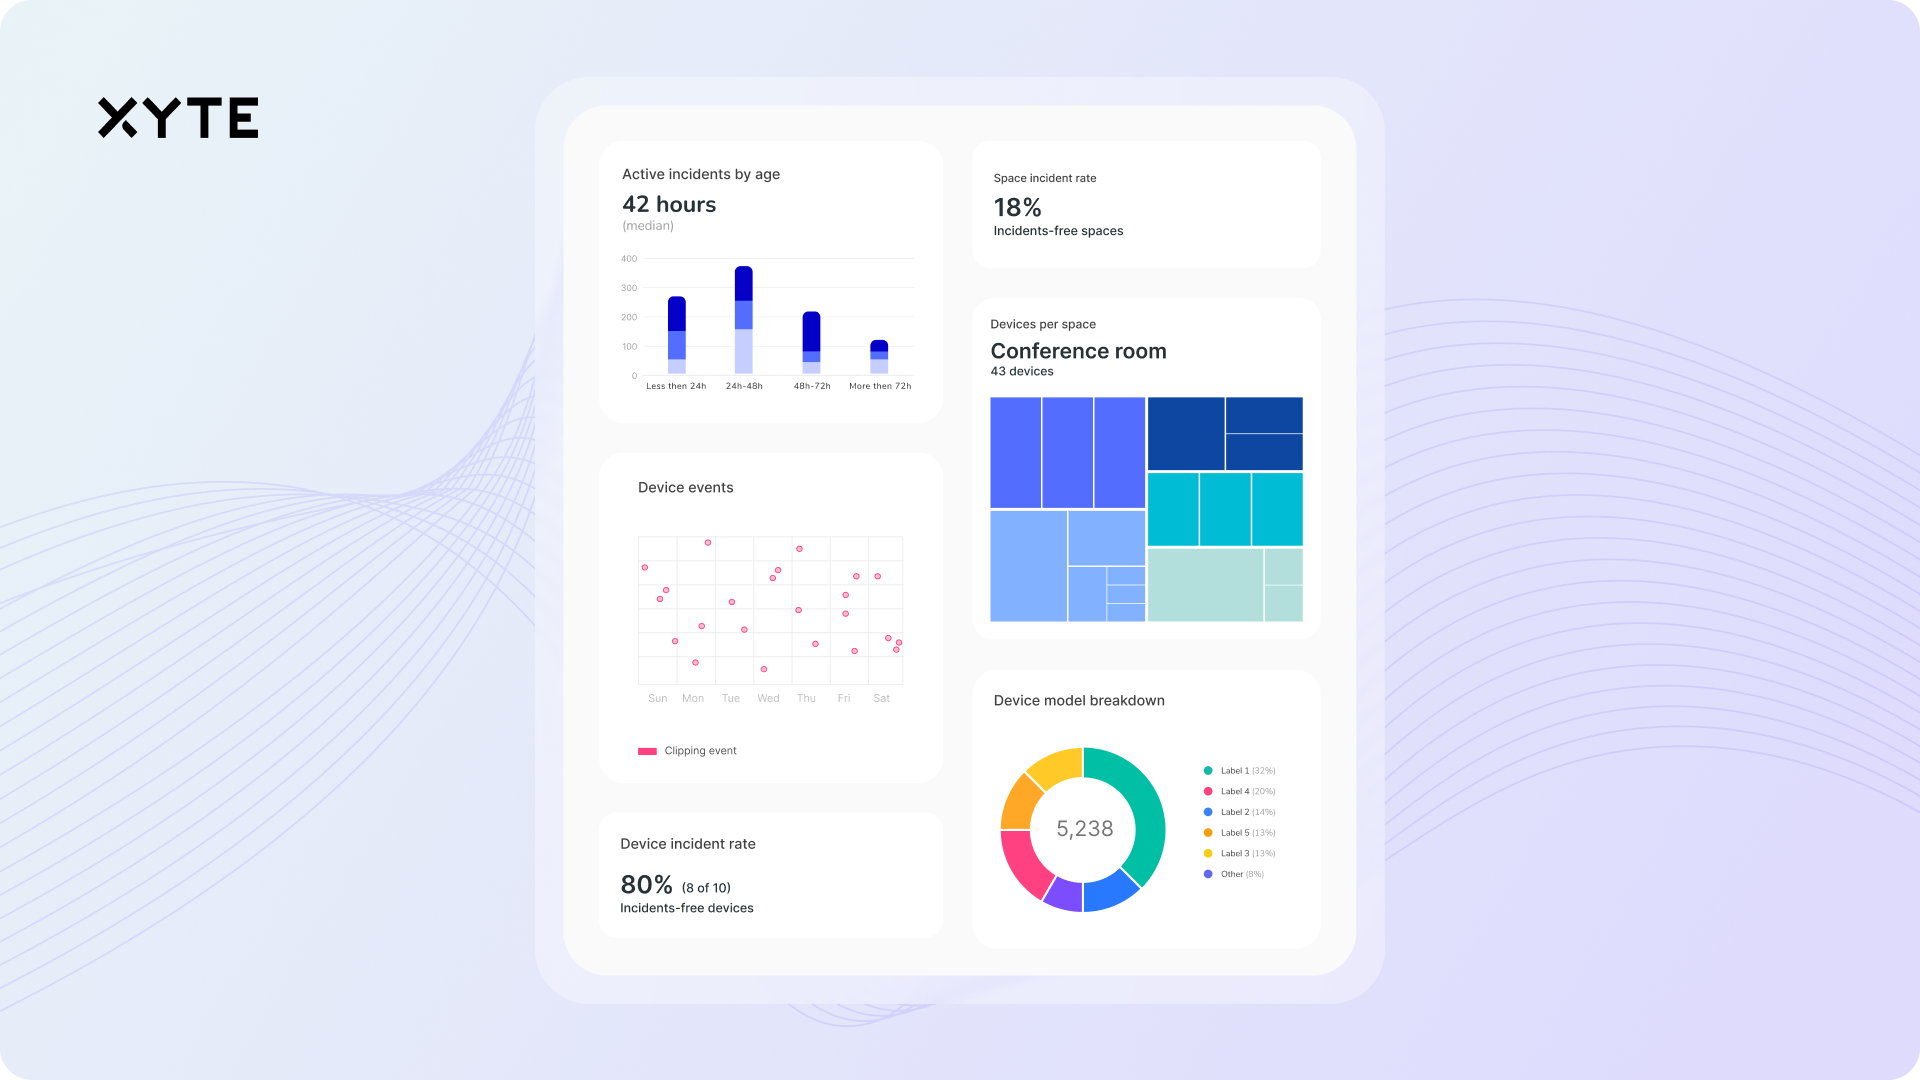
Xyte released six new widgets designed to help monitor and deliver insights on connected devices’ behavior, performance, and condition. The visual element of Xyte's widgets enhances user experience by making it easier to glean insights at a glance and achieve faster and more efficient issue resolution.
One of Xyte’s new widgets, Customizable Device Events, allows users to monitor device events regardless of telemetry. It includes an event log and the ability to visualize events through scatter charts on the device's dashboard. Users can plot up to eight events over time, using various colors for easy distinction, all within a single graph.
[Tech Perspectives: The Emperor Has No Clothes]
“Listening to our users is at the core of our development process. Following requests for ways to simplify how users interact with their devices, I look forward to seeing these new widgets help them manage complex systems and increase their efficiency,” said Omer Brookstein, CEO and co-founder of Xyte. “We are on a mission to provide powerful tools that make a real difference in users’ daily operations. These half dozen widgets are just the beginning; we will continue to develop and introduce additional widgets in the future.”
In contrast to Customizable Device Events, which relates to a single device, the other new widgets show aggregate data for multiple devices. They also adjust the visualization of data according to the devices’ locations. They include:
- Device Incident Rate: Users can visualize the percentage of devices experiencing incidents versus those operating incident-free. They can configure this widget to include specific incident severities tailored to the information they deem most important.
- Space Incident Rate: Similar to Device Incident Rate, this new widget allows customers to see incident rates for entire spaces, such as conference rooms, huddle spaces, and other locations with audiovisual systems. This helps customers determine whether a space is operational or unavailable due to technical issues.
- Model Breakdown: Users can view a high-level picture of the distribution of device models. They can view all devices or filter to see only online devices, offering valuable insights into their device landscape.
- Average Age of Incidents: Users can visualize the age of open incidents, helping them prioritize which incidents require the most urgent attention. Users can determine whatever range of dates they deem most helpful for reviewing open incidents.
- Devices Per Space: Typically, users set up their Xyte Device Cloud according to “spaces,” which refer to different office locations or different departments within an organization. With Devices Per Space, users can see an overview of their devices across these various spaces.


