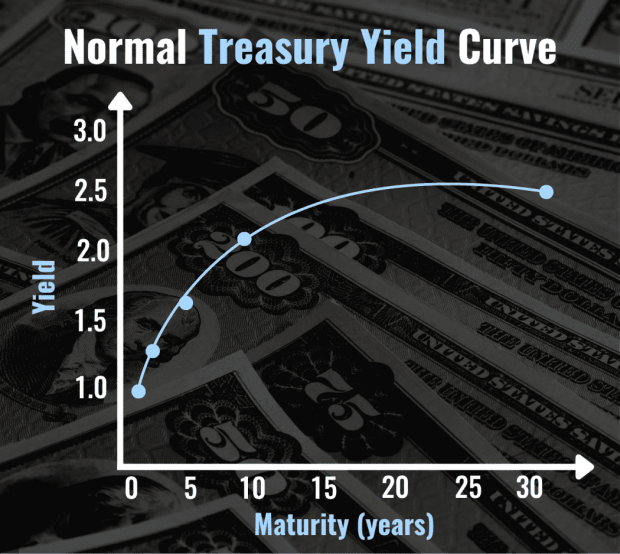
A yield curve is a graph on which bonds are represented by plotted points. A bond’s Y-axis position represents its interest (coupon) rate, and its X-axis position represents its term. Typically, the longer a bond’s term, the higher its interest rate, all other things considered.
What Is an Inverted Yield Curve?
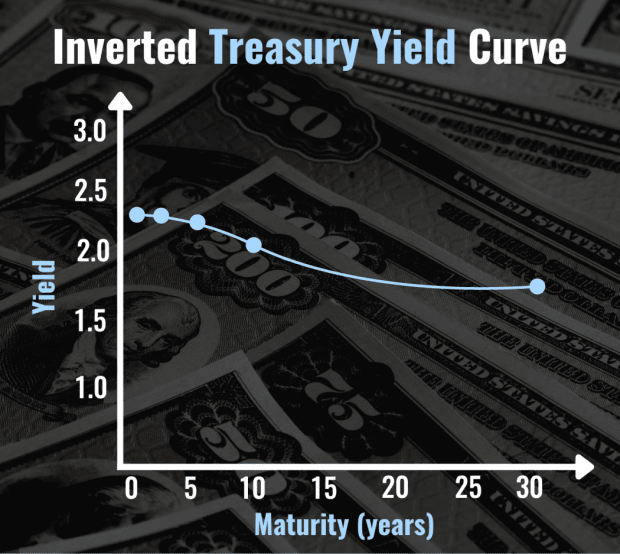
An inverted yield curve occurs when short-term interest rates of a security trend higher than long-term interest rates of a similar security. Long-term rates tend to be higher than short-term rates because both interest rate risk and default risk go up with time. When short-term rates move higher than long-term rates, an inversion occurs.
The yield curve for U.S. Treasury bonds serves as an important leading indicator of the U.S. economy. Typically, treasury bonds with longer terms offer higher yields than those with shorter terms, resulting in a curved line that always has a positive slope.

Occasionally, however, the interest rates of shorter-term treasuries rise above those of longer-term treasuries, resulting in a line with a negative slope. This is known as an inverted yield curve, and for investors and economic analysts, it spells trouble.

When comparing yields between short and long-term government securities, pundits tend to focus specifically on the yields of 2-year and 10-year Treasury bonds.
One of the more widely followed theories about the phenomenon of an inverted yield curve was created by Campbell Harvey, a professor at Duke University. In the 1980s, he pioneered the theory that a sustained inverted yield curve almost always leads to a recession.
He specifically postulated that if the yield on the 3-month Treasury bill —because three months is a short enough span that it is reflective of current economic conditions—is higher than that of the 10-year bond for a long duration, such as three months, then there is a high likelihood of the U.S. economy slipping into recession.
What Causes an Inverted Yield Curve?
Shorter-term yields may become higher than long-term yields because of concern that there are risks to the economy or financial system in the short term, and the immediate outlook is uncertain. At the same time, the Federal Reserve may also be slow to act in tightening monetary policy, while the bond market dictates what the rates should be on Treasuries.
An inverted yield curve can occur due to a confluence of factors, such as accelerating inflation and troubling data on auto sales, retail sales, real wages, the purchasing managers’ index, and other important economic indicators.
An inverted yield curve, though, doesn’t always happen instantaneously. An inversion typically follows what’s known as a flattening of the yield curve, when yields on short-term and long-term securities are about the same.
Does an Inverted Yield Curve Predict Recession?
The yield-curve inversion has been a reliable indicator of the economy sliding into recession, though some investors and analysts point out that the phenomenon can’t predict exactly when a recession will take place or how severe it will be.
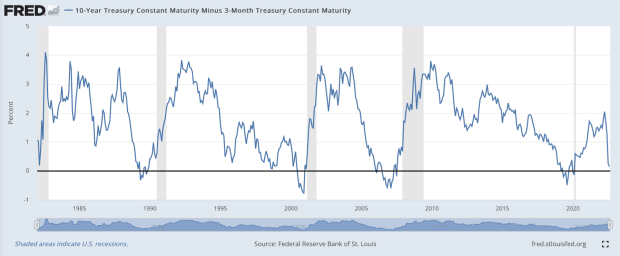
Below is a graph showing the yield spread between 10-year and 3-month Treasuries from January 1982 to August 2022. When the blue line drops below the horizontal black line, the yield curve is inverted. Periods shaded gray represent economic recessions.
The yield offered by 10-year bonds has almost always been higher than that of 3-month bills, but periods when this difference has been negative have always preceded recessions. Still, some critics are quick to question just how much of a predictor the inverted yield curve really is since the economy historically averages a recession once every five years.
One important effect of a sustained or long inverted yield curve is that the unemployment rate is likely to rise.

How Do Financial Markets React to an Inverted Yield Curve?
Stock markets react negatively when signs point to yield-curve inversion, which almost always indicates a recession. When economic growth stalls or recedes, corporate profitability suffers, and as a consequence, a depreciation in share prices often ensues.
Investors are forced to consider the possibility that consumers and businesses will slow their spending during an economic downturn, and corporations might react through cost-cutting measures such as layoffs to curb the loss of money. All of this fear can cause investors to flee equities in favor of “safer” holdings, causing a wave of capitulation that affects the riskiest stocks the most severely.


