Australia is now mid-way into its fourth wave of COVID in the Omicron era, driven by a rich soup of Omicron descendants. Unlike previous waves, where a single new variant of SARS-CoV-2 variant such as BA.2 or BA.5 was responsible, we have had an explosion of new variants such as XBB.1, BQ.1.1 and BR.2.1.
However, despite this apparent diversity, these new variants all follow a similar script, where the same set of changes have evolved independently across multiple variants. This is called convergent evolution.
These changes make the virus better at infecting people with immunity to existing variants. Since mid-October, the subvariants’ ability to escape immunity from vaccination and/or previous infection has been potent enough to cause a new wave in Australia.
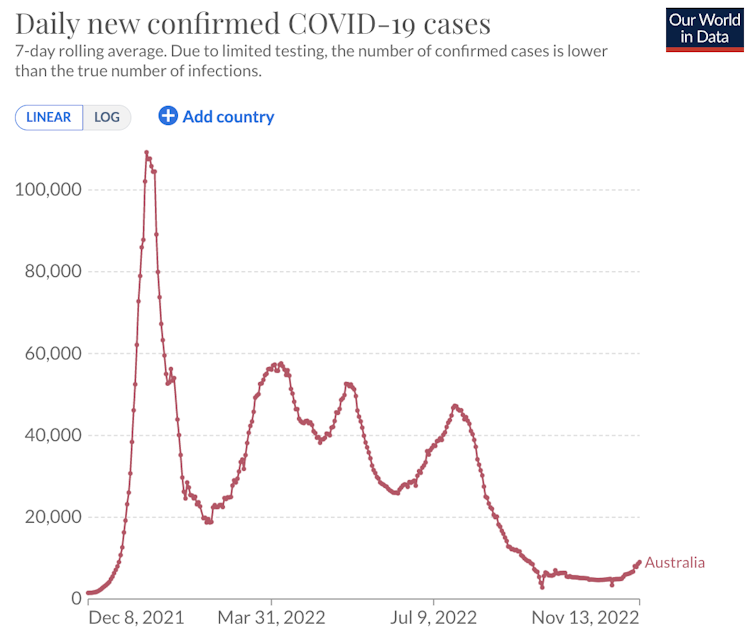
The graph below shows the series of 2022 waves, with the original Omicron the first wave, followed by the double-bump BA.2 (where Western Australia had different timing), the winter BA.5 wave, and now a new upswing in November.

In some good news, this wave is likely to be a shorter and smaller version of the BA.5 wave. Here’s why.
Cases are rising rapidly
In Australia, the wave is already growing rapidly, with indicators such as recorded cases and hospital occupancy showing significant increases in multiple states over the last two weeks.
New South Wales reports on the trend in the underlying variants, with a clear shift since early October.
Removal of mandatory reporting and isolation has led to fewer rapid antigen tests (RATs) being reported. So we may only be recording a smaller fraction of all community infections now than in previous waves.
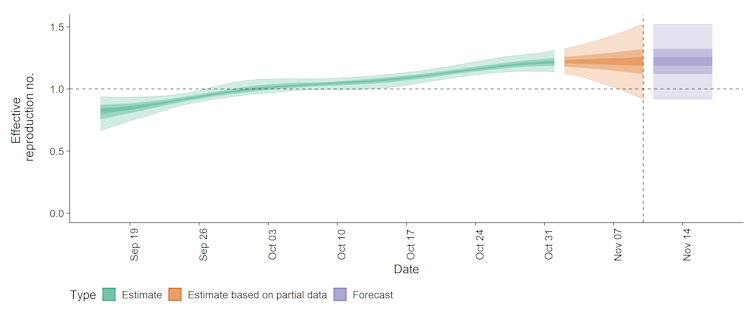
In the graph below, I’ve used the EpiNow2 R package (an open-source estimation and forecasting tool) to calculate the trend in the effective reproduction number (Rt) using NSW case data since early September.
Rt represents the average number of people that a single COVID case infects at a given point in time. Epidemics decline when Rt is less than 1, while epidemic growth becomes likely once Rt is above 1 and is increasingly steep as Rt rises. This is now substantially above 1 in New South Wales:

Will the wave peak by Christmas? Lessons from Singapore
I think the most likely outcome is the wave will peak by Christmas. In my own work for NSW Health, I am currently projecting a peak in NSW for the first week of December.
But these predictions are uncertain because it is still difficult to estimate the level of protection against infection in our population, despite impressive near real-time laboratory science that is helping to characterise this.
Fortunately, despite the challenges with modelling, the recent Singapore wave can guide our expectations. Caused by XBB.1, this wave was short and sharp, peaking around October 18 and then dropping back almost to pre-wave levels by November 12.
Read more: XBB and BQ.1: what we know about these two omicron 'cousins'
Singapore has also seen a significant increase in hospitalisations, primarily in people aged above 70.
However cumulative cases, admissions and deaths are tracking to be about half those of their BA.5 wave, with no signs of increased severity.
Despite the ability of XBB.1 to evade vaccination and/or previous infection, in Singapore people with prior Omicron infections were about 75% less likely to test positive in this wave than in people without recorded prior infections.
Singapore has also had quite a similar COVID pandemic experience to Australia in terms of restrictions, vaccination and infection waves. One exception is that mask-wearing remains more prevalent in Singapore.

We should, however, expect some differences. Australia has about six times the resident population of Singapore with widely separated population centres. This might mean the wave duration across Australia is one to two weeks longer.
Australia also has a higher proportion of the population above 75, a large fraction of whom haven’t had COVID this year and therefore won’t have hybrid immunity (from both vaccination and prior infection). This could result in more hospital admissions and deaths per capita than in Singapore.
But in general, the Singapore wave supports the prediction this fourth Australian wave of 2022 will peak in early December and fall back below current levels by Christmas.
Is this the new normal? What can we expect in the years to come?
Beyond this year, I’m encouraged by the shift in pattern from single variants causing waves to the evolving variant soup. This evolution has been very rapid recently but there are signs this may slow considerably in 2023.
Firstly, the rate at which mutations occur is proportional to how much virus is circulating. The enormous number of COVID infections across this year mean that in 2022 this change has happened quickly but with each wave getting smaller, this rate of change should slow.
The recent variant soup evolution may also be a positive sign. The different variants in the soup have all gained a transmission advantage following the same immune-escape strategy. The set of relevant mutations were in fact predicted in advance by researchers at the University of Washington.
If you are infected with one of these new variants, you should also have strong protection to the rest of the soup. The absence of big mutational jumps in dominant variants suggests SARS-CoV2, the virus that causes COVID, may now be entering a period of slower, more continuous evolution. This is what we see for seasonal influenza.
COVID has been full of surprises but the evidence suggests we could see SARS-CoV-2 infections fall below our recent trough levels in 2023 and the beginning of a more seasonal pattern to COVID waves.
Read more: Why haven't I had COVID yet?
James Wood receives funding from NSW Health and the NHMRC. He is a voting member of the Australian Technical Advisory Committee on Immunisation and is a member of the Variants of Concern subgroup of the Communicable Diseases Genomics Network of Australia.
This article was originally published on The Conversation. Read the original article.


