Uber Technologies Inc. (NYSE:UBER) shares were trading higher Tuesday following a Wall Street Journal report indicating the company is launching a campaign to head off Democratic efforts to classify its workers as employees, which would allow them to form unions.
Uber was up 8.86% at $31.10 ahead of the close.
See Also: Uber Analyst Bullish Following Guidance Update, Says Rising Gas Prices Not A Threat
Uber Daily Chart Analysis
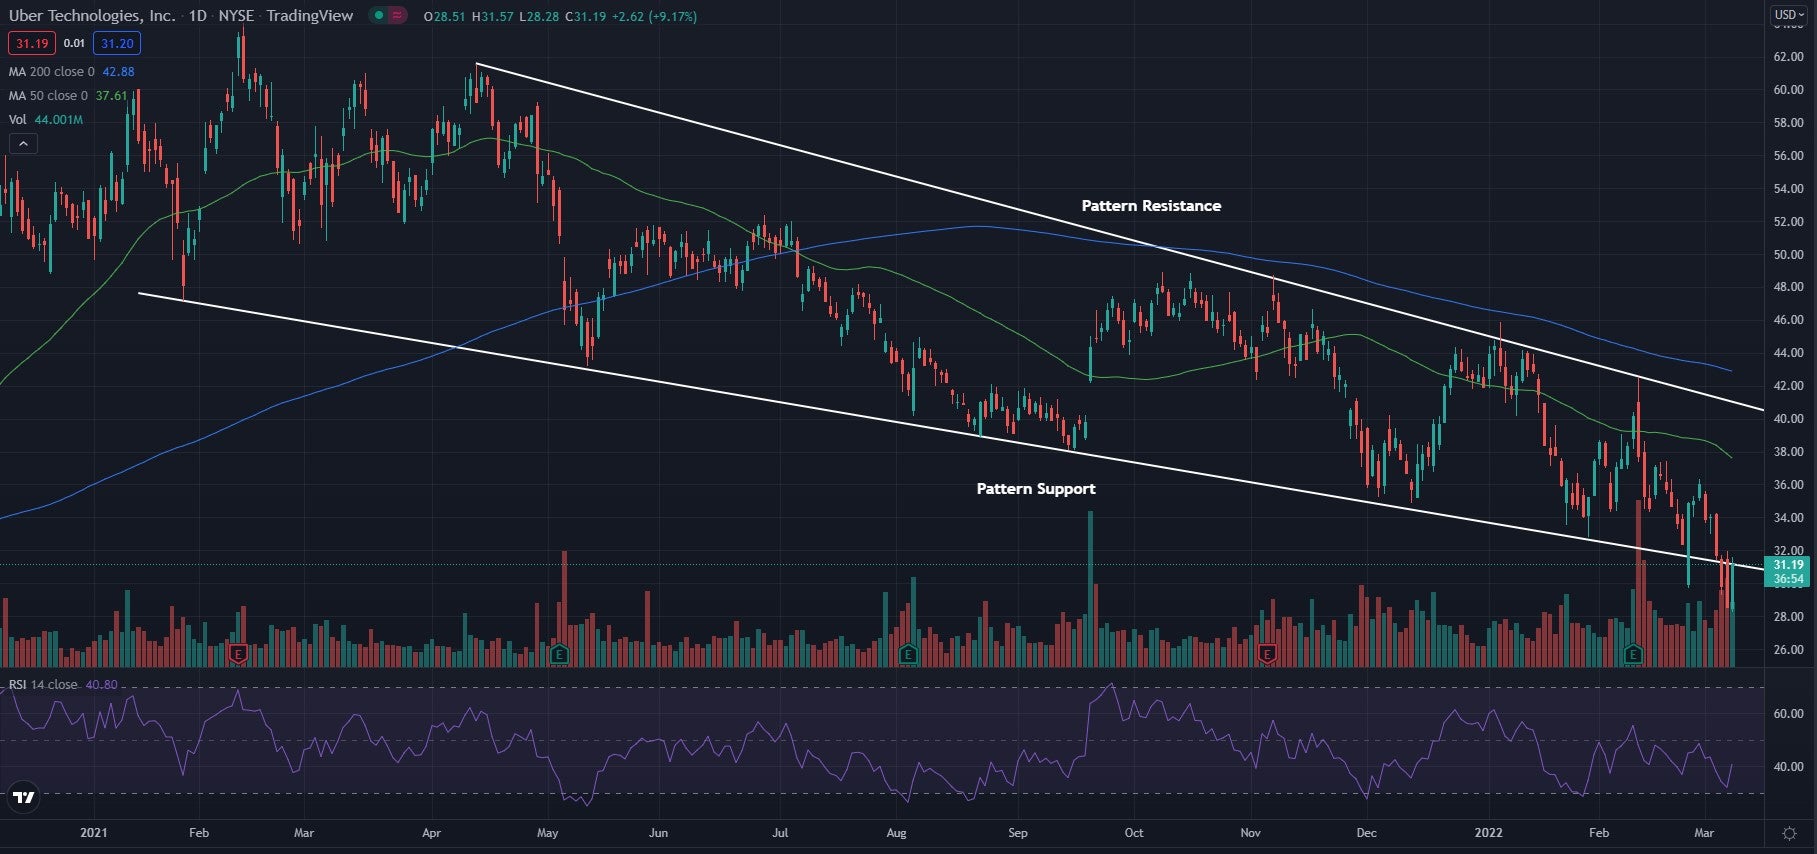
- The stock is barely hanging on to support in what traders call a falling wedge pattern. This pattern is known to be a bullish reversal pattern, as the highs are falling at a steeper rate than the lows. If the price can cross and hold above resistance, the stock may see a reversal in time.
- The stock trades below both the 50-day moving average (green) and the 200-day moving average (blue). This indicates bearish sentiment, and each of these moving averages may hold as an area of resistance in the future.
- The Relative Strength Index (RSI) has been falling over the course of the last few weeks, but in the last couple of days it has risen and sits at 41. This shows that slowly more sellers have been moving into the market, but in the last couple of days the market has seen buyers move into it. The market is still dominated by sellers and would need to see the RSI get back above the middle line to see a possible turn around.

What’s Next For Uber?
Uber has seen some bearish movement over the last few weeks and needs to see more bullish momentum or it may fall out of the wedge pattern. The stock is barely hanging above support, and if this level becomes resistance the stock could see a strong bearish move. This is what bearish traders are looking to see, as well as for the RSI to fall into the oversold region.
Bullish traders are looking to see the stock form higher lows and push toward resistance in the pattern, eventually breaking above and starting a reversal.


