Uber Technologies Inc. (NYSE:UBER) shares are trading higher Wednesday in anticipation of the company’s fourth-quarter earnings results scheduled to report after the market close. The consensus estimate calls for a loss of 29 cents per share and the consensus revenue estimate is $5.36 billion, an increase of 69.1% year-over-year.
Uber was up 4.30% at $39.99 at the time of publication.
See Also: How To Buy Uber Stock
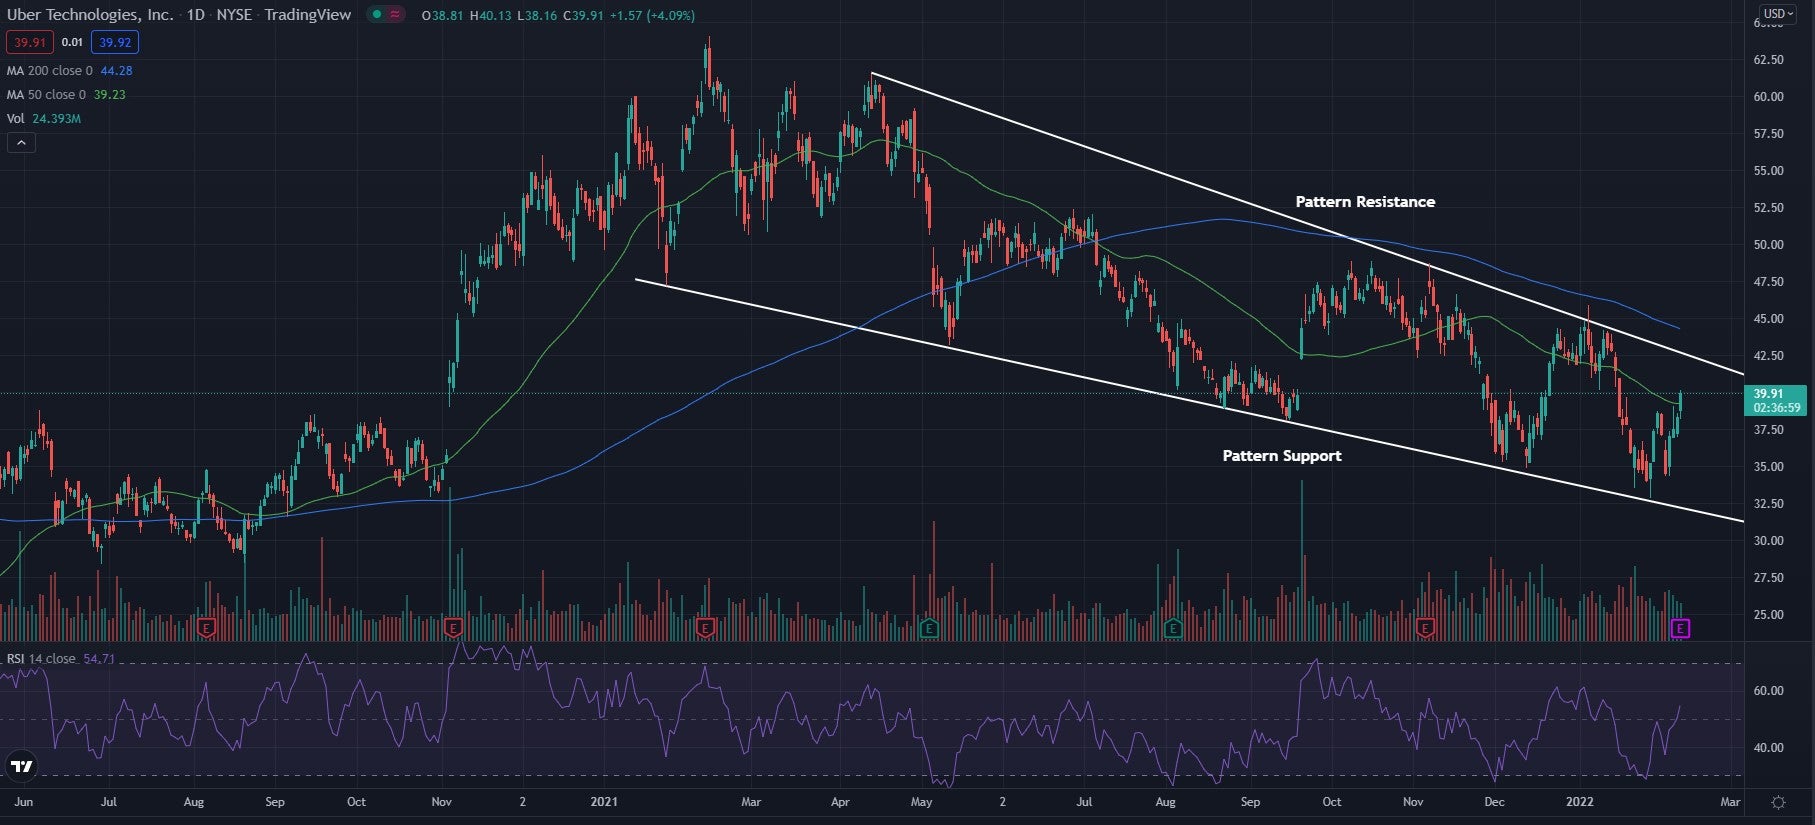
Uber Daily Chart Analysis
- The stock is nearing resistance in what traders call a falling wedge pattern. This pattern can be seen by the falling highs and lows, with highs falling at a steeper rate than the lows. The falling wedge pattern is known to be a bullish reversal pattern if the stock can cross above the pattern’s resistance level and can consolidate above it.
- The stock crossed above the 50-day moving average (green) Wednesday, but continues to trade below the 200-day moving average (blue). This indicates the stock is beginning to see some consolidation. The 50-day moving average may hold as an area of support, while the 200-day moving average may act as resistance.
- The Relative Strength Index (RSI) has been climbing for the past couple of weeks and now sits at 54. The RSI crossing above the middle line shows that the stock is seeing more buying pressure now than selling pressure. This is a sign of a potential reversal coming in the future.

What’s Next For Uber?
Uber is nearing resistance in the pattern and could confirm a reversal if it is able to cross the level and consolidate above it for a time.
Bullish traders are looking for the stock to cross above resistance and form higher lows, which would begin to show bullish momentum. Bulls want to see the RSI continue to hold above the middle line as well as see the price cross back above the 200-day moving average.
Bearish traders are looking to see the resistance hold and for the price to continue to fall lower in the pattern, eventually dropping below the support area.


