
Most traders use Bollinger Bands the wrong way. They look for “overbought” or “oversold” conditions… and end up fading strong trends too early.
But in a recent webinar, Senior Market Strategist John Rowland, CMT, breaks down a different approach — one that focuses on where price sits inside the bands, not just when it hits the extremes. And with Barchart’s new features, that analysis just got a lot more precise.
The Real Edge: Where Price Sits Inside the Bands
Instead of guessing setups visually, you can now sort stocks based on their exact relationship to Bollinger Bands:
- Above or below the 20-day moving average (mid-band)
- Near the upper or lower band
- Ranked position within the band range
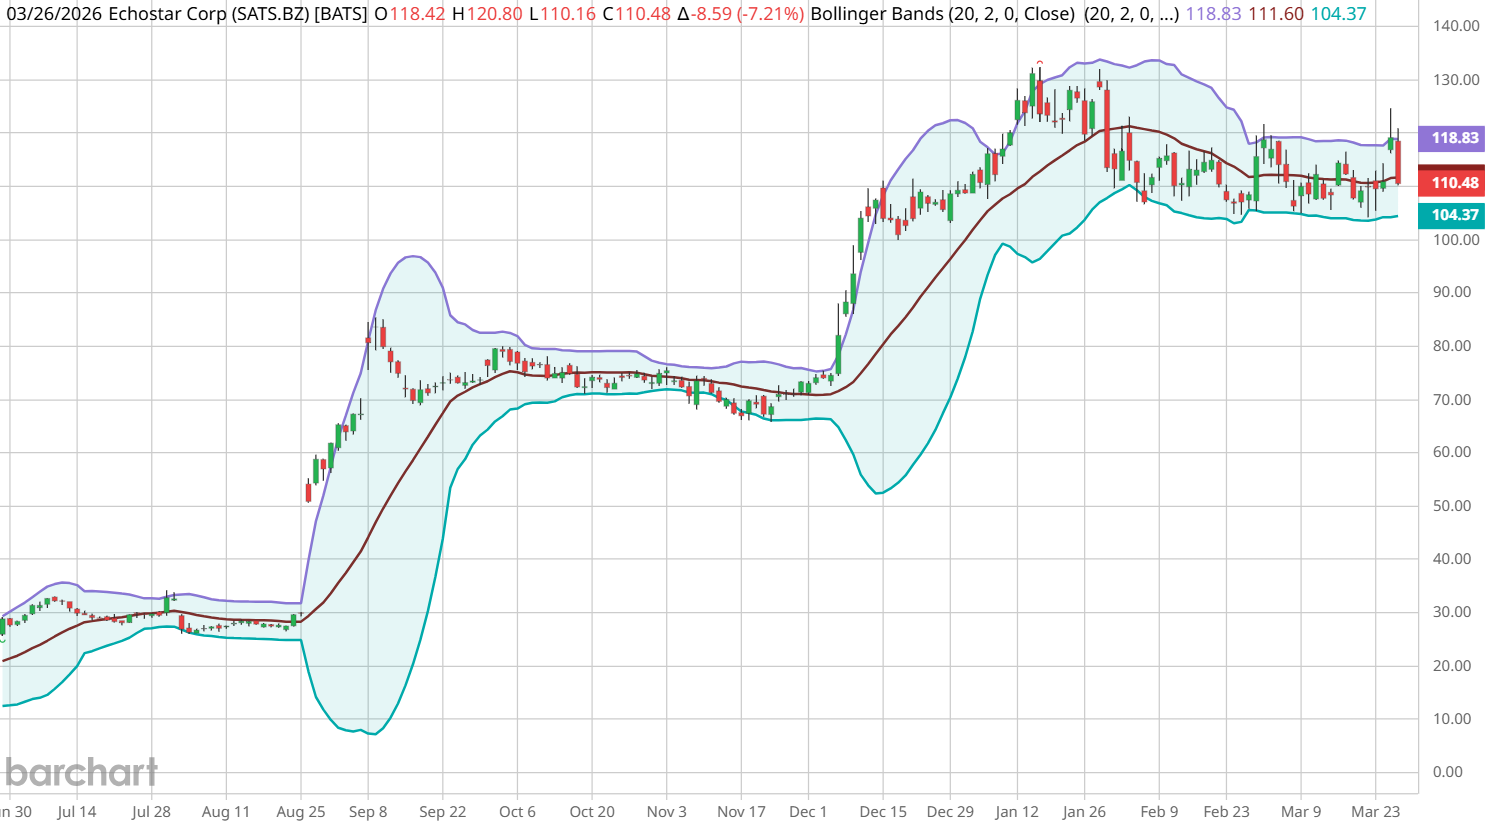
That matters because it tells you what phase of the trend a stock is actually in, not just whether it looks extended. When John ran this scan, something stood out immediately — a large number of stocks were sitting between the central 20-day moving average and the upper band.
Why does that matter?
The Setup That Matters: Contraction → Breakout
The highest-probability move doesn’t come from oversold conditions. It comes from compression followed by expansion.
Here’s what John is specifically looking for:
- Bollinger Bands tightening (low volatility / contraction)
- Price holding or reclaiming the 20-day moving average
- A move toward or through the upper band
That combination signals a shift from consolidation into what traders call the impulse phase, which is where price starts trending with momentum.
Why Most Traders Miss This
Most traders are trained to buy dips, fade extremes, and wait for “perfect” entries. But strong trending markets don’t always give clean pullbacks.
Instead, they move from: consolidation → breakout → continuation. That means if you’re only looking for pullbacks, you might miss the entire move.
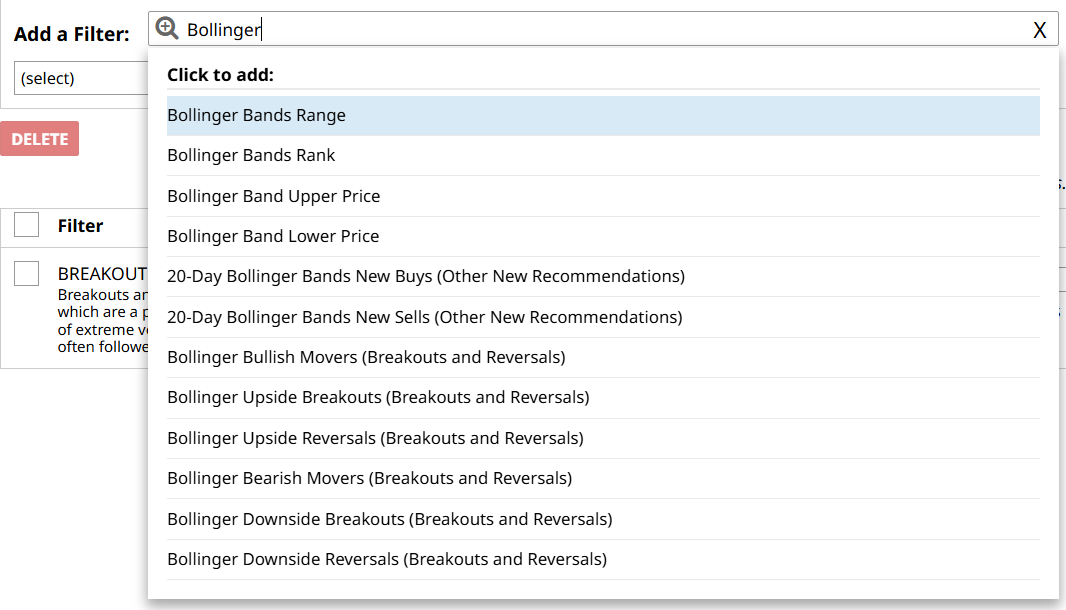
How to Find These Setups on Barchart
With Barchart’s updated Breakouts & Reversals page and Bollinger Band filters, you can now scan for these setups directly:
- Filter stocks above the mid-band
- Identify assets moving toward the upper band
- Look for recent band contraction (squeeze)
- Focus on strong, trend-persistent names
This removes the guesswork and helps you find momentum before it fully expands.
The Bottom Line
Bollinger Bands aren’t just about overbought and oversold levels. Used correctly, they show you:
- Where a stock is in its trend
- When volatility is compressing
- When momentum is about to expand
And right now, many stocks are showing signs of entering that impulse phase.
Watch this quick breakdown:
- Stream the full webinar on Stock Screeners
- Scan Bollinger Band setups using Breakouts & Reversals