Want to buy a home in a city with a high cost of living such as Miami, New York or Los Angeles? Unless you earn substantially more than the average salary, most of your income likely will go toward housing and create a potentially unsustainable “house poor” situation.
According to a new GOBankingRates study, Americans spend more than 30% of their income on home costs in these three popular metros. Conversely, Raleigh, North Carolina, and Gilbert, Arizona, rank among the five most “house rich” cities in the nation — where homeowners pay less than 19% of their income on home costs.
Read More: GOBankingRates Original Research Center
Find Out: How Middle-Class Earners Are Quietly Becoming Millionaires — and How You Can, Too
For this research piece, GOBankingRates studied major cities with at least 100,000 total population and sourced key factors such as median household income and average home value. Using Census data, the percentage of income spent on housing costs was calculated. The 50 highest and lowest cities were ranked by the percentage of income spent on selected monthly housing costs.

Key Findings
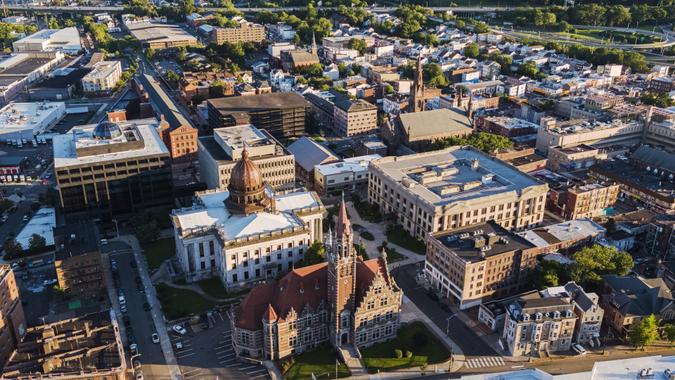
- Newark, New Jersey, is the most house-poor city in America. Homeowners spend 36% of their income on home costs in The Garden State.
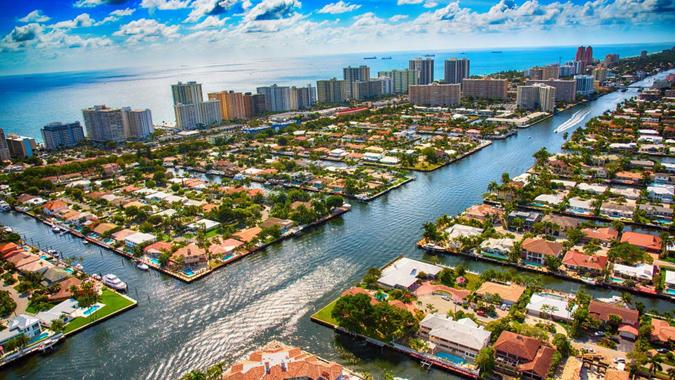
- Homeowners in the nation’s five most house-poor cities spend more than 33% of their income on housing expenses. Joining Newark are Hialeah, Florida (34%); Miami Gardens, Florida (34%); El Monte, California (34%) and Miami (33%).
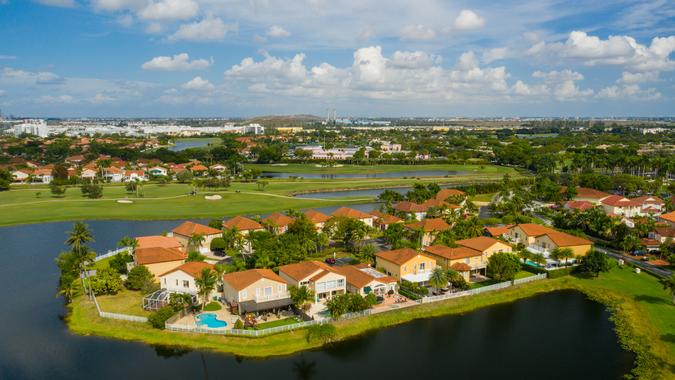
- Six Florida cities ranked as the nation’s most house poor. Homeowners in Hialeah (#2), Miami Gardens (#3), Miami (#5), Hollywood (#10), Pompano Beach (#12), Pembroke Pines (#19) and Fort Lauderdale (#20) spend 29% or more of their salary on home costs.
- Fishers, Indiana, is America’s most house-rich city. Only 16% of homeowner income goes toward home costs.
- The top three house-rich cities see 17% or less of homeowner income going toward housing expenses: Fishers (16%); Carmel, Indiana (16%) and Cary, North Carolina (17%).
Take a look at the 25 most house poor and 25 most house rich major cities in America. Plus, check out the nation’s safest and richest cities to live in.
Learn More: I’m Retired and Regret Moving To Hawaii — Here’s Why
See Next: The Wealthiest Suburb in Each of America’s 50 Largest Metro Areas

The 25 Most House-Poor Major Cities in America
Homeowners in these 25 major U.S. cities spend 29% or more of their income on home costs, making it possible to become house poor.
View More: The Cost of Homes in Florida’s 6 Best Counties for Snowbird Retirees

1. Newark, New Jersey
- Total population: 307,188
- Average home value: $500,189
- Median household income: $48,416
- % of income spent on home costs: 36.1%
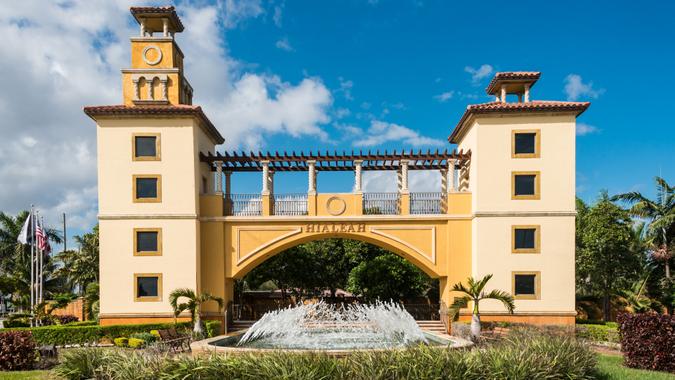
2. Hialeah, Florida
- Total population: 221,901
- Average home value: $559,873
- Median household income: $53,079
- % of income spent on home costs: 34.3%

3. Miami Gardens, Florida
- Total population: 111,264
- Average home value: $480,854
- Median household income: $60,979
- % of income spent on home costs: 34.1%

4. El Monte, California
- Total population: 107,066
- Average home value: $763,579
- Median household income: $64,484
- % of income spent on home costs: 33.7%
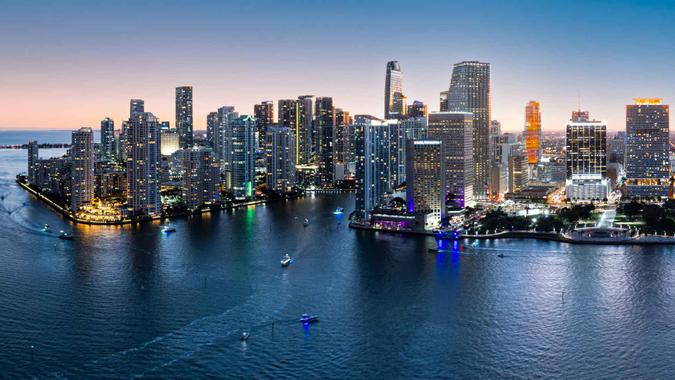
5. Miami
- Total population: 446,663
- Average home value: $653,250
- Median household income: $59,390
- % of income spent on home costs: 33.5%
6. Bridgeport, Connecticut
- Total population: 148,012
- Average home value: $394,981
- Median household income: $56,584
- % of income spent on home costs: 32.7%
Discover Next: 10 Best Places on the East Coast To Retire With $500K in Savings

7. Elizabeth, New Jersey
- Total population: 135,887
- Average home value: $557,976
- Median household income: $63,874
- % of income spent on home costs: 32.2%

8. New York City
- Total population: 8,516,202
- Average home value: $855,561
- Median household income: $79,713
- % of income spent on home costs: 32.1%
9. Paterson, New Jersey
- Total population: 157,660
- Average home value: $530,438
- Median household income: $53,766
- % of income spent on home costs: 32%

10. Hollywood, Florida
- Total population: 152,935
- Average home value: $504,693
- Median household income: $65,359
- % of income spent on home costs: 32%

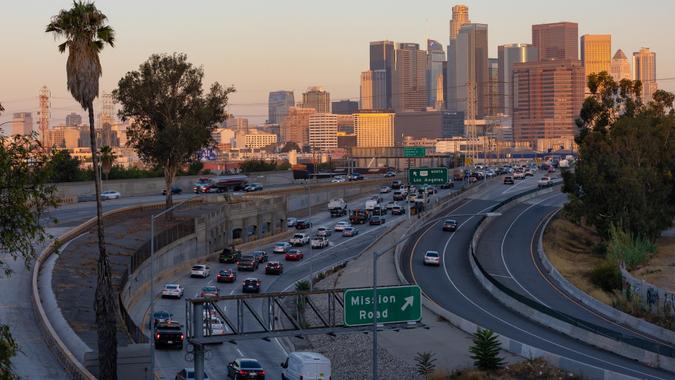
11. Los Angeles
- Total population: 3,857,897
- Average home value: $1,008,510
- Median household income: $80,366
- % of income spent on home costs: 31.6%
Explore More: 12 Midwest Cities Where Rent Costs 30% or Less of a Middle-Class Income
12. Pompano Beach, Florida
- Total population: 112,212
- Average home value: $441,580
- Median household income: $63,832
- % of income spent on home costs: 31.4%

13. Inglewood, California
- Total population: 105,575
- Average home value: $780,259
- Median household income: $71,029
- % of income spent on home costs: 31.3%

14. Oceanside, California
- Total population: 172,542
- Average home value: $884,013
- Median household income: $93,724
- % of income spent on home costs: 31.1%

15. Menifee, California
- Total population: 107,020
- Average home value: $588,008
- Median household income: $89,183
- % of income spent on home costs: 30.9%

16. Glendale, California
- Total population: 192,270
- Average home value: $1,340,576
- Median household income: $84,262
- % of income spent on home costs: 30.5%
Read Next: These Are America’s 50 Wealthiest Suburbs in 2025

17. Honolulu
- Total population: 346,323
- Average home value: $1,242,726
- Median household income: $85,428
- % of income spent on home costs: 30.4%

18. New Orleans
- Total population: 376,035
- Average home value: $233,370
- Median household income: $55,339
- % of income spent on home costs: 30.3%
19. Pembroke Pines, Florida
- Total population: 170,557
- Average home value: $590,600
- Median household income: $81,675
- % of income spent on home costs: 30.1%
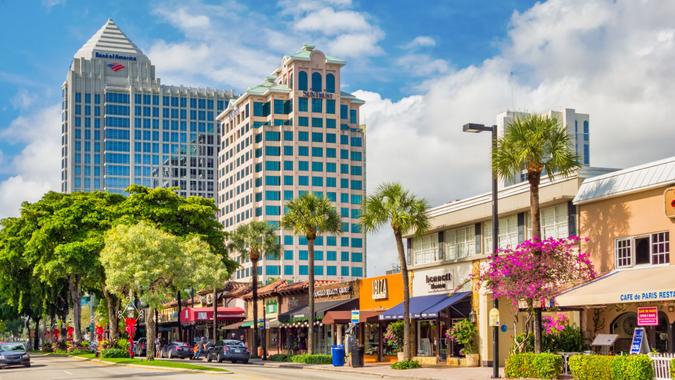
20. Fort Lauderdale, Florida
- Total population: 183,032
- Average home value: $578,234
- Median household income: $79,935
- % of income spent on home costs: 29.9%
21. East Los Angeles, California
- Total population: 114,617
- Average home value: $664,674
- Median household income: $68,378
- % of income spent on home costs: 29.9%
View Next: 25 Places To Buy a Home If You Want It To Gain Value

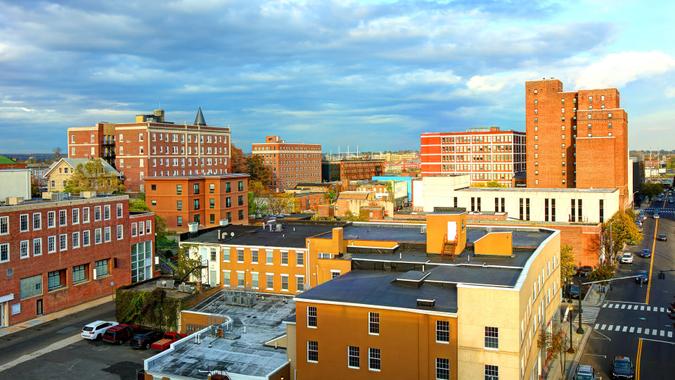
22. Lynn, Massachusetts
- Total population: 100,905
- Average home value: $597,996
- Median household income: $74,715
- % of income spent on home costs: 29.8%
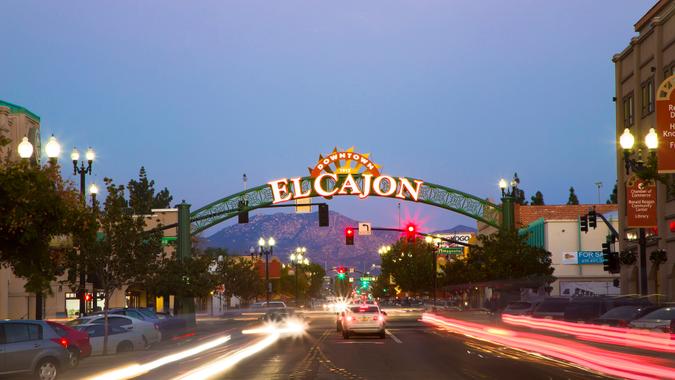
23. El Cajon, California
- Total population: 104,909
- Average home value: $828,598
- Median household income: $66,478
- % of income spent on home costs: 29.8%

24. Torrance, California
- Total population: 143,499
- Average home value: $1,208,701
- Median household income: $113,105
- % of income spent on home costs: 29.4%
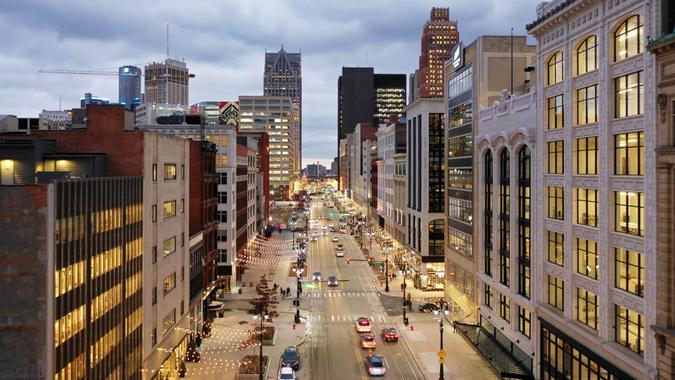
25. Detroit
- Total population: 636,644
- Average home value: $76,857
- Median household income: $39,575
- % of income spent on home costs: 29.4%

The 25 Most House-Rich Major Cities in America
Homeowners do not exceed spending more than 20% of their income on home costs in these 25 major cities, many of which are in regions with lower cost of living.
Be Aware: How Much House Does $300K, $400K and $500K Buy You in Every State?

1. Fishers, Indiana
- Total population: 100,918
- Average home value: $449,883
- Median household income: $128,141
- % of income spent on home costs: 16.4%

2. Carmel, Indiana
- Total population: 100,501
- Average home value: $560,215
- Median household income: $134,602
- % of income spent on home costs: 16.5%

3. Cary, North Carolina
- Total population: 176,686
- Average home value: $628,281
- Median household income: $129,399
- % of income spent on home costs: 17.2%

4. Raleigh, North Carolina
- Total population: 470,763
- Average home value: $441,552
- Median household income: $82,424
- % of income spent on home costs: 18.1%
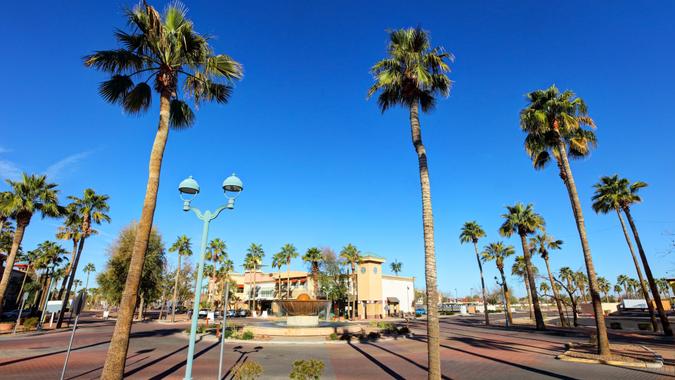
5. Gilbert, Arizona
- Total population: 271,118
- Average home value: $573,316
- Median household income: $121,351
- % of income spent on home costs: 18.4%
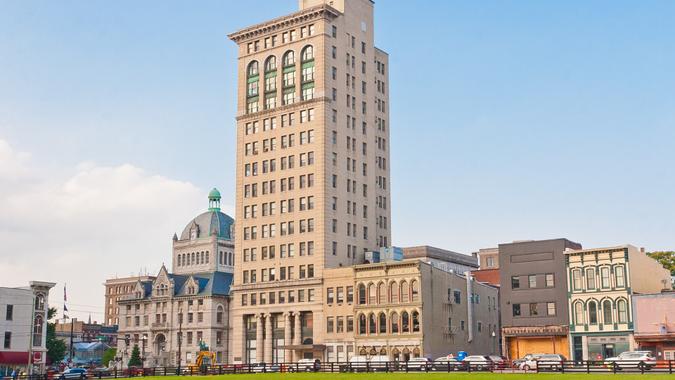
6. Lexington, Kentucky
- Total population: 321,122
- Average home value: $325,728
- Median household income: $67,631
- % of income spent on home costs: 18.4%
For You: 4 Housing Markets That Have Plummeted in Value Over the Past 5 Years

7. Durham, North Carolina
- Total population: 288,465
- Average home value: $402,001
- Median household income: $79,234
- % of income spent on home costs: 18.4%

8. Grand Rapids, Michigan
- Total population: 197,768
- Average home value: $294,787
- Median household income: $65,526
- % of income spent on home costs: 18.5%

9. Huntsville, Alabama
- Total population: 218,814
- Average home value: $285,506
- Median household income: $70,778
- % of income spent on home costs: 18.6%

10. Fort Wayne, Indiana
- Total population: 266,235
- Average home value: $237,220
- Median household income: $60,293
- % of income spent on home costs: 18.7%

11. Springfield, Illinois
- Total population: 113,714
- Average home value: $164,507
- Median household income: $65,537
- % of income spent on home costs: 18.8%
Trending Now: The Cheapest Place To Buy a Home in Every State

12. Chandler, Arizona
- Total population: 278,123
- Average home value: $531,789
- Median household income: $103,691
- % of income spent on home costs: 19%

13. Olathe, Kansas
- Total population: 143,720
- Average home value: $415,750
- Median household income: $112,232
- % of income spent on home costs: 19%

14. Davenport, Iowa
- Total population: 101,083
- Average home value: $187,287
- Median household income: $64,497
- % of income spent on home costs: 19%

15. Tempe, Arizona
- Total population: 186,419
- Average home value: $484,564
- Median household income: $77,643
- % of income spent on home costs: 19%

16. Lee’s Summit, Missouri
- Total population: 102,583
- Average home value: $388,498
- Median household income: $104,989
- % of income spent on home costs: 19.1%
Check Out: Florida Alternatives: Experts Predict These 5 States Will Be Top Retirement Spots in 10 Years

17. Rochester, Minnesota
- Total population: 121,638
- Average home value: $341,476
- Median household income: $87,767
- % of income spent on home costs: 19.1%

18. Columbia, Missouri
- Total population: 127,200
- Average home value: $323,038
- Median household income: $64,488
- % of income spent on home costs: 19.2%

19. Charlotte, North Carolina
- Total population: 886,283
- Average home value: $404,822
- Median household income: $78,438
- % of income spent on home costs: 19.2%

20. Fargo, North Dakota
- Total population: 129,064
- Average home value: $325,917
- Median household income: $66,029
- % of income spent on home costs: 19.3%

21. Akron, Ohio
- Total population: 189,526
- Average home value: $134,618
- Median household income: $48,544
- % of income spent on home costs: 19.4%
That’s Interesting: What Salary Single People Need To Live Comfortably in 100 Major US Cities
22. Broken Arrow, Oklahoma
- Total population: 115,919
- Average home value: $283,418
- Median household income: $85,220
- % of income spent on home costs: 19.5%

23. Highlands Ranch, Colorado
- Total population: 101,437
- Average home value: $711,391
- Median household income: $155,847
- % of income spent on home costs: 19.5%

24. Norman, Oklahoma
- Total population: 128,714
- Average home value: $265,845
- Median household income: $65,060
- % of income spent on home costs: 19.5%

25. South Bend, Indiana
- Total population: 102,866
- Average home value: $181,250
- Median household income: $52,512
- % of income spent on home costs: 19.5%
Check out more original studies and surveys in the GOBankingRates original research center.
Methodology: Using the U.S. Census 5-Year 2023 ACS, GOBankingRates sourced total population, households, median household income, median income for owner-occupied households, median selected monthly owner costs for units with mortgages, and number of homes with a mortgage. The percentage of median owner-occupied household income spent on owner-occupied selected monthly owner housing costs was then calculated using the Census data. The 50 highest and lowest cities with the percentage of median owner-occupied household income spent on owner-occupied selected monthly owner housing costs were identified. Cost-of-living indexes were sourced from Sperling’s BestPlaces. Using expenditure costs for owner-occupied households with mortgages, as sourced from the Bureau of Labor Statistics Consumer Expenditure Survey, the average expenditure costs were calculated for each city. The average home value was sourced from Zillow Home Value Index. By assuming a 10% down payment and using the national average 30-year fixed mortgage rate, the average mortgage was calculated for each city. Using the average mortgage and expenditures, the average total cost of living for necessities was calculated for each city. All data was collected on Nov. 13, 2025.
More From GOBankingRates
This article originally appeared on GOBankingRates.com: The Most House-Poor (and Rich) Major Cities in America