Welcome to The Opener, where every weekday morning during the regular season you’ll get a fresh, topical column to start your day from one of SI.com’s MLB writers.
It remains to be seen just how the shift will be regulated in 2023. While players have agreed that the league will be able to restrict the infield alignment next season, their agreement didn’t come with any confirmation on how, and so the details are still an open question. Will the new rule mandate two fielders on each side of second base? Just a general requirement of four players on the infield dirt? MLB says all of that is still undecided.
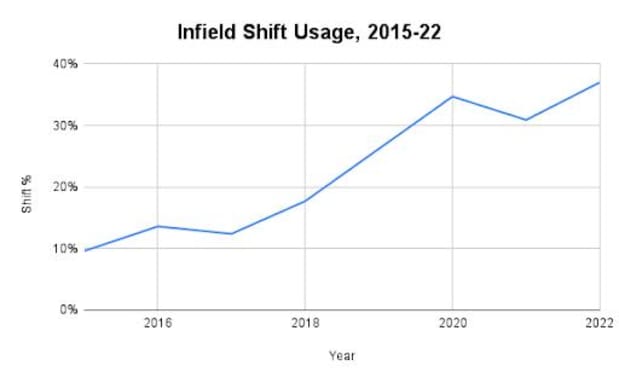
But while the shift is still around in the meantime? Teams aren’t shifting any less. In fact—in what should be the last season for the shift as we know it—teams are shifting more. Through Monday, MLB had seen infield shifts on 37% of pitches, a new record and a notable bump over last year.

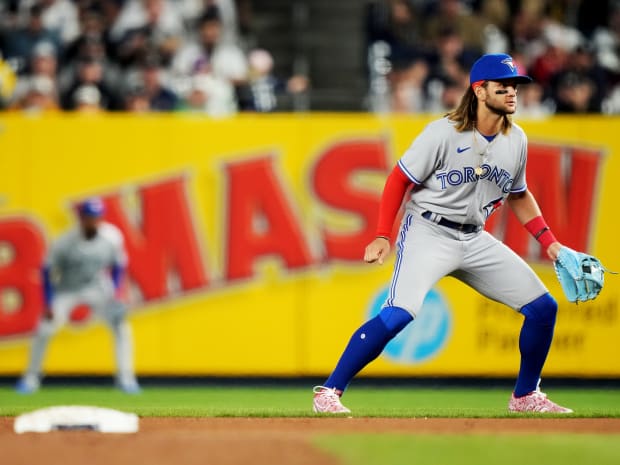
Erick W. Rasco/Sports Illustrated
Which perhaps should not be too surprising. After all, teams use the shift because it works, and that means they’re probably going to keep doing it right until the moment the league says they can’t. The shift has become only more popular over the last few years as teams have gotten better at pinpointing when to use it. (See: As often as possible against left-handed power hitters, and in other situations as needed.) So why should anyone have expected this year to be any different? Still, this season’s increase is notable. If this year is indeed the last hurrah for the shift, it seems like it’s going out with a bang, or at least with the gentle thwack of a ball into the glove of a perfectly positioned fielder.
Here is the percentage of pitches that teams have shifted on each year since 2015:

via Baseball Savant
That shift rate of 37% is above what MLB saw both last season (31%) and in the shortened pandemic season before it (35%). But it’s most striking in how it’s grown over time: The current increase means the rate has more than doubled in just four years.
Of course, there’s an obvious caveat here: It’s April. The season has barely gotten underway. But league-wide stats like this tend to stabilize much faster than individual or team stats, and compared to something like offensive metrics—where numbers can reliably be expected to increase each summer as the weather gets warmer—shift use is generally more stable. To the extent that it does change over the course of the year, it doesn’t move in a consistent direction: In 2021, for instance, April shift rates were slightly higher than they ended up being for the rest of the season, and in ’19, they were slightly lower. (It’s hard to know how to judge ’20: It does feel notable that the previous record for shift usage came in a shortened season! But so many aspects of play were different in the pandemic year that it’s difficult to know much weight to place on any one variable.) In other words, maybe teams will keep shifting at the rate they are right now, and maybe they won’t. But there’s no reason to write the current trend off as just early-season weirdness.
As to how much of an effect this is actually having on hitters? It’s hard to say. By now, you’ve probably heard that offenses are off to a historically slow start, with a league-wide batting average of just .232. (Which, again: It’s April. There are lots of factors in play here!) There’s been a notable drop in hits per game, and the shift is unsurprisingly part of that, if a difficult-to-dissect part. Yet the biggest component of that decrease has actually been in home runs per game, which, obviously, is the one area unaffected by the shift. (That one seems more connected to questions about the baseball.) So is the increase in the shift having some effect on offense? Almost certainly. Is that effect a driving factor of the collapse in offense? Not so much.
Watch MLB games online all season long with fuboTV: Start with a 7-day free trial!
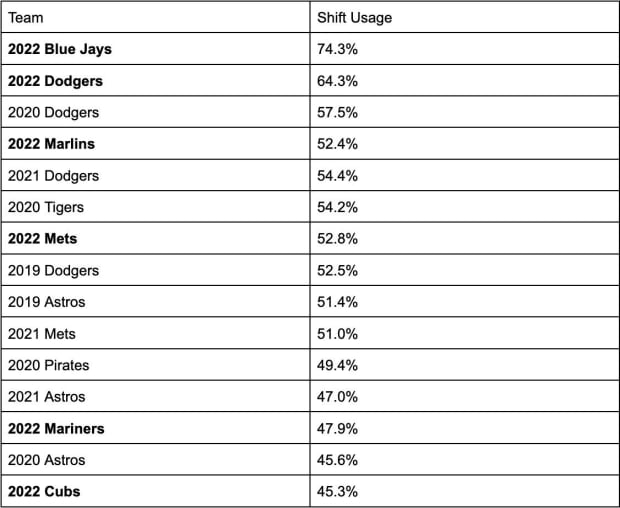
And the uptick in shifting isn’t equally distributed across the league. There are a handful of teams that have been driving the increase—including a few that have really led the way, shifting not just more than they did last year or the year before but more than any team has ever before. Take a look: Here’s a list of the 15 teams that have shifted the most since Statcast began tracking that data in 2015.

via Baseball Savant
The Blue Jays: 74.3%! While not a team that has shifted very much in years past, they seem to be doing as much as they can while it’s still an option.
Yet even with all the success Toronto has seen with it this season, there are still reminders that the shift is not invincible:
For a lefty hitter like Rizzo—a model candidate for the shift, who experienced it on 76% of the pitches he saw last year and 87% of those he’s seen this year—the alignment barely even registers anymore, he says.
“It’s just part of it,” Rizzo says. “When you do hit a ball hard and they’re shifting and it should be a hit, it stings, but that’s what it is right now.”
As for the idea that this is probably the last year where that’s the case?
“That’s more what you think about,” Rizzo says. “Yeah, that’s nice.”


