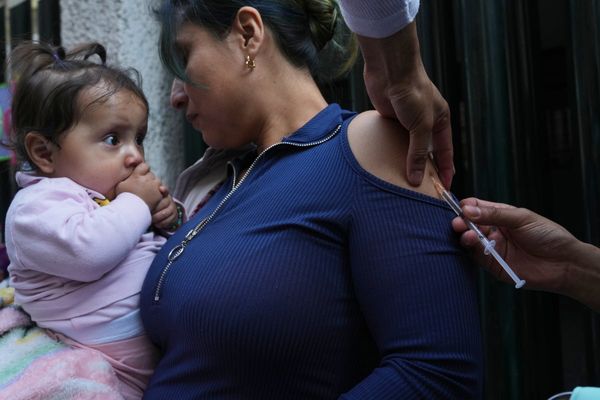
There are 18.6 million Asian Americans living in the US, making up 6% of the US population, according to the latest available census data. The data shows that, on average, Asian Americans are younger, more likely to be born abroad, and live in households with higher income than the average American.
That same census data also breaks down Asian American populations by ethnicity — a cultural identity tied to a specific Asian country. Demographic and socioeconomic data by ethnic groups shows the Asian American experience varies within the population, with differences in everything from age breakdowns, family size, and citizenship status.
How does the government define who is an Asian American?
In 1997, the Office of Management and Budget (OMB) outlined the current standards for federal data on race and ethnicity that separated the “Asian or Pacific Islander” category into "Asian" and "Native Hawaiian or Other Pacific Islander.”
The Census Bureau, which uses the OMB standards, defines an Asian person as “a person having origins in any of the original peoples of the Far East, Southeast Asia, or the Indian subcontinent including, for example, Cambodia, China, India, Japan, Korea, Malaysia, Pakistan, the Philippine Islands, Thailand, and Vietnam.”

A sample 2020 Census form
The agency has never had a checkbox for “Asian” or “Asian American” in its official census forms, unlike checkboxes for "White" or "Black.” In the 2020 edition, the agency offered a checkbox for six Asian ethnicities — Chinese, Filipino, Asian Indian, Vietnamese, Korean, and Japanese — along with a seventh “Other Asian” category accompanied by a fill-in text area.
The latest available demographic data on Asian Americans comes from the 2019 American Community Survey. The agency provides two datasets for each ethnicity: one that includes multiethnic or multiracial people, which amounts to 22.4 million people, and another that excludes them. For simplicity, this article only looks at the 18.6 million people who identify as a single Asian ethnicity and no other racial or ethnic categories. It also groups Chinese Americans with people who write in their Taiwanese ethnicity.
The largest share of Asian Americans are Chinese or Taiwanese.
Five Asian ethnicities have a population exceeding 1 million in the US. Chinese and Taiwanese Americans are the largest group at 4.4 million people, representing 24% of the Asian American population. Indian Americans make up 23% of all Asian Americans, Filipino Americans 16%, Vietnamese Americans 10%, and Korean Americans 8%.
Three states account for 48% of the Asian American population: California, New York, and Texas. The states with the largest share of Asian American population are Hawaii (39%), California (15%), and New Jersey (10%).
While Asian Americans as a group are younger, the median age for Japanese Americans is 14 years higher than the national median.
The median age for Asian Americans is 37.9 years old, lower than the overall average of 38.5. About 13% of Asian Americans are over 65 years old compared with 17% of the total population. Asian Americans also have a smaller proportion of children. About 19% of Asian Americans are under 18 years old compared with 22% of the overall population.
With a median age of 52.4, Japanese Americans are the oldest demographic group in the Census Bureau’s data — Asian or otherwise. About 29% of the Japanese American population is over 65 years old. Ten percent of Japanese Americans are children.
On the other end, Burmese and Hmong Americans have a median age of 28.9 and 27 years old, respectively. Hmong Americans 65 and older make up 4% of the ethnic group, the lowest share among all Asian ethnicities. Burmese Americans have the highest percentage of children at 34%.
Over 85% of Bangladeshi and Burmese American households are made up of families living together.
Seventy-three percent of Asian households are made up of families — instead of people living alone or with unrelated people — compared with 65% of all households. Eighty-eight percent of Bangladeshi American households are family-based, the highest of all racial or ethnic groups. On the low end, 58% of Japanese American households are family-based.
With an average of 3.5 people, Asian American families are larger than the average of all US families at 3.2. The average Hmong, Burmese, Pakistani, or Bangladeshi American family in the US all have more than four members. Japanese American families are the smallest among all groups, with an average size of 2.9.
Laotian Americans are half as likely as the average American to have a bachelor’s degree.
Fifty-six percent of Asian Americans over age 25 have at least a bachelor’s degree, compared with 33% of the total population. About 76% of Indian Americans have at least a bachelor’s, the highest of any ethnic or racial group, including non-Asians. Laotian Americans have the lowest educational attainment among Asian ethnicities. About 16% of Laotian Americans 25 and older have at least a bachelor’s degree.
Indian Americans bring in almost twice the income of the average American.
The median household income for Asian American households is $93,759 a year, 43% higher than the US median of $65,712. Two Asian American ethnic groups have a higher median household income than that of all Asian American households. The median household income for Indian American households is $126,705, while the median for Filipino American households is $100,273.
Read more: Which jobs have the highest representation of Asian Americans?
Hmong Americans are over three times more likely than Nepalese Americans to have been born in the US.
About 86% of the overall population was born in the US, with another 7% naturalized, and 7% foreign-born and not US citizens. Among Asian Americans, the population breaks down as 34% native-born, 40% naturalized, and 26% not US citizens.
Sixty-five percent of Hmong Americans were born in the US, the highest share among Asian ethnicities. On the other end, 19% of people with Nepalese heritage were born in the US. Nepalese Americans were also the only Asian group, with more than half of its group not US citizens.
Learn more about race and ethnicity demographics on the Race in America page.


