A 'wet weekend's work' by NZ's most brilliant economist is being embraced by the world's central banks to help chart a course out of pandemic
Bill Phillips was a genius. That's according to former Reserve Bank Governor Alan Bollard, who met the famed economist as an undergrad student at the University of Auckland.
To be fair, Bollard has always championed the work of Dannevirke-born AWH Phillips, and wrote his biography – but now, others are returning to the same view.
Phillips was the creator of a chart highlighting how unemployment often drops as wage inflation rises – an inverse relationship that became known as the Phillips Curve. The Reserve Bank used a not-very-curvy sort of Phillips Curve in its Monetary Policy Statement last week, to illustrate the contributions of labour market tightness, CPI inflation and past wage inflation to rising wages in the future.
READ MORE: * Don't blame the workers: NZ escapes wage-price spiral * Behind the 12% pay rise for Countdown staff
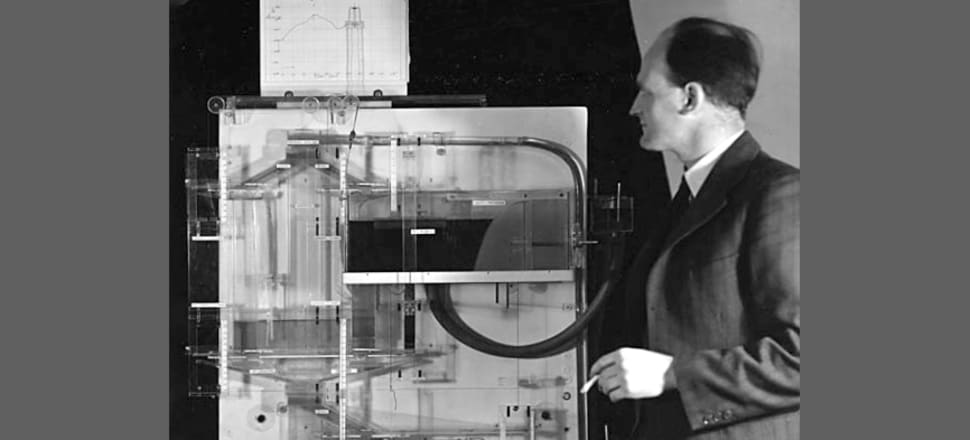
Phillips would have preferred to be remembered for his first dynamic models of the economy. Or for his Moniac machine, a hydraulic model of the economy funneling water from one container to another to represent monetary flows from consumption to income to investment, including "leakages” to imports. It now resides in the Reserve Bank's museum in Wellington and, according to the NZ Association of Economists, its models also suffered real leakages so demonstrations could be a damp affair!
He dismissively described his 1958 journal article containing the first Phillips Curve chart as a “wet weekend’s bit of work”, of only passing interest. Nevertheless, that article led to a re-shaping of macroeconomic policy for decades to come.
"I think he was quite embarrassed by having it called the Phillips Curve," Bollard tells Newsroom.
Rightly or wrongly, it came to guide governments the world over, as providing "a menu of policy options". In the UK, for instance Conservative governments would push down inflation at the expense of rising unemployment; Labour governments would place jobs first even if that meant soaring prices, Bollard says. They would blithely cite the Phillips Curve as proving there was no other way – inflation or unemployment, you had to have one or the other.
But the Phillips Curve went somewhat out of vogue from the 1980s, as the monetarist heirs to Thatcher, Reagan and Roger Douglas shaped an economy in which, they believed, both inflation and unemployment could be maintained at a low and sustainable midpoint.
Now, as we emerge from two years of lockdowns, various improved Phillips Curves are making a comeback.
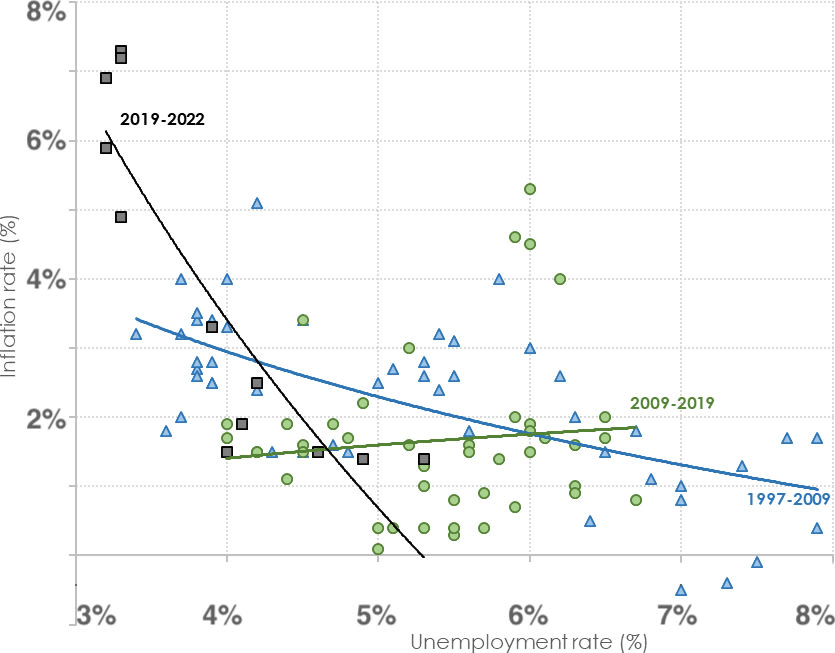
The traditional Phillips Curve, kindly provided by Kiwibank economist Mary Jo Vergara this week, showed why any long-term inverse relationship between inflation and unemployment might have been discredited in the years before the pandemic. Inflation sat stubbornly below 2 percent (the Reserve Bank's targeted mid-point) regardless of the highs and lows of unemployment; the so-called curve flatlined.
At its essence, says Vergara, the Phillips curve describes the inverse relationship between inflation and unemployment. "When inflation goes up, unemployment should go down as economic growth picks up, jobs are plentiful, and wages rise. Vice versa, when inflation falls.
"The Phillips Curve looks to be making a comeback ... It would seem that Bill Phillips’ observation some 60 years ago – that wages tend to rise faster when unemployment is low – can aptly explain today’s (expensive) economic environment." – Mary Jo Vergara, Kiwibank
"Post-GFC, the slope of the New Zealand Phillips Curve had practically inverted. Inflation remained mysteriously low – averaging well below the Reserve Bank’s 2 percent year-on-year target – even as the unemployment rate fell to 4 percent."
Why did that relationship seemingly break down? Several theories emerged to explain the economic conundrum, Vergara says. One points the finger at globalisation and the influx of cheap manufactured imports from emerging economies; another at ageing populations and the global saving glut. Advancing technology also stands guilty: a TV today with “smart” technology sold at the same price as last year’s version is deflationary. These developments put downward pressure on prices.
But since 2019 the curve has reasserted itself, as inflation spikes to more than 7 percent, and the unemployment rate falls to near record lows of 3.3 percent. Put together the three lines on the above chart, and the pattern is unmistakable.
"Fast forward to 2022, and the Phillips curve looks to be making a comeback," Vergara says. "Stubbornly high inflation expectations and an incredibly tight labour market continue to put upward pressure on wages. Wage growth is yet to peak. It would seem that Bill Phillips’ observation some 60 years ago – that wages tend to rise faster when unemployment is low – can aptly explain today’s (expensive) economic environment.
"Sticking with the Phillips curve, it implies that unemployment would need to rise and the wage-price spiral lose momentum for inflation to return to target (productivity improvements aside). And implicit in their forecasts, that seems to be the route central bankers are taking. They’re tightening financial conditions to loosen labour market conditions – that is, a rise in unemployment."
At the start of Covid, the Reserve Bank and other central banks around the world began injecting more money into their economies as stimulus – known as "printing money". Now, the problem is the other way round, a glut of money and a shortage of workers. "If only we could 'print people'," Vergara laughs.
Some central bankers around the world may have dismissed the Phillips Curve, but Reserve Bank of New Zealand leaders say they were never among them. As we said, Bollard, Governor of the Reserve Bank from 2002 to 2012, literally wrote the book on Phillips.
"When I was running the bank, we had a single objective which was inflation control," he says. "Now, there's a dual mandate of sustainable employment and inflation. A lot of economists think you can see a trade-off in the short term. But it's a bit dubious in the long term whether you can actually do that.
"In a lot of economists' minds it went out of fashion with the monetarist views. And it came back a little bit with Covid. But it's not clear-cut."
"If you're looking at employment, then pretty clearly, you've got to be very close to fiscal policy on that, because a lot of that will come from fiscal policy as well."
Motu Research executive director John McDermott, who was assistant governor of the Reserve Bank from 2007 until 2019, says the Phillips curve has been part of any undergraduate course in macroeconomics for decades now. The more dynamic New Keynesian Phillips curve is part of any graduate macro course.
"If people expect inflation, they will put up prices." – John McDermott, Motu Research
The Phillips Curve is also central to the Reserve Bank macroeconomics model that was last upgraded a decade ago, he adds, and when he was there they regularly updated their copy of the Curve.
"Central bankers should have known all about Phillips' work all along," he tells Newsroom.
Yes, it has faced robust challenges. US Nobel laureate Milton Friedman said 'hold on, what about expectations?'
"If people expect inflation, they will put up prices," McDermott explains.
So economists began using an Augmented Phillips curve, that showed inflation influenced by both unemployment and by inflation expectations.
Then in the 2000s, he says, new Keynesian features added sticky prices and wages – wages and prices that are hard to adjust down. It was embedded in inflation target frameworks to make it useful to central bankers.
In the most recent variant, economists argue the unemployment rate is not such a good predictor of inflation but rather, the ratio of job vacancies to the number of unemployed people helps measure labour market pressure.
"The Phillips curve never went out of fashion," McDermott argues, "but there have been significant developments and improvements. Central bankers should be on top of these developments."
Rise and fall and rise
Princeton University emeritus professor Paul Krugman – another Nobel laureate – discussed the rise and fall and rise of the Phillips Curve in his New York Times newsletter last month.
"Standard macroeconomics relies a lot on an updated version of the Phillips curve," he wrote. "Since the 1970s, almost everyone has assumed that expectations of inflation also play a big role. If the public expects a lot of inflation, as it did at the end of the 1970s, this will push up actual inflation for any given rate of unemployment."
The mystery is that while US unemployment is low, as in New Zealand, it’s roughly the same as it was on the eve of the pandemic – yet inflation is now much higher. Many economists had instead looked to the so-called Beveridge Curve – the ratio of vacancies to the number of unemployed workers – for a better measure of how hot the economy is running.
In the past couple of months, in both NZ and the US, there's been a big drop in job offerings, even though unemployment didn’t rise significantly. "It suggests that the trade-offs may be improving as the economy recovers from Covid disruptions. A high unemployment rate may not be necessary after all.
"Unemployment is still low. But wage increases have been slowing," he concluded. "That suggests some excess underlying inflation, but not all that much."
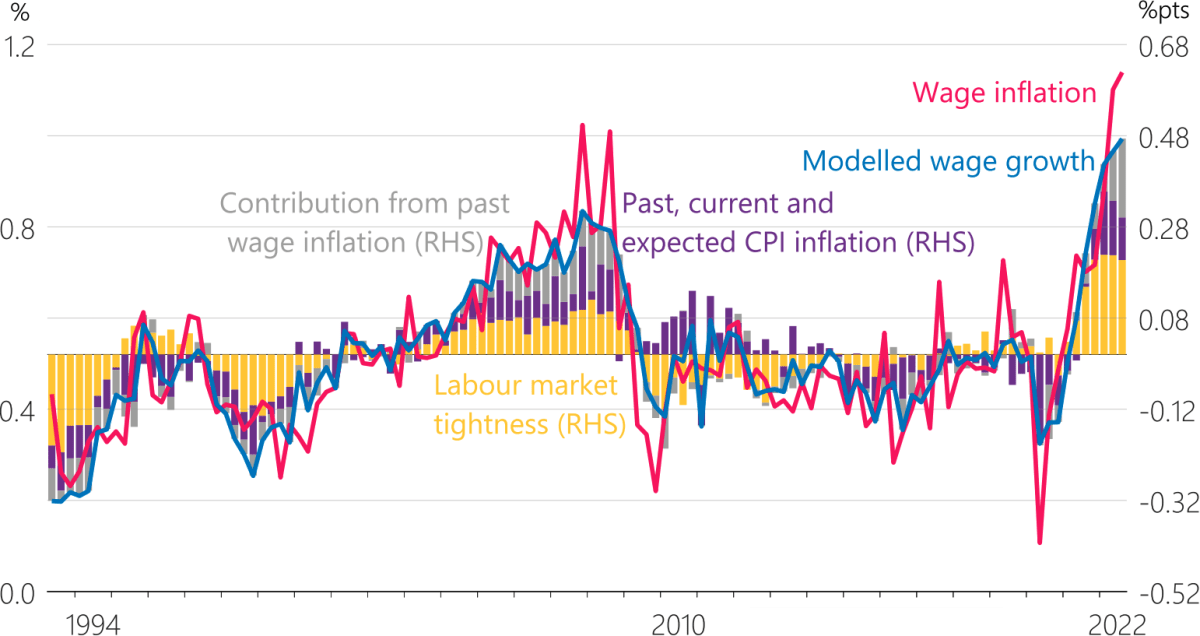
The version of the Phillips Curve (above) used in the new Reserve Bank Monetary Policy Statement last week doesn't plot unemployment on the x-axis – so "curve" becomes somewhat of a misnomer. But the principle is the same: it illustrates the contributions of labour market tightness, CPI inflation and past wage inflation to rising wages in the future.
"A tight labour market and high CPI inflation have outweighed the economic uncertainties from Covid-19 and wage inflation has increased," the monetary policy statement says. "In addition, wage growth tends to be persistent, meaning that recent high wage inflation is contributing more to current wage inflation."
So what does this mean? The Reserve Bank concludes it will take until late 2023 for lagging wage inflation to peak at around 5.7 percent. "As inflation and economic growth slow in line with rising interest rates, demand for labour will ease in the coming years. Higher net migration will also provide some relief to the current labour shortages."
On this basis, the statement says, nominal wage growth should eventually return to long-run average levels around 2024.
'Pretty way-out'
Alan Bollard was an undergrad when Phillips returned to teach at Auckland University. "He wanted to do something totally different, which was study the Chinese economy. This was during the Cultural Revolution. So for an econometrician and modeller like Phillips, this was a pretty way-out thing to do. He actually taught my wife."
Phillips' decision to move from London to Canberra, and then Auckland, and begin serious work on the economics of China, has been hailed as the act of "a profoundly honest man" who wished to continue to earn his living by doing the most socially useful work of which he was capable, rather than being an intellectual retreat on the part of someone with a short attention-span.
Prof David Laidler, from the University of Western Ontario, writes: "Phillips had, after all, learned speak and read Chinese while a prisoner of war, and not many China experts then or now combine this skill with capacities as an economist on Phillips’ level."
But the effects of his war deprivations – he'd spent World War II locked up in a Japanese prisoner of war camp – and a lifetime of heavy smoking had caught up with him.
"He'd had a very big stroke, so he was in a wheelchair," Bollard remembers. "He died later that year, while he was teaching."
Phillips died in 1975, aged just 61. He didn't live to see his "wet weekend's work" again embraced.
