Microsoft Corporation (NASDAQ:MSFT) gapped down 1.7% lower on Monday when the market opened and was falling an additional 1.5% intraday, in sympathy with the S&P 500, which was trading down over 1% lower.
The tech giant is currently trading in a confirmed downtrend, which occurs when a stock consistently makes a series of lower lows and lower highs on the chart.
The lower lows indicate the bears are in control while the intermittent lower highs indicate consolidation periods. Traders can use moving averages to help identify an uptrend with descending lower timeframe moving averages (such as the eight-day or 21-day exponential moving averages) indicating the stock is in a steep shorter-term downtrend and descending longer-term moving averages (such as the 200-day simple moving average) indicating a long-term downtrend.
A stock often signals when the lower low is in by printing a reversal candlestick such as a doji, bullish engulfing or hammer candlestick. Likewise, the lower high could be signaled when a doji, gravestone or dragonfly candlestick is printed. Moreover, the lower lows and lower highs often take place at resistance and support levels.
In a downtrend the "trend is your friend" until it’s not and in a downtrend, there are ways for both bullish and bearish traders to participate in the stock:
- Bearish traders who are already holding a position in a stock can feel confident the downtrend will continue unless the stock makes a higher high. Traders looking to take a position in a stock trading in a downtrend can usually find the safest entry on the lower high.
- Bullish traders can enter the trade on the lower low and exit on the lower high. These traders can also enter when the downtrend breaks and the stock makes a higher high indicating a reversal into an uptrend may be in the cards.
Want direct analysis? Find me in the BZ Pro lounge! Click here for a free trial.
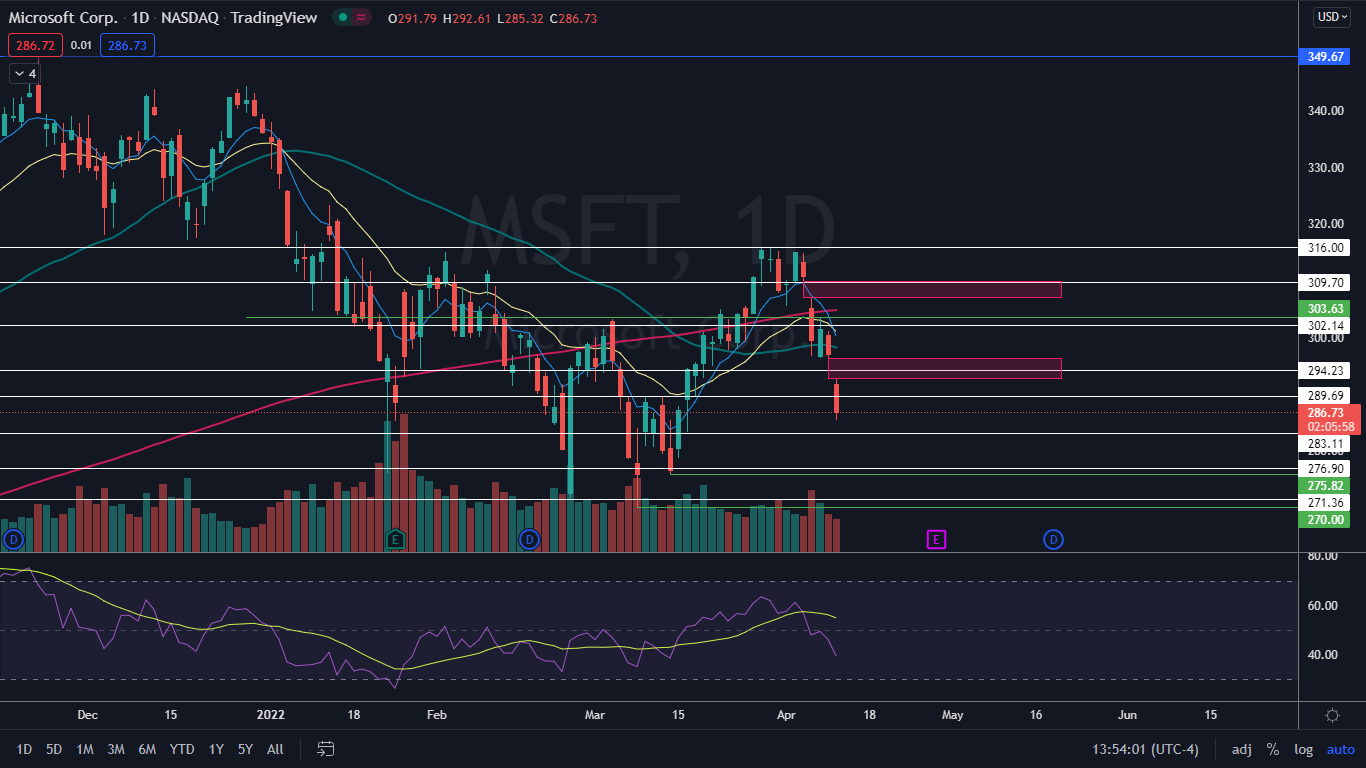
The Microsoft Chart: Microsoft reversed into a downtrend on March 29 after topping out at the $316 mark. Within the pattern, Microsoft’s most recent lower high was printed on April 4 and $315.11 and the most recent confirmed lower low was formed at the $305.54 level on April 1.
Since bouncing up to create the most recent lower high, Microsoft has suffered a steep sell-off, falling almost 10% lower to reach a low-of-day at the $285.32 mark on Monday.
- The lower prices on Monday caused the eight-day exponential moving average (EMA) to cross below the 21-day EMA, which is bearish. The recent sharp decline in Microsoft has also caused the 50-day simple moving average (SMA) to cross below the 200-day SMA, which has caused a death cross to occur and is bearish.
- If Microsoft closes the trading day near its low-of-day price it will print a bearish kicker candlestick, which could indicate lower prices will come again on Tuesday. However, if the stock is able to close the trading day above about $288, it will print a hammer candlestick on the daily cart, which could indicate the next lower low has been printed and the stock will bounce up higher on Tuesday.
- Microsoft’s relative strength index (RSI) is trending downward and is currently measuring in at about 39%. Although the RSI still has room to move lower before becoming oversold, the low number indicates a bounce is likely to come over the course of this week.
- Microsoft has resistance above at $289.69 and $294.23 and support below at $283.11 and $276.90.