
Microsoft Corporation (NASDAQ:MSFT), Nio, Inc (NYSE:NIO) and Snap, Inc (NASDAQ:SNAP) are all trading higher in strong downtrends. A downtrend occurs when a stock consistently makes a series of lower lows and lower highs on the chart.
The lower lows indicate the bears are in control, while the intermittent lower highs indicate consolidation periods. Traders can use moving averages to help identify a downtrend, with descending lower timeframe moving averages (such as the eight-day or 21-day exponential moving averages) indicating the stock is in a steep shorter-term downtrend and descending longer-term moving averages (such as the 200-day simple moving average) indicating a long-term downtrend.
A stock often signals when the lower low is in by printing a reversal candlestick such as a doji, bullish engulfing or hammer candlestick. Likewise, the lower high could be signaled when a doji, gravestone or dragonfly candlestick is printed. Moreover, the lower lows and lower highs often take place at resistance and support levels.
In a downtrend the "trend is your friend" until it’s not and in a downtrend, there are ways for both bullish and bearish traders to participate in the stock:
- Bearish traders who are already holding a position in a stock can feel confident the downtrend will continue unless the stock makes a higher high. Traders looking to take a position in a stock trading in a downtrend can usually find the safest entry on the lower high.
- Bullish traders can enter the trade on the lower low and exit on the lower high. These traders can also enter when the downtrend breaks and the stock makes a higher high, indicating a reversal into an uptrend may be in the cards.
See Also: Kevin O'Leary Says If You Own Google, Microsoft, You Should Hold Bitcoin
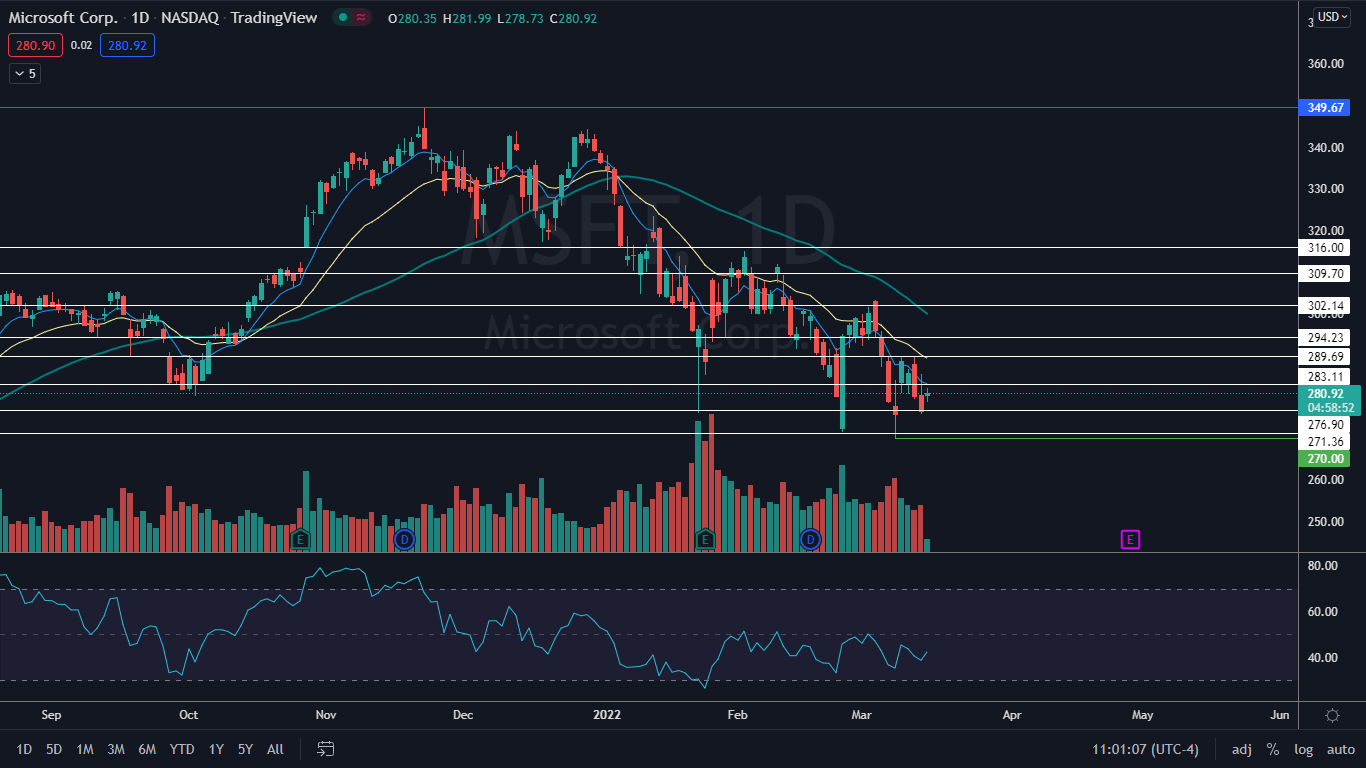
The Microsoft Chart: Microsoft began trading in a downtrend on Feb. 2 and has made a consistent series of lower lows and lower highs within the pattern, with the most recent lower low printed on March 10 at the $270 mark and the most recent lower high formed on March 9 and March 11 at $289.91. The rejection near the $290 level on two separate trading days also formed a bearish double top pattern at that level.
On Tuesday, Microsoft was printing an inside bar pattern on the daily chart, with all the price action within the range of Monday’s mother bar. The pattern leans bearish because the stock was trading lower before the inside bar formed.
If Microsoft doesn’t trade lower on Wednesday to indicate the downtrend is still intact, traders and investors can watch for a symmetrical triangle to develop.
Microsoft has resistance above at 283.11 and $289.69 and support below at $276.90 and $271.36.
Want direct analysis? Find me in the BZ Pro lounge! Click here for a free trial.
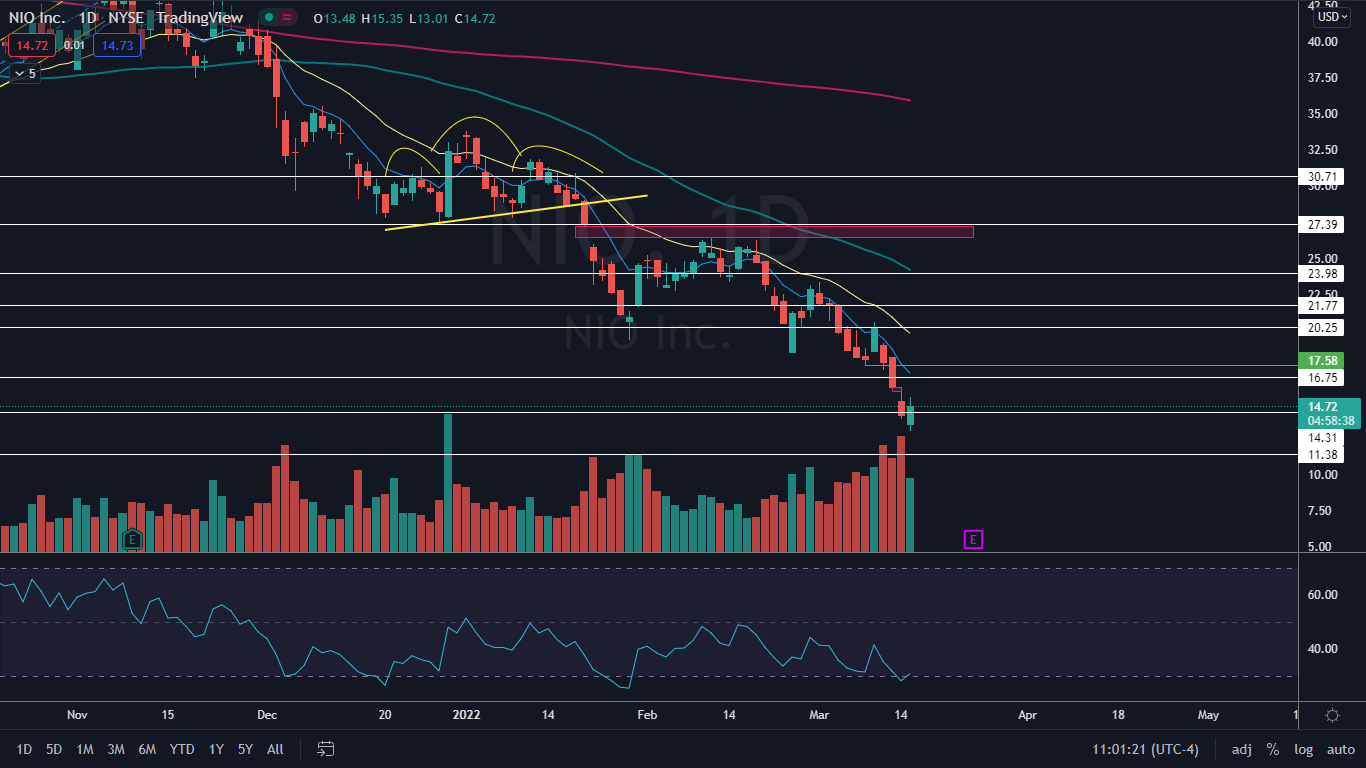
The Nio Chart: Nio was trading up over 7% higher on Tuesday after gapping down to start the trading day, which was the second gap down in a row. Nio has been trading in a downtrend since Feb. 17, when the stock printed a bearish double top pattern near the $26.41 level when paired with similar price action on Feb. 10.
Nio’s most recent lower high was created on March 9 at about $20.70 and the most recent confirmed lower low is at the $17.58 mark and was formed on March 8. In order for Nio to negate the uptrend, the stock will need to rise above the most recent lower high in the near future, or not fall under Tuesday’s low-of-day when the stock prints its next low.
Nio has resistance above at $16.75 and $20.25 and support below at $14.31 and $11.38.
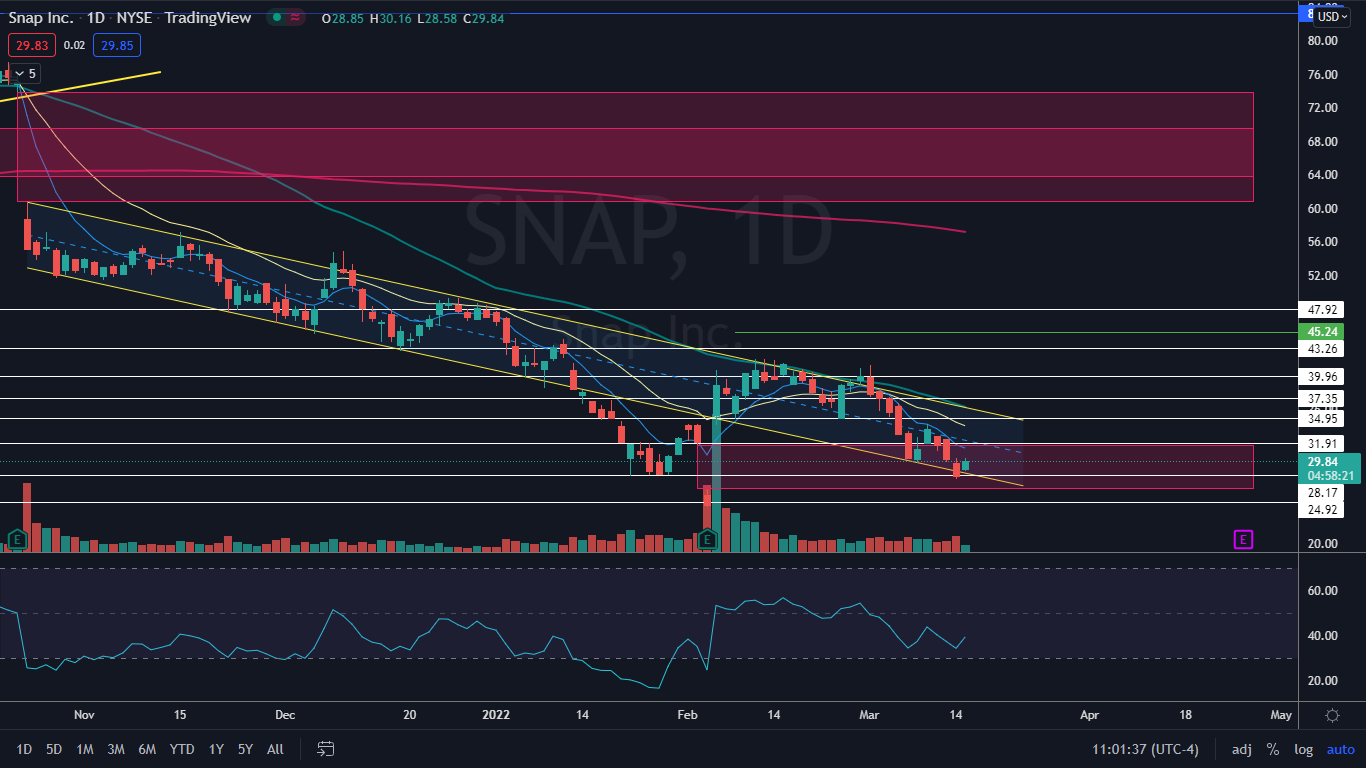
The Snap Chart: Like Nio, Snap was climbing up over 7% on Tuesday, but is still trading in a downtrend. The stock has been making lower lows and lower highs since Oct. 18, 2021 and has been trading in a falling channel since Oct. 22 of last year. On March 14, Snap held above the lower descending trendline of the channel, and Tuesday’s higher prices are likely a short-term bullish reaction to the pattern.
For Snap to form an immediate trend change, the stock would need to rise up above the March 9 high of 34.23. If the stock is able to buck the downtrend and trade back up toward the upper trendline of the pattern, bulls may get another chance at breaking the stock up from the channel.
See Also: Why Alibaba And Nio Are Seeing High Interest From Retail Investors Today