There are threats we can see, but true danger lies in threats that don't announce themselves — a drop in temperature or unhealthy pollutants, for example. When dealing with something as unpredictable as space, awareness of your surroundings is key.
When surveying in inhospitable locales, tracking the purity of our breathable air is vital, in the future and today. You don't have to be an engineer or Space Force Guardian to be invested in the air we breathe, so we teamed up with the United States Space Force to create a video series of STEM challenges you can complete with a little know-how. In our first episode, we'll show you how to build a device that could be used to measure CO2 and track unhealthy airborne contaminants. Here's what you need to start as a citizen scientist.
What you need:
Raspberry Pi single-board computer with Raspberry Pi OS installed
5V, 3 amp power supply
SD card
4 Qwiic I2C cables
A small screen to display the graphed sensor data
A computer capable of writing to the SD card
A soldering iron
A handful of sensors to measure different types of air quality
The sensors above can detect particle count, CO2, temperature, and humidity. You don't necessarily need all of them, but we wanted to provide the full set of options.

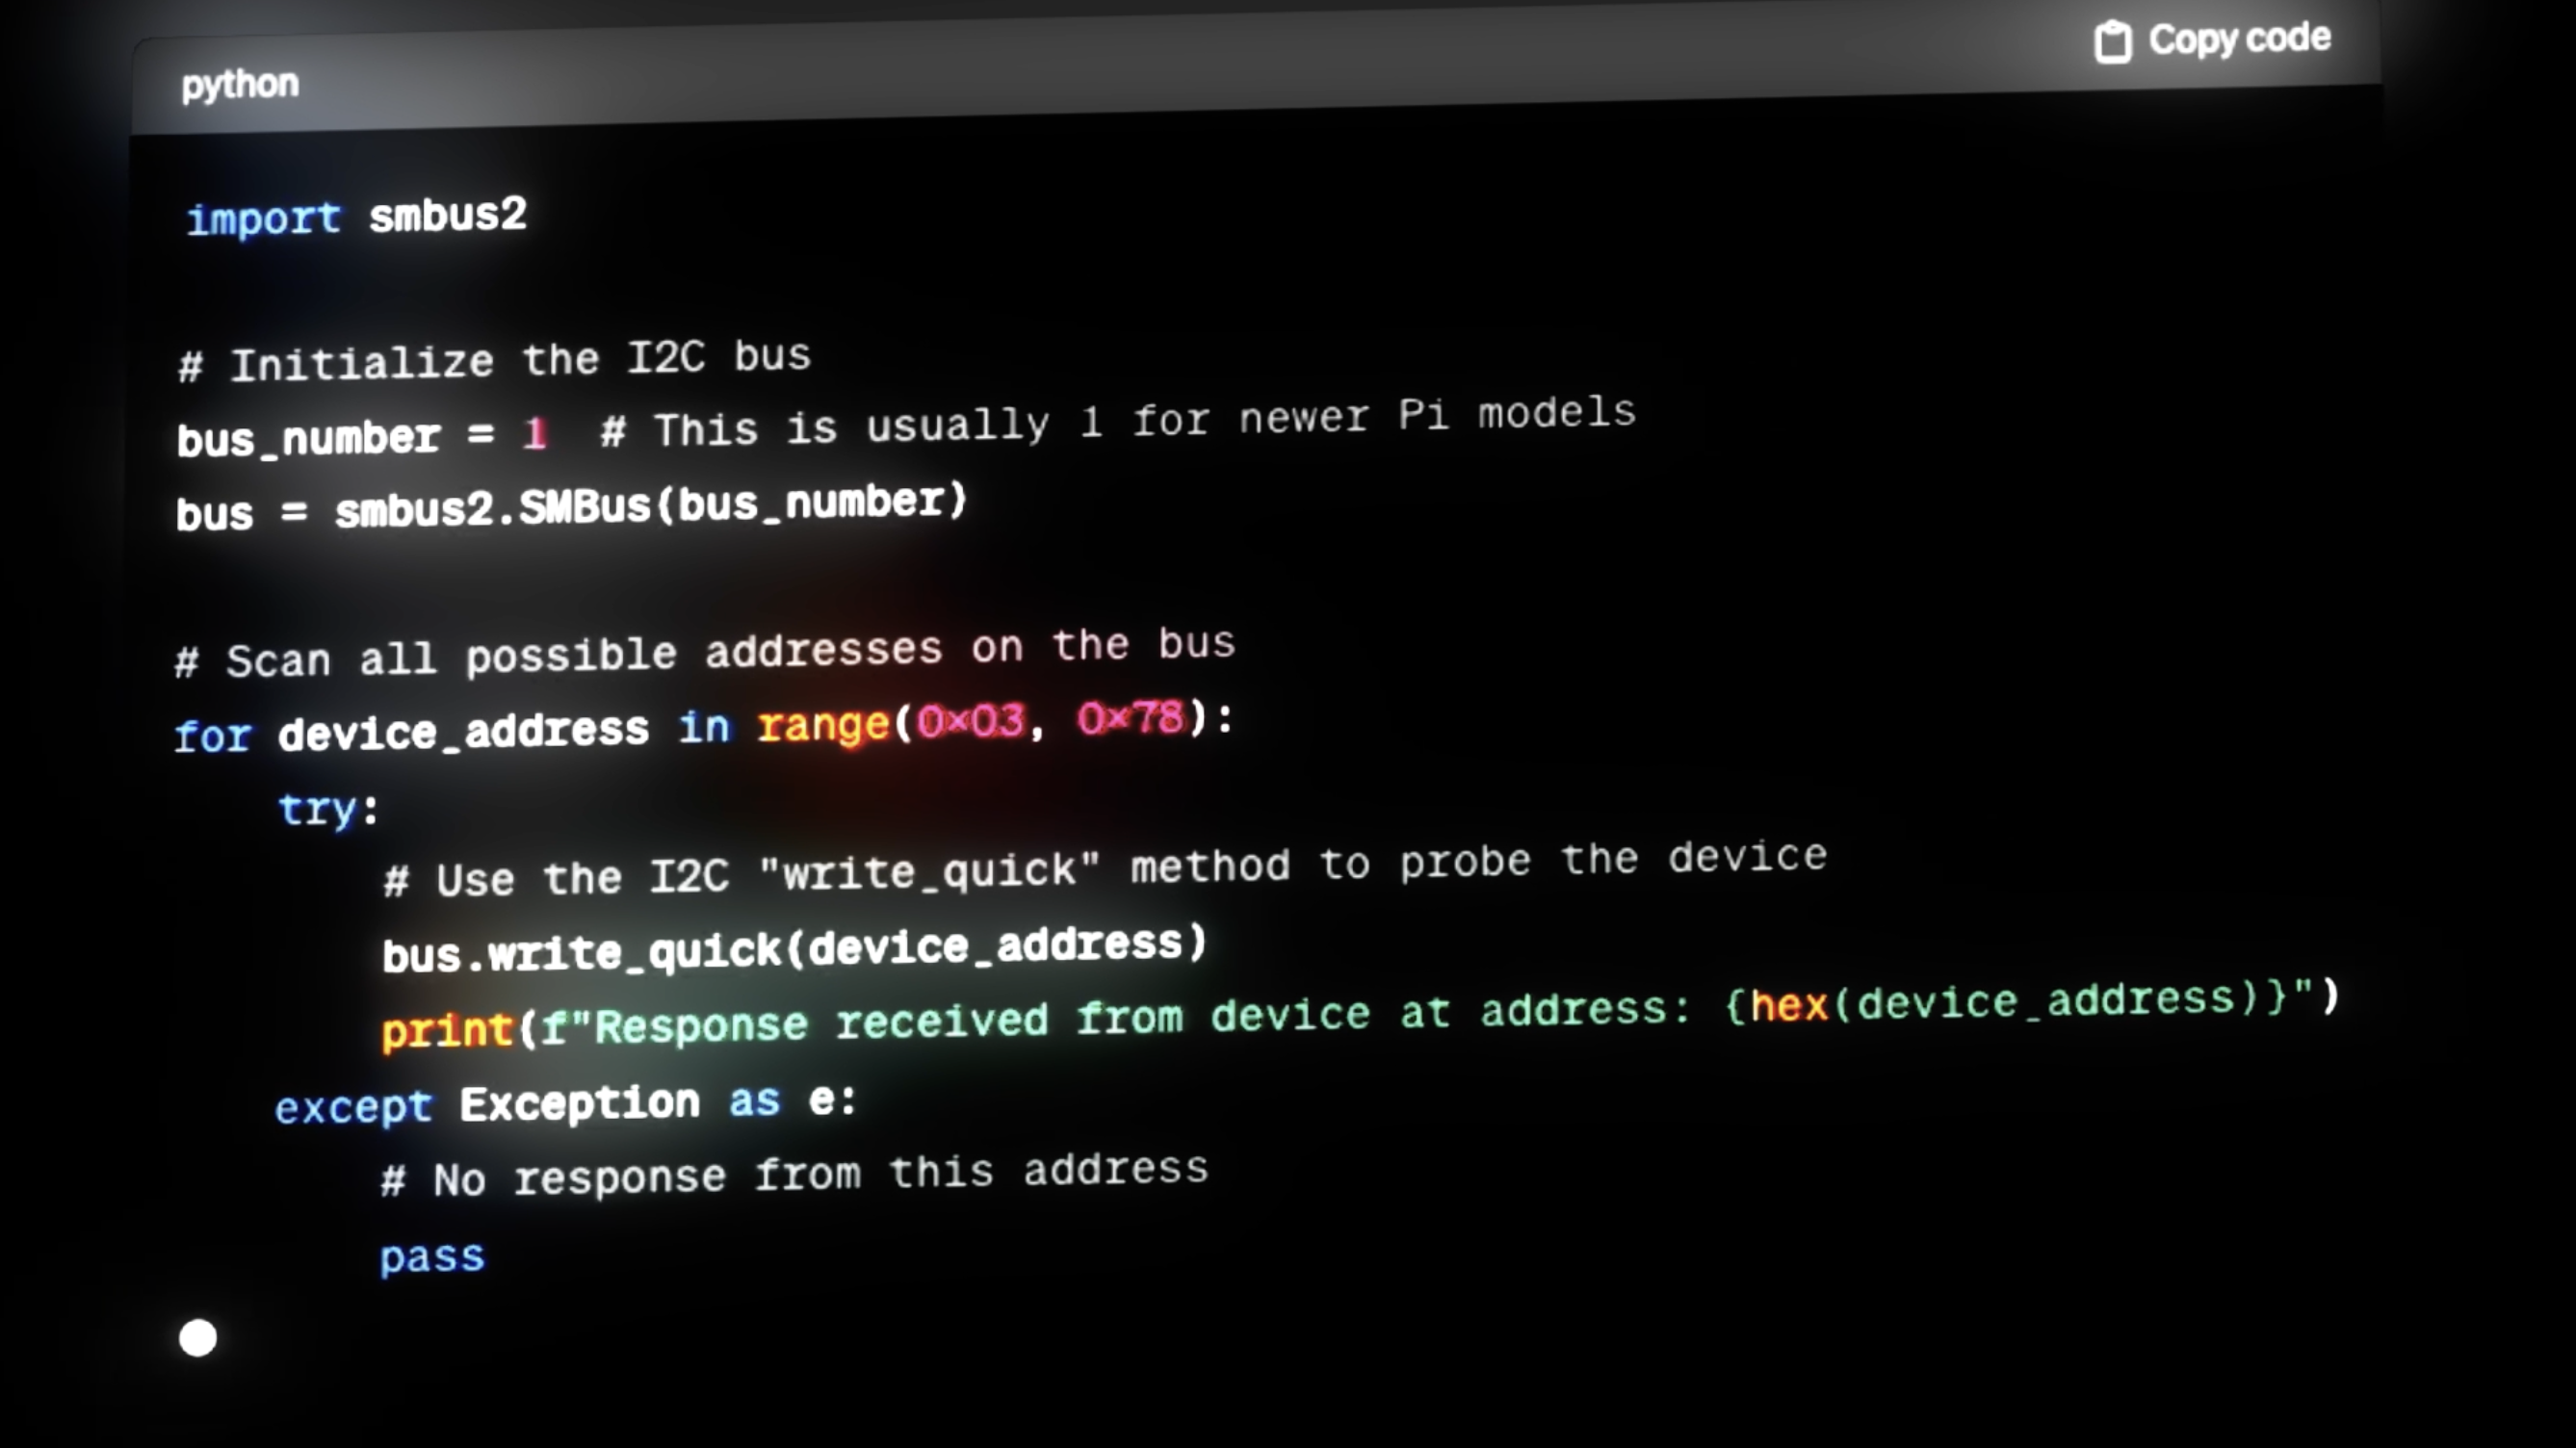
Python is the programming language of choice for this task since there are already so many existing libraries for communicating with sensors and peripherals. We have a step-by-step breakdown of instructions, information on installing the OS on your Raspberry Pi, and the script we used at this link.
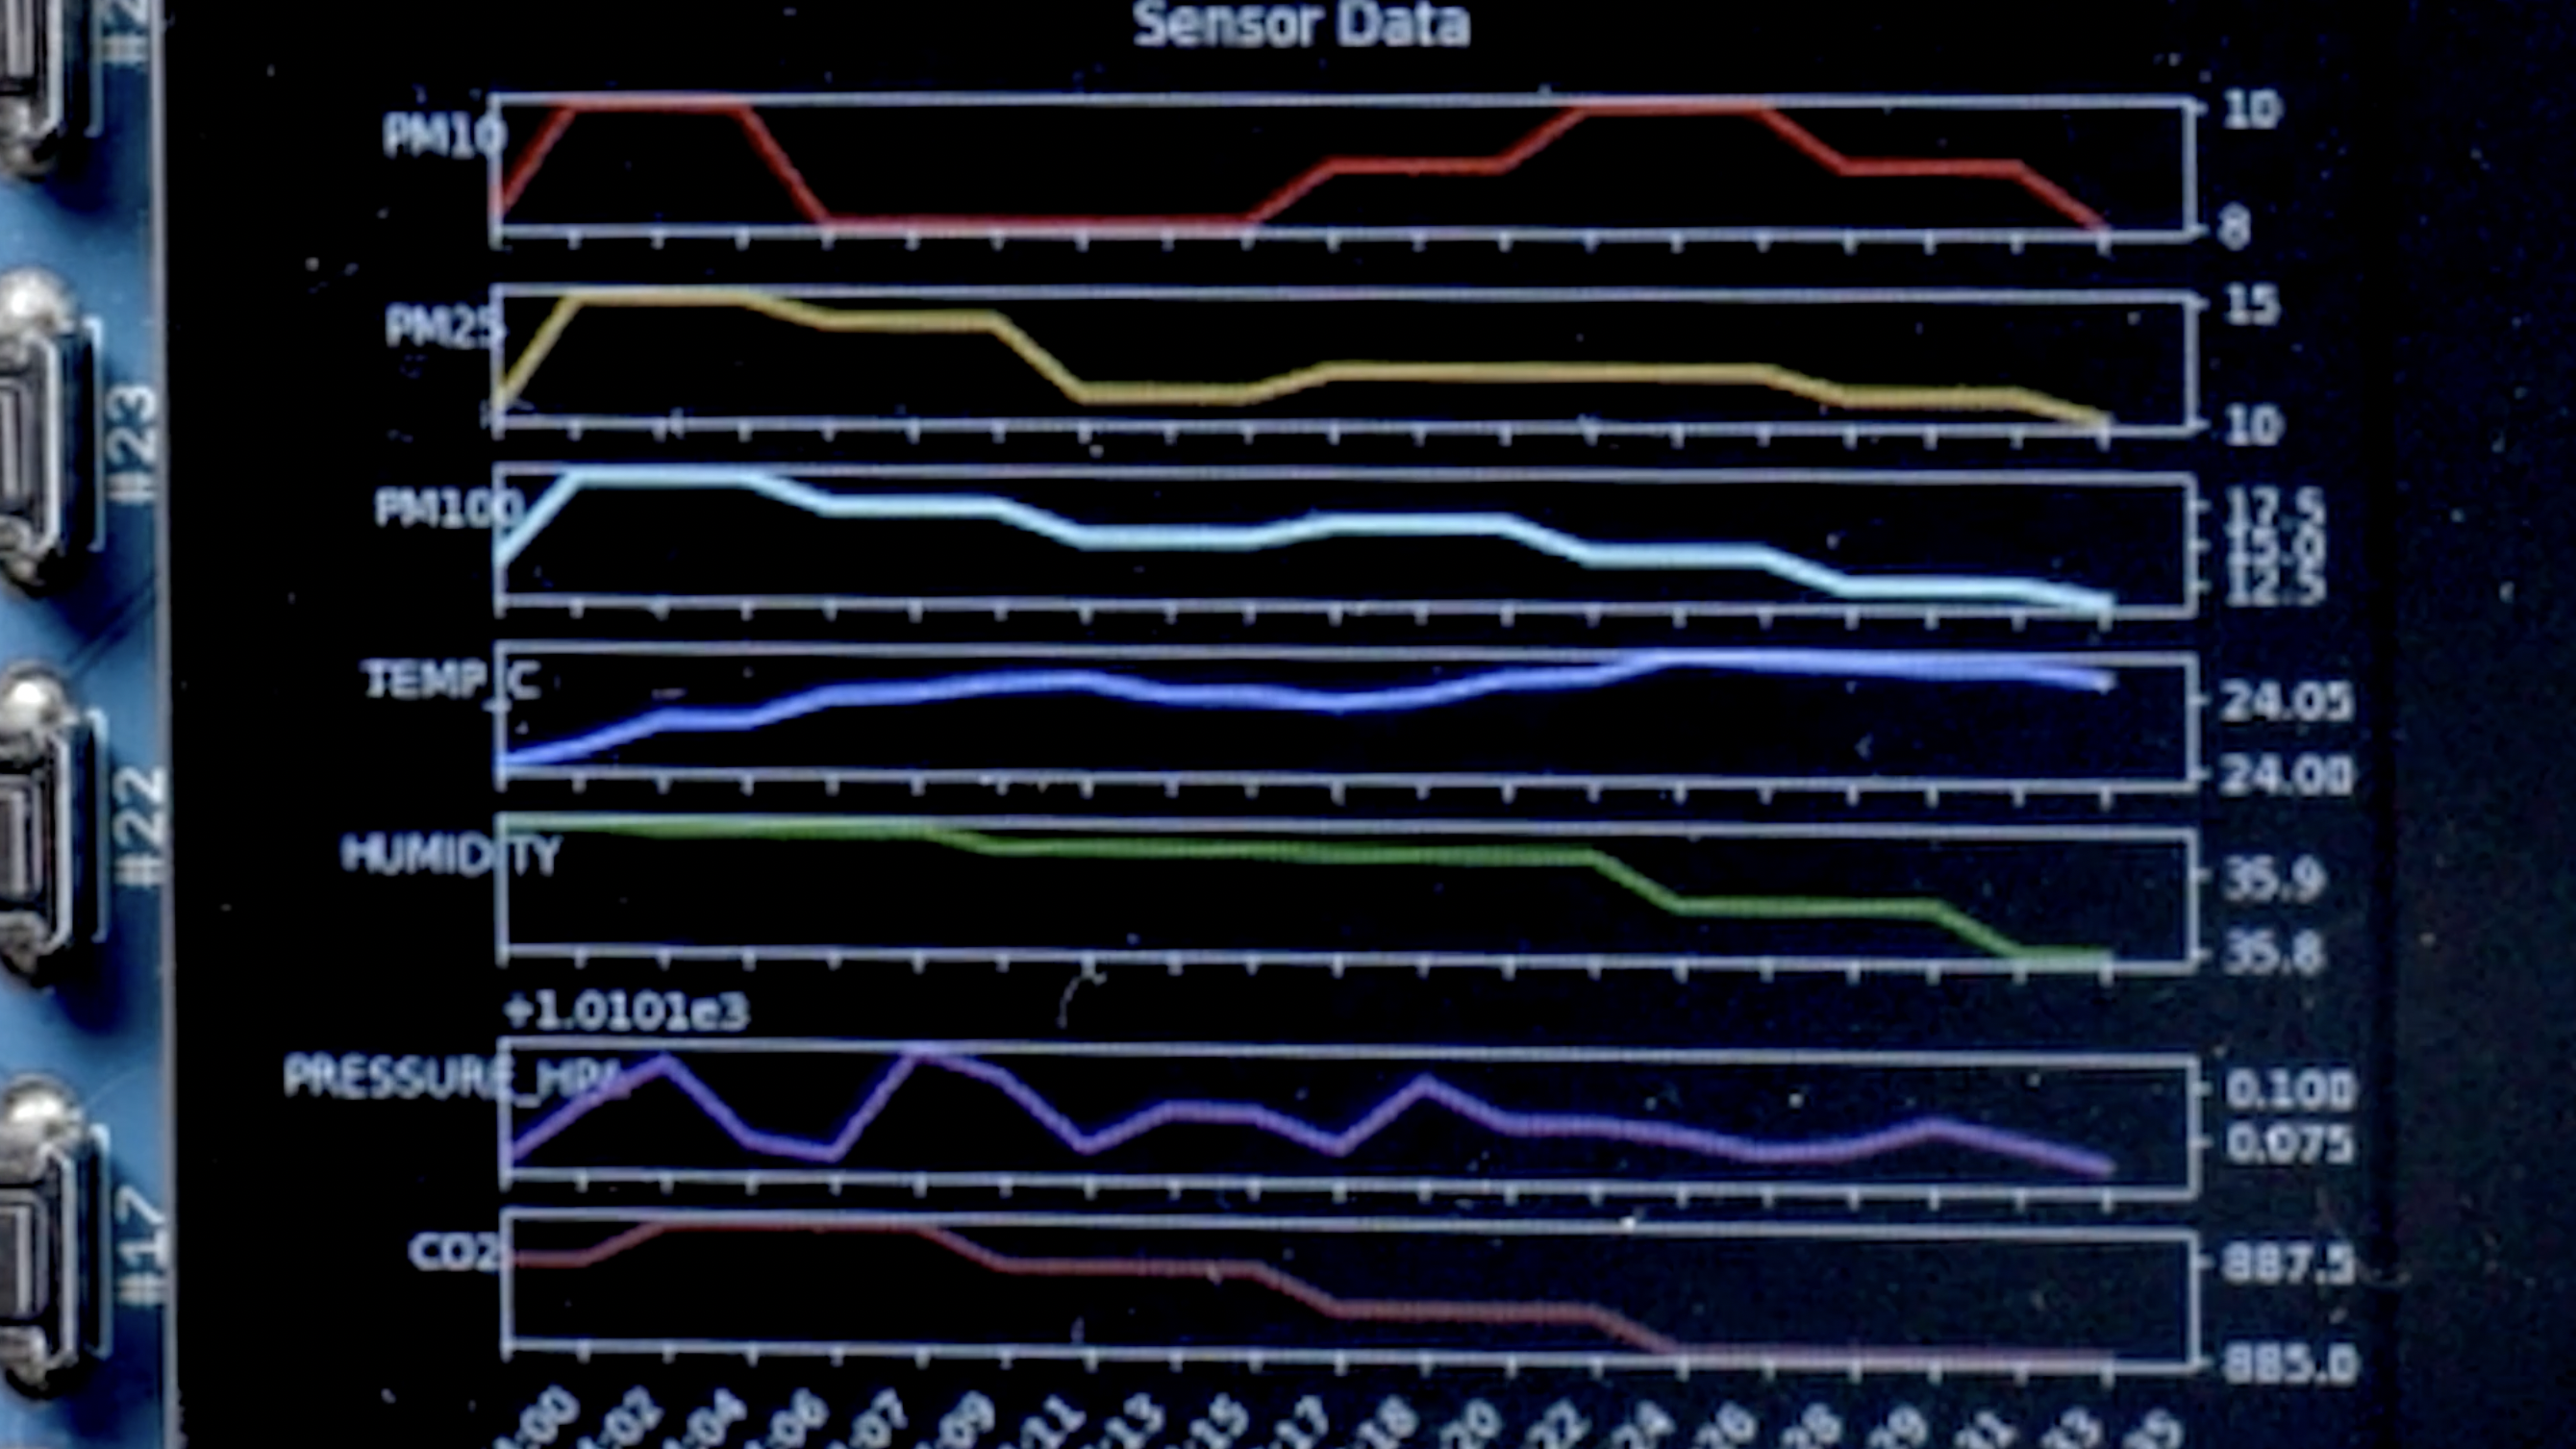
After we get the sensor data, we can log it to a file, graph it, set up alerts based on threshold values, and more. In our video, we display a graph that represents an hour's worth of readings from all sensors, and we change the color of the graph based on values we set as "warnings" and "critical." For instance, if the CO2 concentration goes above (x), the graph will turn red to show that it's at unsafe levels.

Mission Complete
A little bit of technology can open up a universe of discovery. This data could be used to trigger air purifiers or open vents to clear out particulates. You probably have ideas for this data that we can't even imagine. Remember, the skills you're honing here are necessary for many jobs. STEM abilities aren't just highly coveted — they're fun.
Being a citizen scientist can be the first step to a career as a Guardian. Some gaze into space with awe and see only the void, but others look up and see nothing but possibility. Salute, and see you next time.


