Watching the Tour de France from the comfort of your own home, many of us have questioned if it'd be possible to ride the race ourselves. The world's best cyclists at peak fitness can make it look almost too easy at times, which could lead to a skewed perception of how hard the Tour really is.
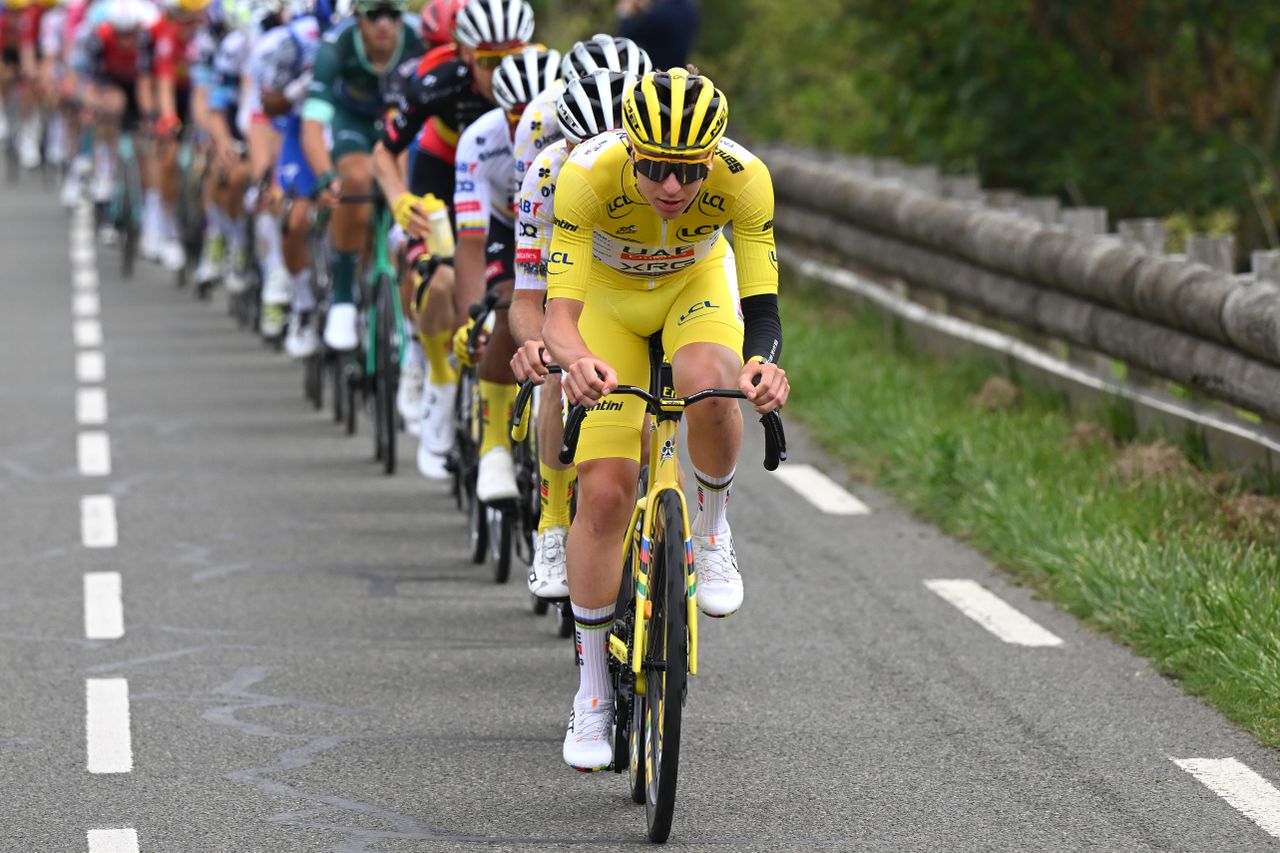
Deep down, we are all very well aware that the race is lightyears away from a Sunday coffee ride with your local cycling club; otherwise, we’d all be lining up at the start. But when you watch the likes of Tadej Pogačar (UAE Team Emirates-XRG) powering up an Alp, it’s hard not to feel inspired.
It's a logical step to then wonder how we might compare, and whether we could keep up with the pro peloton, especially on those easy sprint days when the commentators continually remind us they're "taking it easy." Any cyclist who is familiar with power numbers such as watts per kilo, FTP, and so on, will likely have wondered at some point how their numbers would stack up when compared with Mathieu van der Poel (Alpecin-Premier Tech) and co.
The questions on our minds often boil down to just one: How hard is the Tour de France?
Spoiler alert: it’s hard. Very hard. Of course it’s hard, it’s the Tour de France, arguably the pinnacle of any pro rider’s career. What we really want to know is 'how hard?'
Over the course of this article, we will try to quantify just that: how hard the pros work during the three-week race and compare that, roughly speaking, with the efforts we mere mortals are capable of.
To provide you with meaningful answers, we dove into race road books from the last few editions of the race, dug through the power files of some of the riders to try and fathom their efforts, along with taking a look at their recovery files to gauge the relative strain that their bodies endure. Then, we gathered data from the general public – 'normal' cyclists such as you and I – in an attempt to gain some perspective on the difference.
The terrain
On the 2026 Tour de France route, riders will cover 3,333km (2,071 miles), a fairly typical distance, although the Tour has been much longer, maxing out at 5,745km (3,570 miles) in 1926.
Put plainly, if you were to get in a car in New York and head west, that distance would get you as far as Salt Lake City. If you were to get onto a plane in London, you could get to Paris and back again five times. If you were in Australia you'd make it from Melbourne right over to Perth on the western coast.
Throughout this distance, riders face a whole host of climbs, from small hills to enormous mountain passes. Overall, there are more than 54km of altitude gain across the 2026 Tour’s 21 stages. That’s the equivalent of climbing Mount Everest six times from sea level.
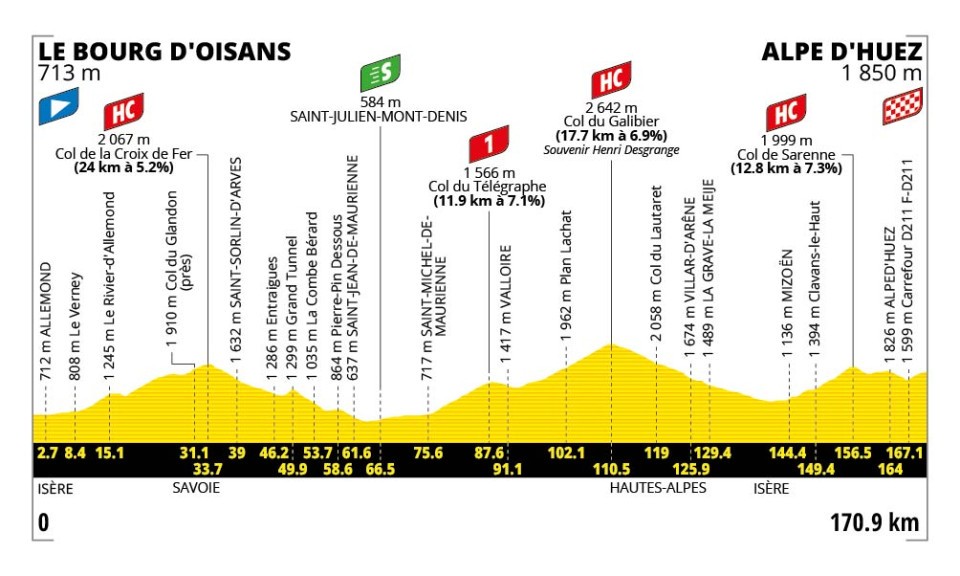
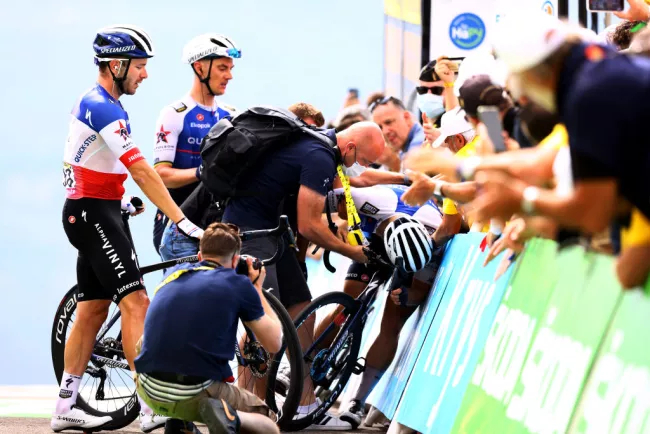
The climbs included the 1,120m climb of Alpe d’Huez on stage 19, where it’s not just the altitude gain that riders have to contend with, it’s the fans too. The next day, they'll climb Alpe d'Huez from the other side, with the 2,642m Col du Galibier thrown in for good measure, on a day with 5,500m of altitude gain.
It's 'only' 3,500m from Everest Base Camp to the summit of Everest, while at the top of the Galibier the altitude means that the effective oxygen concentration is around 75% of that at sea level.
In addition, while it's easy and obvious to focus on the difficulty of going uphill, there's a level of difficulty involved in coming down the other side too.
For us average Janes and Joes, coming downhill might seem like the easy part – you can often stop pedalling and simply let gravity do the work – but let's not forget these riders are in a race so will be sprinting out of corners and pushing the limits of physics to go as quickly as possible, which in itself takes an enormous amount of mental energy and focus.
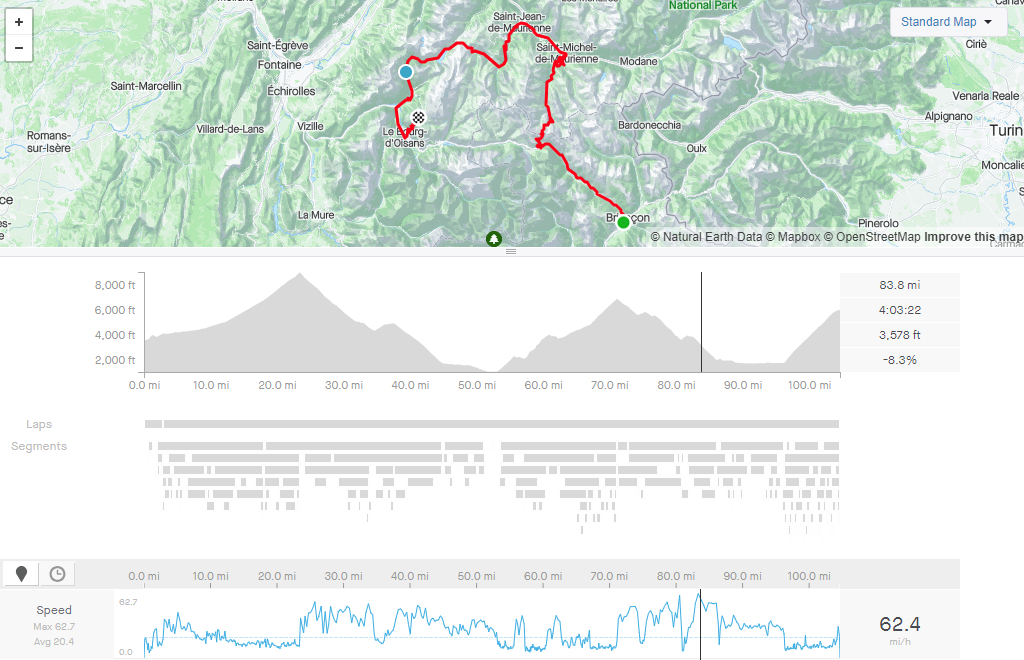
Tom Pidcock established himself as a demon descender with his jaw-dropping descent of the Col Du Galibier that he executed on the way to a solo win atop Alpe d'Huez on stage 18 of the 2022 Tour. Even four years later, it’s still remembered as a descending masterclass, where he was leaving other pros in his wake.
According to Pidock’s Strava data, the maximum speed he hit during that stage was 62.7mph (100.91kph), although he actually clocked his maximum speed later in the stage on the descent of the Croix de Fer / Glandon. He also hit a huge maximum cadence of 200rpm during the stage. Descending like this takes a large amount of skill and concentration, it is hard to begin to imagine the amount of focus this requires and the cognitive load it creates.
The training
The Tour de France is ridden by the world's best road cyclists, all of whom are full-time professionals that ride for around 20 to 30 hours per week. But wait, before you quit your nine-to-five job and start cycling all day, know that these riders aren't just riding their bike for fun, they are completing highly tailored structured training programs designed by some of the best physiologists and coaches in the world.
Sadly, even if we did have that expertise at our disposal, most of us still couldn't quit the day job, because professional cyclists are also blessed with the right mix of genetic potential that enables them to respond to such a high training stimulus and recover quickly enough to go again the next day, day after day, week after week.
To try and quantify this, we reached out to TrainerRoad – a popular training-based indoor cycling app turned all-around training platform that boasts a dataset of over a million users – to get a sense of the amount of structured training that the 'average' cyclist tackles.
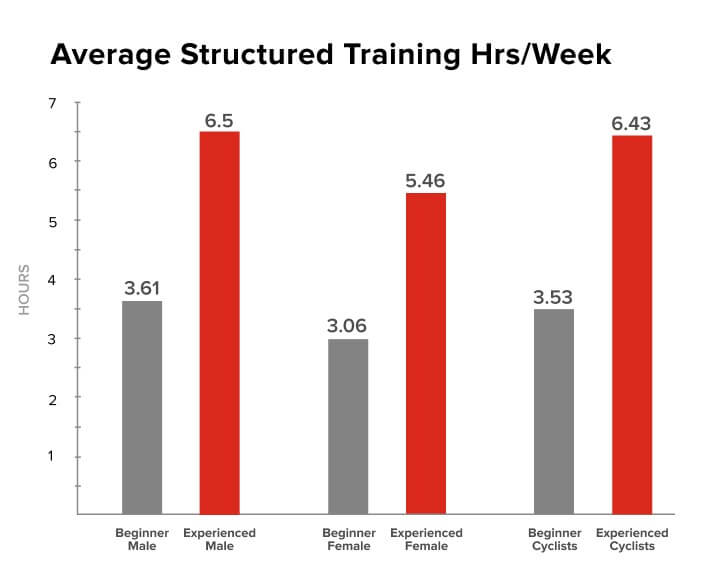
According to TrainerRoad's data, an average 'beginner cyclist' completes 3.53 hours of structured training per week, split at 3.61 hours for men and 3.06 hours for women. While 'experienced cyclists' perform 6.43 hours per week (6.5 hours for men, 5.46 for women).
What this means is that your average beginner is doing just 10% of the training hours of a Tour de France cyclist.
The time cut
To complete the Tour de France, you cannot simply commit to finishing the route, you'll need to do so within the constraints of a time cut on each stage.
According to rule 2.6.032 of the UCI rulebook, exactly what that time cut will be is defined as follows:
"The finishing deadline shall be set in the specific regulations for each race in accordance with the characteristics of the stage.
“In exceptional cases only, unpredictable and of force majeure [unforeseeable circumstances], the commissaires panel may extend the finishing time limits after consultation with the organisers."
So in layman's terms, the organisers will decide the time cut based on the difficulty of the stage. We won't go into the details of how they then calculate it, but depending on the difficulty of the stage and the pace of the fastest rider, it will usually be the winner's time plus anything between 4% and 18%, with the latter figure for the hardest mountain stages.
To turn that into an example, if a stage took the winner exactly four hours to complete, the time cut would be anywhere between 9m 36s and 43m 12s later.
This essentially means that to complete the Tour de France, you need to not only finish the route, you need to be able to do so within a percentage of the winner's time, which leads us nicely onto speed.
The speed
In trying to work out how hard the Tour de France actually is, you will need to know what speed you'll need to be able to ride in order to keep up. The 2025 edition of the Tour was the fastest in the race's history, with winner Tadej Pogačar averaging 43.44kph over the race’s 3,302km.
Even if you're not vying for a win, and you're simply trying to make it to the finish line within the time cut, you'll still need to maintain a very high pace. Last placed rider in 2025, Simone Consonni, who finished 160th, still averaged over 40kph.
Anyone who has ridden a local time trial will know that it's difficult to maintain this pace for 10 miles, let alone the 2,000-plus miles covered in the Tour.
However, of course, anyone who's ridden in a group will also know that there's an enormous benefit from drafting. That is, of course, until the road points up and gravity does its best to slow you down.
On that same 2022 stage where Pidcock clocked over 100kph descending, he climbed Alpe d’Huez at 20.4kph to win the stage. The record speed on the Alpe is still that set back in 1997 by Marco Pantani: 23.08kph.
The power
A commonly used and widely understood assessment of a rider's ability is FTP, or Functional Threshold Power, which is defined as the maximum amount of power that a rider can sustain for an hour. It is often tested with a sustained 20-minute effort, with the average power from this effort multiplied by 0.95.
Measured in watts, this can be quoted as an absolute figure, or in 'watts per kilogram' where the absolute figure is divided by the rider's weight. So for example, a 75kg rider with an absolute FTP of 300 watts would have a weight-adjusted FTP of 4W/kg.
Remco Evenepoel’s coach recently revealed in a YouTube video of a training day at altitude posted by Evenepoel that his FTP – a number the pros normally keep closely under wraps – was 425 watts. At his 63kg published weight, that works out at 6.74W/kg.
That figure tallies with the 6.5W/kg number revealed in 2022 by his then boss Patrick Lefevre. In the same YouTube video, Evenepoel reveals that he’s underfuelling, aiming to drop his weight ahead of the Tour.
Unlike Evenepoel, his main rivals are keeping their numbers under wraps, but Pogačar's FTP has been estimated at 430 watts. His stated weight is a little greater than Evenepoel’s though at 66kg, which would give a 6.5W/kg value.
Both could be bested by Jonas Vingegaard though. His published weight is 58kg and his power to weight has recently been estimated by Lanterne Rouge at 7.38W/kg.
For a reference of just how good this is, anyone who's spent time racing on Zwift may be familiar with the five Zwift Power categories (A+, A, B, C and D). A+ is the highest here, and to get yourself into this category, you'll need an FTP of 4.6W/kg.
Look out for the first mountain showdown to see who’s top dog among this year's contenders. With none of the three taking to the start line of the same race so far this summer, it will be the first time they go head-to-head.
To compare these numbers to an average cyclist, we went back to TrainerRoad, who supplied the average FTP of its entire database.
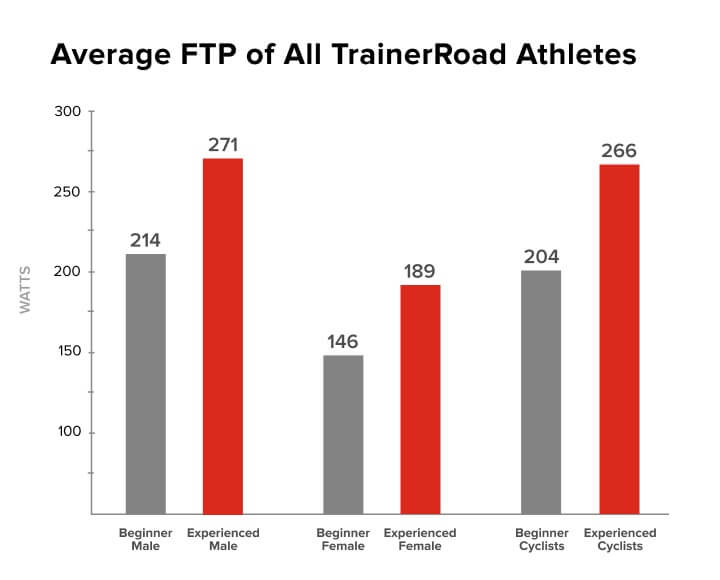
- Male beginners, the average FTP sits at 214 watts (2.81W/kg)
- Experienced male cyclists, the average jumps to 271 watts (3.75W/kg)
- Female beginners, the average FTP sits at 146 watts (2.45W/kg)
- Experienced female cyclists, the average jumps to 189 watts (3.25W/kg)
- All beginner cyclists combined, the average FTP sits at 204 watts (2.75W/kg)
- All experienced cyclists combined, the average FTP sits at 266 watts (3.72W/kg)
That means Pogacar's 430W FTP is around 50% better than the average experienced cyclist (266W), and more than double that of the average beginner cyclist (204W).
Of course, beyond this simple metric, there are a lot of other factors at play too. Not least fatigue resistance, which is the ability to output the same high power numbers at the end of a long day or at the end of three weeks of back-to-back racing.
The energy
To maintain all this effort, a rider needs to eat. A lot.
It's estimated that a rider needs to consume between 5,000 and 8,000 calories a day, dependent on the stage profile. Even on the most conservative figure, that's over 100,000 calories over the three weeks of the race, equivalent to over 400 Big Macs or around 20 a day.
Keeping that level of energy expenditure up also requires training – for your gut. For a long time, it was thought that around 60g of carbohydrates per hour was the maximum that you could absorb.
But gut training and a mix of different sugars has allowed pros to double that, while there are reports of some riders managing to take in over 200g/hour. Try that at home and you’d probably throw up. Or get obese very quickly.
That huge level of energy intake allows a high level of energy output for the multi-hour duration of a stage, which is thought to be a major factor in the ever-increasing speeds at which the Tour is ridden.
So how hard is it for the professional riders?
By now we have a pretty good idea of just how hard the Tour de France is, but these are professional athletes, they're the best road racing cyclists in the world and this is their job. So while it might be an impossible task for us mere mortals to even consider getting round, surely it's just another day at the office for them. Not exactly.
To quantify this, we reached out to Whoop, makers of a wearable wrist strap that uses an optical heart rate sensor to continuously monitor heart rate and heart rate variability to quantify various metrics.
For those interested in how this works, Dr Stephanie Shell, a Senior Physiologist specialising in recovery at the Australian Institute of Sport explained the science a little more as part of our Whoop 3.0 review but put simply, it uses these metrics to allocate a 'strain' and 'recovery' score. Both are calculated using proprietary Whoop algorithms, and strain is scored out of 21, while recovery is scored as a percentage out of 100.
Whoop duly shared data for a number of its riders on various stages in the 2021 race. The most complete of these datasets is for time trialling specialist Stefan Bissegger.
Looking at his data, we're able to see how these algorithms rate the difficulty of Bissegger's days in comparison to his own baseline, thus quantifying how hard the days must be for Bissegger himself.
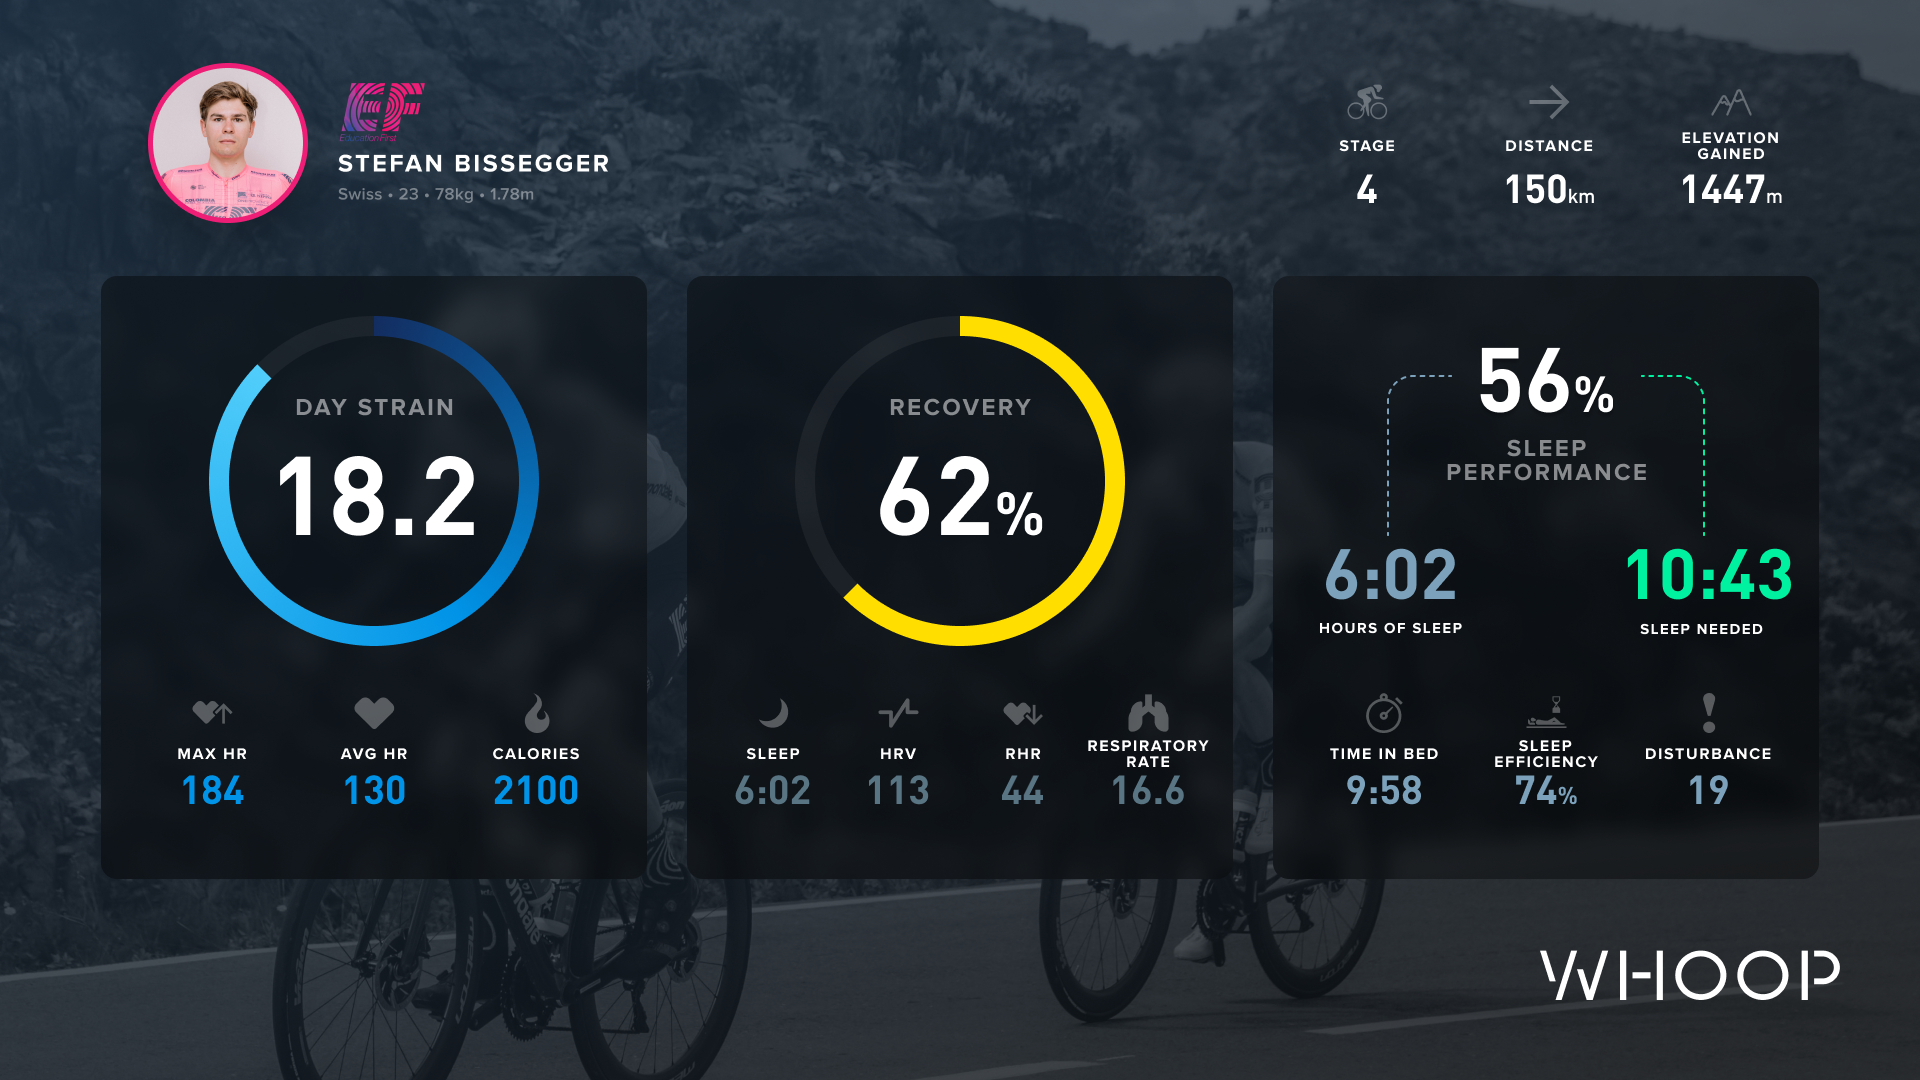
The data here is threefold, covering strain, recovery, and sleep performance data.
Across the nine stages for which we have data, Bissegger didn't have a day with a strain score below 17.4, with all of stages 9 to 13 scoring above 20 out of 21. This suggests that even for him, racing the Tour de France put his body through extreme strain.
Alongside this, his recovery ranged widely. His lowest score was 30%, with his highest being 81%.
Conclusion
All in all, it's safe to conclude that the Tour de France is truly brutal in its difficulty. It's well in excess of the capabilities of the general public and still beyond the reach of experienced, trained cyclists. Even for many of the professional athletes who start the Tour de France, actually finishing it is an altogether different proposal. Last year, 24 out of 184 starters abandoned the race, principally due to sickness or injury.
For those who do make it to Paris, even hours behind the winner, it's an achievement that places them in the highest echelons of the sport.
After the Tour, riders report feeling utterly drained physically and mentally for the next few weeks, but often find that, when they get back on the bike, they’re recording some of their best performance statistics ever.