Alibaba Group Holdings, Ltd (NYSE:BABA) was trading flat on Tuesday after plunging over 9% on Monday on a report China has fined the e-commerce and tech giant for failing to comply with anti-monopoly rules.
Recently, China looked to be easing its regulatory crackdowns on its home-based big tech companies in order to strengthen its economy, which spurred gains across China’s beaten down tech sector. Alibaba skyrocketed 61.31% between May 12 and July 8 after plummeting 75.57% from its Oct. 27, 2020 all-time high of $319.32.
Sunday’s report, that China’s State Administration for Market Regulation (SAMR) had published a list of 28 deals that violated anti-monopoly rules on the disclosure of transactions, five of which Alibaba was involved in, indicates the Asian country’s tech sector is far from being in the clear.
However, Alibaba may be in for at least a bounce, due to the daily candlestick the stock was working to develop on its chart.
Want direct analysis? Find me in the BZ Pro lounge! Click here for a free trial.
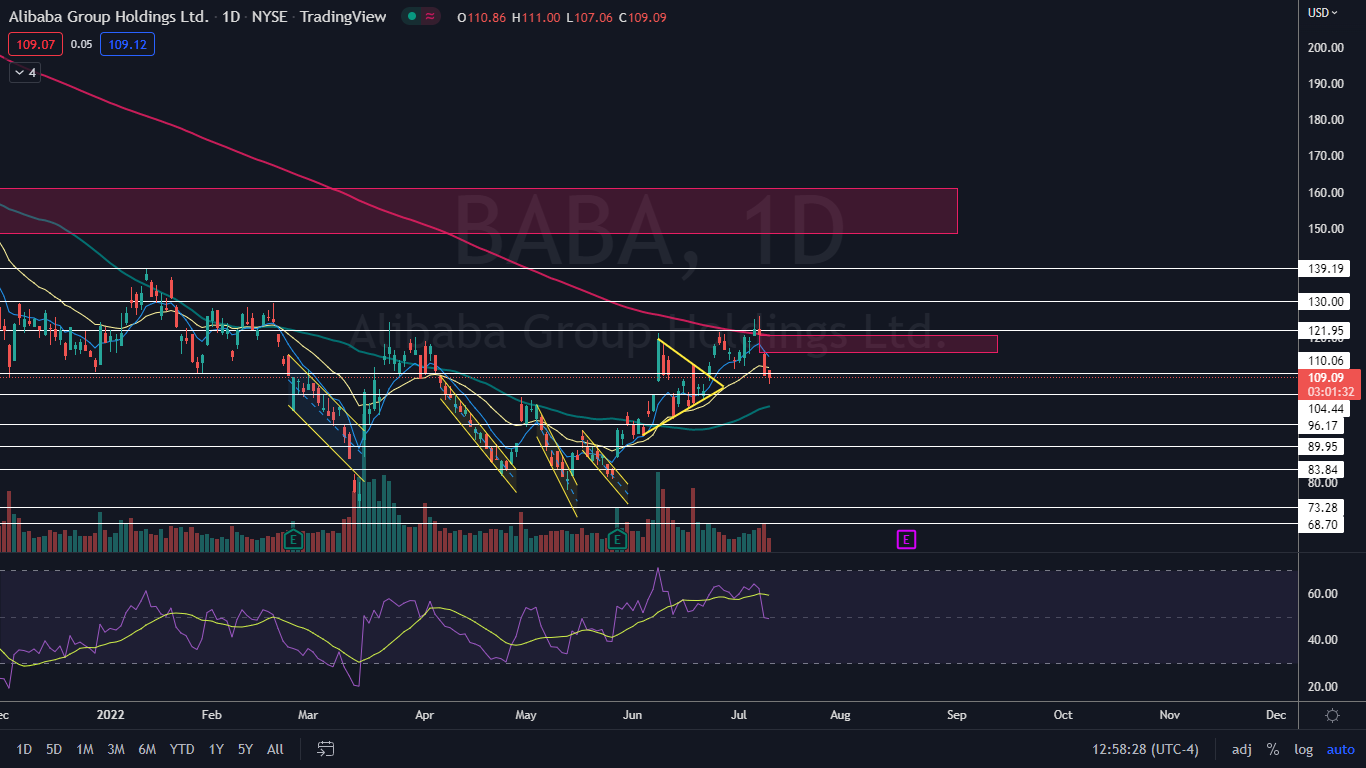
The Alibaba Chart: On Tuesday, Alibaba was working to print a hammer candlestick on the daily chart, which is often formed at the bottom of a trend and can indicate a bounce to the upside is on the horizon. It should be noted that candlestick patterns should be used in conjunction with other indicators for a higher level of predictability.
- Bullish traders may choose to look at Alibaba’s trading volume, which on Tuesday was declining, indicating consolidation was taking place after Monday’s sharp decline. This makes the prospect of an impending bounce more probable. At press time, about 15 million Alibaba shares had exchanged hands, compared to the 10-day average of 20.85 million.
- Alibaba has multiple gaps on its chart, with the closest upper gap falling between the $115.58 and $120.70 levels. Gaps on charts fill about 90% of the time, which makes it likely Alibaba will rise up to fill the empty trading range in the future.
- Although Alibaba negated its uptrend on Monday, when the stock fell below the most recent higher low, which was printed on June 30 at $111.38, a downtrend has yet to be confirmed. If Alibaba bounces up over the coming days to fill the gap, traders and investors can watch to see if Alibaba prints a bearish reversal candlestick under the most recent higher high or whether the stock rises up above that level to indicate this week’s lower prices were a bear trap.
- Alibaba has resistance above at $110.06 and $121.95 and support below at $104.44 and $96.17.
See Also: Alibaba, Zoom Video And 76 Biggest Movers From Yesterday
Photo: Courtesy of alibabagroup.com