Oracle (ORCL) stock traded higher Monday night and this morning before the open after the software stalwart reported fiscal-first-quarter earnings.
Those premarket gains have turned mixed. Oracle stock opened lower on Tuesday, turned positive and traded as high as 3% at one point. It's now down almost 1% in the session.
The market is under pressure due to a hotter-than-expected inflation reading, while Oracle stock is trying to rally following a mostly solid quarterly result.
The company reported in-line revenue results and a miss on earnings estimates. (It would have been a beat if not for currency headwinds due to Oracle’s acquisition of Cerner.) But the company’s revenue outlook for the second quarter helped reduce investors’ concern.
The technicals were mixed for Oracle stock ahead of the report, so let’s outline the key levels now that the news is out of the way.
Trading Oracle Stock on Earnings

Chart courtesy of TrendSpider.com
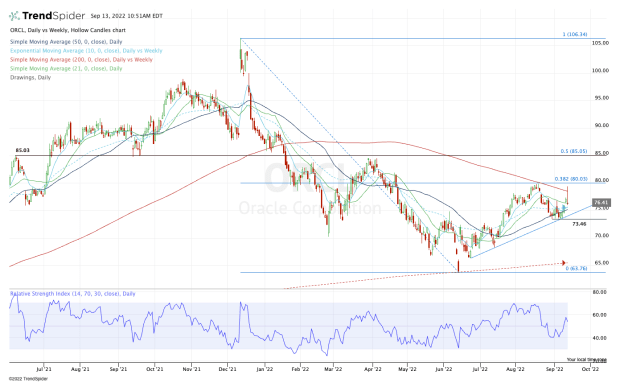
Today’s mixed price action doesn’t do much to provide clarity to the charts.
Oracle stock made an impressive move from negative territory to positive territory on a day where the selling pressure is heavy.
But the stock didn’t quite make its way to $80, and in the process, it was rejected by the 200-day moving average.
While Oracle is holding up above its short-term moving averages, the $73.50 to $75 zone should be the main focus for the bulls. In this area we find the 50-day moving average and uptrend support (blue line).
These measures have been notable over the past few weeks, but the $73.50 level has been critical. This area has been notable support (in combination with the 50-day and uptrend support), and if it fails, we could be looking at significant selling pressure.
There are a lot of levels to take note of below $73.50, but a move below $69 could very well put the 200-week moving average and possibly the 2022 low at $63.76 in play.
On the upside, $80 and the 200-day moving average are resistance until proven otherwise.
A close above this area opens the door to the key $85 area. This level has been support and resistance over the months and happens to be the 50% retracement of the 52-week range.


