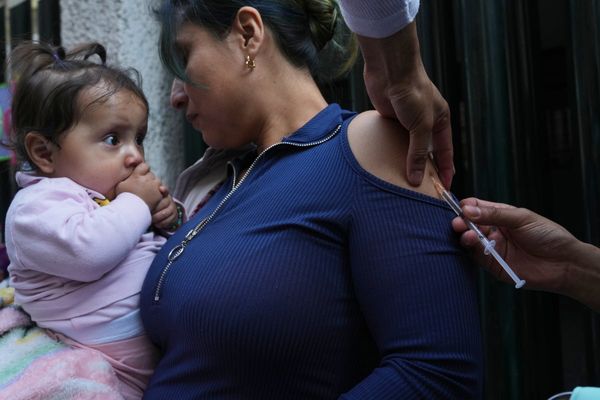
Families are the most beloved of all things by politicians. Next week’s budget, as all previous budgets, will talk about families – and mostly about ones in which people are working. The latest data on families released this week by the Australian Bureau of Statistics shows that more than ever before, families have more than one income supporting them.
The story of families in Australia over the past 50 years is, much as with employment, the story of women. And it is striking how greatly things have changed and how what was normal in the past now often looks bizarre.
When Paul Keating made his first parliamentary speech in 1970 he argued that “it is bad enough for the working man to be dragged away from his home at night when he should be with his wife and family but it is even worse when he has to send his wife out to work in order to make ends meet”.
He talked about the “exorbitant cost of housing” and that “husbands have been forced to send their wives to work in order to provide the necessaries of life”.
While making that speech he would have looked around the House of Representatives chamber and seen a lot of men nodding. In fact only men, because at that time there was not one female MP.
But times change and we change with them and by 1995 Keating was boasting that his government had delivered “the highest ever labour force participation by women in the economy”.
1995 is now further in the past than 1970 was then, and the makeup of families continued to change.
The latest survey of families from the ABS shows that one big change over the past few decades has been the shift away from families being made up of couples with dependants to that of couples without children or with children who have now left the home:
If the graph does not display click here
In 1974, 55% of families (that is households not including those with just single people) were the traditional two parents and at least one dependant; now they account for just over 36%.
There has been a slight increase in the numbers of single-parent families, but they remain very much the minority.
We have also seen a small but significant shift towards same-sex couple families.
Just 20 years ago, same-sex couples, either with or without children, made up just 0.08% of all families. There were just 4,438 such families across all of Australia. Now there are more than 102,000 and they account for 1.5% of all 7.32 million families:
If the graph does not display click here
It does not appear that marriage equality in 2017 has had a great impact, more that the long-term trend has continued. The changing of the law merely reflected societal norms rather than shaped them.
Another long-term trend that has continued and would displease 1970s Keating is the number of couples who both work.
At the end of the 1970s just 41% of couples with dependants both worked. By the time Keating was boasting of record numbers of women in work, it was up to 58%. Now 71% of couples with dependants both work:
If the graph does not display click here
A large reason for this is that women in their 20s and 30s now are much more likely to work than women were in the late 1960s and early 1970s.
Back then the “nappy valley” of women’s participation was in full effect. In 1967, 60% of women aged 20-24 worked, but just 35% of those aged 25-34 did. By comparison now 78% of women in both age groups work, and it rises to 80% for 35–54-year-olds:
If the graph does not display click here
Men are still more likely to be the ones who only work. However even here the change is quite marked. At the end of the 1970s a majority of couples who had at least one person employed had just the male partner working; only in 2% of cases was the mother or woman the only partner employed:
If the graph does not display click here
Now both parents are more likely to work and only 10% more couples have only the man working compared with the woman.
That men are still more likely to be the sole earner does reflect that while total employment rates between men and women have evened somewhat, men are much more likely to work full-time regardless of their age:
If the graph does not display click here
Most crucially, between the ages of 25 and 59 when people are in their prime-earning ages and when they are most likely to have dependents, men are one-and-a-half times more likely to be working full-time:
If the graph does not display click here
It highlights that economic dependence remains a major issue for women – something that can have a massive impact on their retirement and standard of living should the relationship break down.
There is of course one type of family where the woman is overwhelmingly the major earner – single-parent families. Consistently over 80% of single-parent families see the mother as the one left with responsibility:
If the graph does not display click here
The changes made by the Howard government and then the Gillard government to force single parents with children over eight years old from the parenting payment to the much lower Newstart allowance massively targeted women over men.
They may make up a minority, but with just over 1 million such families, they deserve much more attention than they get.
When governments talk of families they are always more likely to talk about ones where both partners work. The data shows that things might have changed a great deal in 50 years, but income equality is a long way off.
• Greg Jericho is a Guardian columnist and policy director at the Centre for Future Work


