As the country gears up for the election, all eyes are on the bellwether constituencies that historically reflect the broader national mood.
Where will this election be won and lost? Which constituencies hold the balance of power? And where are the key swing seats?
In this election, answers are harder to come by than usual because new boundaries have been drawn, meaning that 585 out of 650 constituencies have changed shape since the last election. Some have become larger, others smaller and some have been split into many parts with no obvious ancestor.
Because residents are voting in new geographical formations, we only have a limited understanding of the political context in which many of this year’s contests will take place.
But to shed light on the matter, we have undertaken a major new data collection exercise and redistricted past election results since 1997 onto the new constituency boundaries, using population counts for 189,000 census output areas – each of which contains between 100 to 625 people. This unique data provides an insight into how residents in the current constituencies have voted over time, and which party has historically been the most popular at each election starting with Tony Blair’s first landslide in 1997 and ending in Boris Johnson’s emphatic victory in 2019.
The top 10 bellwethers
Although the country has changed a lot politically over the last seven elections, there are 55 bellwether constituencies, where the residents have consistently followed national trends and voted locally for the same party that ends up in 10 Downing Street. Of these, 52 are in England and three are in Wales.
Some of these seats will be easier for Labour to win than others. In Hendon, London, Labour were only 8 percentage points behind the Conservatives in 2019. But in Cannock Chase in Staffordshire, Labour faces a tougher task. Despite residents backing Tony Blair’s New Labour in 1997, 2001, and 2005, Labour’s support among residents declined from 55% in 1997 to just 25% in 2019. The Conservatives took 68% of the vote in 2019, making Cannock Chase one of the safer Tory seats in the country (47th of 650). If Labour does end up winning there, the Tories will be in for a very bad night indeed.

Table 1 zooms in on the top ten bellwether constituencies, where the vote share of the local residents has most closely mirrored the vote share of the Conservatives and Labour at the national level over the last 27 years. In each election since 1997, the balance of opinion among these residents has closely reflected the national outcome.
Local support for the election winner, 1997-2019
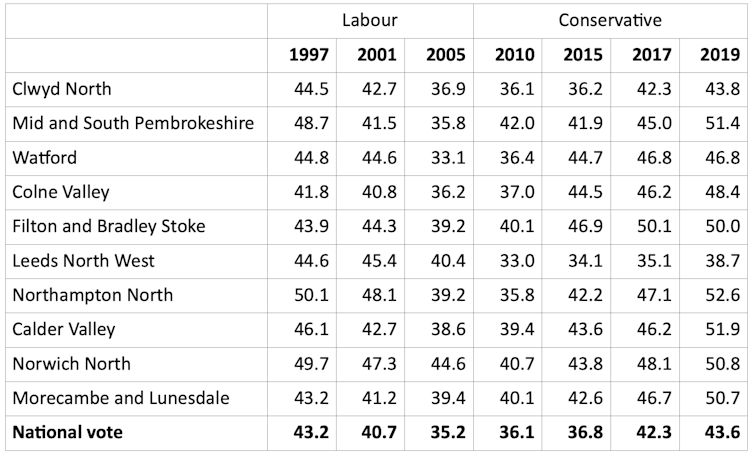
What happens in these places, then, could be seen to have offered a snapshot of the broader political mood over that time. Residents in these constituencies may well find themselves in high demand for vox pops and focus groups in 2024.
The 338 seats that have not switched 27 years
In contrast to these bellwethers, some steadfast constituencies have remained remarkably resistant to political change. Residents in 338 constituencies have consistently voted in support of the same party across the last seven general elections. Of these, 165 have consistently voted for Labour and 168 have consistently voted for the Conservatives.
The most steadfast Tory residents are those in South Holland and The Deepings in Lincolnshire. Here, the estimated Conservative vote has averaged at 60% over the last seven general elections. John Hayes, who has held the seat for that entire period, should therefore be feeling confident.
The most steadfast Labour residents are those in Liverpool Walton, where the average vote for Labour has been a whopping 75%. Dan Carden, first elected there in 2010, will therefore surely fancy his chances of being returned as the MP.
The ultra marginals and ultra volatiles
Another group of constituencies has consistently produced very close verdicts, with average winning margins of 6 percentage points or less over the last seven elections.
Top 10 most competitive constituencies, 1997-2019
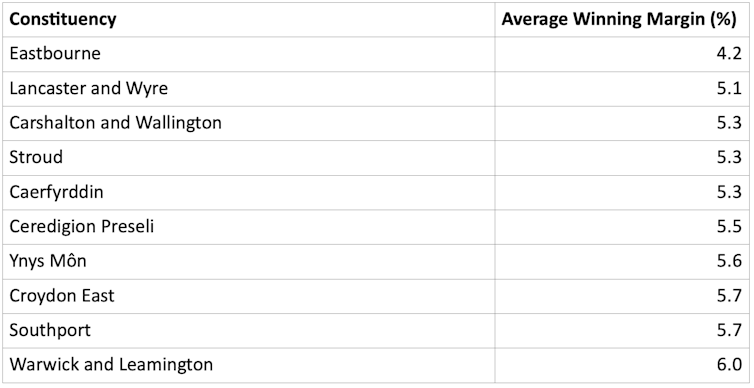
Of these, Eastbourne, on the southeast coast, is very interesting. It has, on average, produced the closest verdicts, with very tightly contested vote between Conservative and Liberal Democrats. If past behaviour repeats itself, the outcome in these places could once again be a toss-up.
Residents in some other constituencies have shown massive fluctuations in their support for different between elections. Table 3 shows which places have been the most volatile over the last 27 years.
Blaenau Gwent and Rhymney, a new Welsh constituency created from parts of four others, leads the way for volatility. The voters who now make up this constituency have shown strong support for independent candidates over the years. Peter Law, for example, was elected as an independent MP for the former constituency of Blaenau Gwent in 2005, after resigning from the Labour party in protest against all-women shortlists. The local party, Blaenau Gwent People’s Voice Group, also polled well in the area during the mid-2000s.
Top 10 most volatile constituencies, 1997-2019
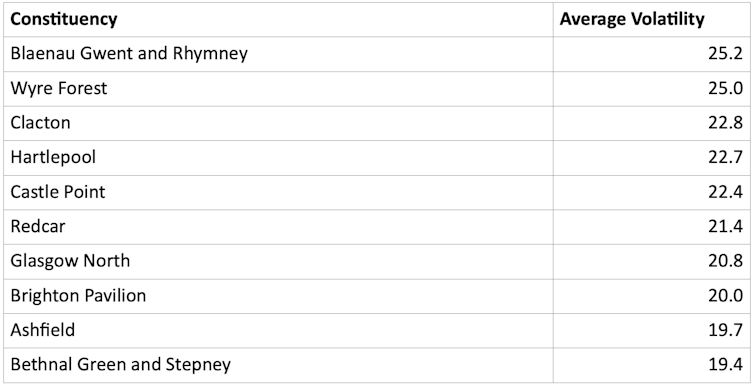
Wyre Forest in the Midlands has witnessed strong surges of support for independent candidates, such as Richard Taylor who stood in protest against the closure of the A&E department at Kidderminster hospital. Elsewhere, some of the places with the highest levels of volatility over the last few elections are the ones where Ukip briefly burst onto the scene in 2015. Clacton in Essex witnessed Ukip’s only success, when Douglas Carswell won the seat as a Ukip candidate in 2015. With Nigel Farage contesting the seat this time, he’ll be hoping for a similar performance.
This article is based on research carried out with Paula Aucott and Chris Prosser.
Humphrey Southall is a member of the Labour Party.
This article was originally published on The Conversation. Read the original article.

