Dogecoin (CRYPTO: DOGE) spiked up over 7% at one point during Thursday’s 24-hour trading session before falling to trade about 2% higher.
The crypto has been consolidating since Sunday, trading mostly sideways and within a number of inside bar patterns on decreasing volume.
The consolidation was needed after the crypto skyrocketed over 150% between Oct. 25 and Oct. 29 after news that Tesla Inc (NASDAQ:TSLA) CEO Elon Musk’s Twitter acquisition was set to close.
See Also: Dogecoin Rally Halts After Rate Hike But 1 Crypto Charges Ahead
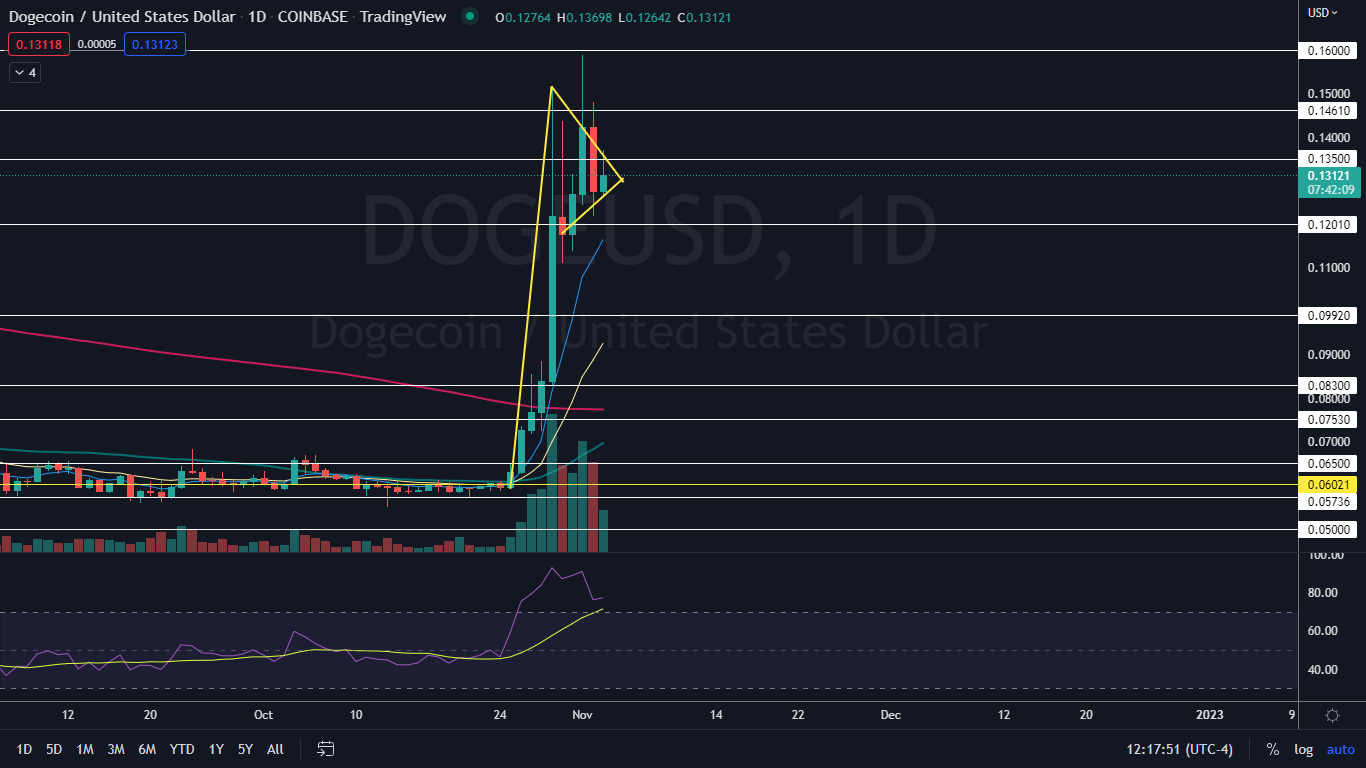
Dogecoin’s sharp rise, paired with the mostly sideways consolidation may have settled the crypto into a bull flag pattern on the daily chart.
The bull flag pattern is created with a sharp rise higher forming the pole, which is then followed by a consolidation pattern that brings the stock lower between a channel with parallel lines or into a tightening triangle pattern.
For bearish traders, the "trend is your friend" (until it's not) and the stock or crypto may continue downwards or sideways within the following flag for a short period of time. Aggressive traders may decide to short the stock or crypto at the upper trendline and exit the trade at the lower trendline.
- Bullish traders will want to watch for a break up from the upper descending trendline of the flag formation, on high volume, for an entry. When a stock or crypto breaks up from a bull flag pattern, the measured move higher is equal to the length of the pole and should be added to the lowest price within the flag.
- A bull flag is negated when a stock closes a trading day below the lower trendline of the flag pattern or if the flag falls more than 50% down the length of the pole.
Want direct analysis? Find me in the BZ Pro lounge! Click here for a free trial.
The Dogecoin Chart: Dogecoin’s flag formation is taking place within a triangle and traders and investors can watch for the crypto to break up or down from the pattern on higher-than-average volume to indicate the bull flag was recognized. If Dogecoin breaks up from the flag, the measured move could take the crypto toward the 27-cent mark.
- Dogecoin is set to hit the apex of the flag on Nov. 5, but if significant volume doesn’t come in to break the crypto from the pattern the bull flag will be negated and Dogecoin may continue to trade sideways. If Dogecoin breaks down from the pattern and loses support at the eight-day exponential moving average, the flag will be negated, and a downtrend could occur.
- Within the triangle, Dogecoin has been making a series of lower highs and higher lows as the daily trading range decreases. The decreasing volatility paired with the sideways trading within the flag has helped to drop the crypto’s relative strength index (RSI) down from 92% to about 76%.
- When a stock or crypto’s RSI measures in at about 70%, its considered to be in oversold territory. Due to Dogecoin’s elevated RSI, a break up of the bull flag becomes less likely, although it should be noted that RSI levels can remain extended for long periods.
- Dogecoin has resistance above at $0.135 and $0.146 and support below at 12 cents and just under the 10-cent level.

See Also: Dogecoin Rally Halts, Bitcoin, Ethereum Down After Fed Rate Hike — But 1 Major Crypto Is Still Charging Ahead
Photo: Pixabay


