Many investors over the years have seemed to feel comfortable ignoring Broadcom.
Despite Broadcom's strong cash flows and hefty yield, investors have refused to bid the shares high enough to warrant a premium valuation vs. the S&P 500.
Is that going to change?
In mid-May I asked, “Can Broadcom Stock Catch Up to Chip Favorites Nvidia and AMD?”
At the time, the chipmaking stalwart's shares were going weekly-up and clearing resistance at the same time. It allowed for an excellent trade on the long side.
Of course, we couldn’t predict that Broadcom and Apple (AAPL) would expand their partnership, nor could we have known that Nvidia (NVDA) would deliver blowout guidance and cause the entire semiconductor space to explode higher.
Don't Miss: Did Target Stock Just Bottom?
Broadcom ultimately rallied about 45% from that mid-May breakout level, with a bulk of that move coming over a three-session stretch from May 25 to May 30.
Given the rally, Thursday’s earnings report was under close watch by investors. The company delivered a top- and bottom-line beat of Wall Street expectations and talked positively about AI.
At last check Broadcom shares were higher by about 1.8% on the day, although the stock has wavered between positive and negative territory.
Is Broadcom Stock Still Buyable?

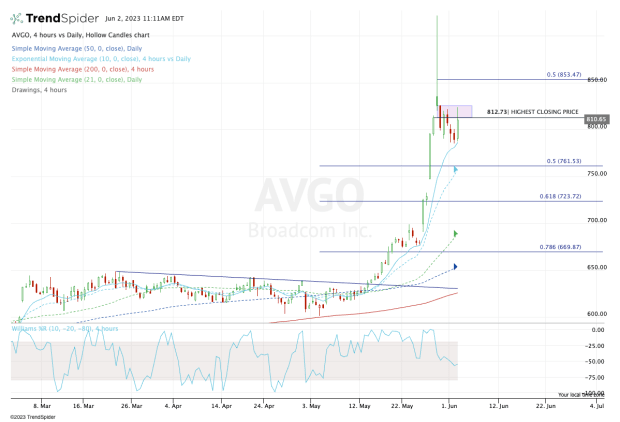
Chart courtesy of TrendSpider.com
Despite the stock surge, shares currently trade at about 19.5 times this year’s earnings. While that’s hardly a valuation one can complain about, it is a bit rich relative to the earnings-based valuation the stock has garnered in the past.
Regardless, sometimes we have to let the trends do the talking and the trends in Broadcom stock have been decisively bullish.
While the price action has been volatile lately -- and risks creating a topping pattern -- the charts can be navigated.
For Broadcom, I zoomed in to the four-hour chart, and you can see how the 10-unit moving average has been support so far, near $785. This level is also shaping up to be the two-day low.
Don't Miss: Salesforce Stock Dips on Earnings. Here's When to Buy
If the shares can’t hold the $785 zone, then the door might open down to the 50% retracement and the rising 10-day moving average, currently near $760.
Below that could put the $720 to $725 zone in play.
On the upside, note that the stock’s 52-week high is all the way up near $922, but the highest closing price is just $812.73. Further, the $815 to $825 area has seemed to be stiff resistance.
If shares can clear this area, then $850 or higher could be back in play.
If the stock can’t clear this area, then keep a close eye on the $785 level.
Sign up for Real Money Pro to learn the ins and outs of the trading floor from Doug Kass’s Daily Diary.


