The manner in which numbers are disseminated in a government dataset poses a headache for data journalists. A majority of such datasets are typically in PDF format. Many are essentially image files converted into PDFs using online tools. This means that it is routine for a data journalist in India to spend 80%-90% of their time transforming PDF files into Excel sheets. The tedious task involves “cleaning” up the files by eliminating merged rows and columns to ensure that unique rows are ready for analysis and removing duplicates and blank rows. To do this. data journalists use tools such as Tabula and Adobe’s PDF to Excel converter. However, these are time-consuming efforts and often fail to deliver accurate results.
Data journalists, especially those who work in newsrooms, are constrained by deadlines. This means that they have limited time to analyse and draw conclusions from such data. OpenAI’s code interpreter has considerably eased this process. The Code Interpreter converts PDF documents into Comma Separated Files (CSV) and allows the journalist to download them for further analysis. Moreover, if the CSV files had merged rows and columns, a big no-no for data analysis, Code Interpreter makes them unique.
To leverage these capabilities, it’s crucial that the prompts are correctly formed. The hyperlinked Twitter thread provides a series of effective prompts, which assisted The Hindu’s data team in successfully cleansing an RTI response from the Department of Higher Education. The following is the story shaped by harnessing the data-cleaning capabilities of the Code Interpreter.
The Code Interpreter is not solely a tool for cleaning datasets; it also aids in their analysis. For a recent story, the Code Interpreter analysed Ashoka University’s Lok Dhaba data set to determine the voter turnout in various regions of Manipur (Hills Naga, Hills Kuki, Valley Rural, and Valley Urban), which highlighted a trend. However, the analysis was not used to form a story, given that Code Interpreter is still in its early stages and the tool also leveraged matplotlib to visualise the data and produced a Scalable Vector Graphic file for print designers to utilise.
Essentially, the process of cleaning an Excel sheet has been streamlined and no longer requires additional tools. It has been simplified to engaging in a conversation with the Excel sheet, guided by the Code Interpreter.
Intriguingly, the Code Interpreter even adjusts user prompts, providing insights into the correct framing of a prompt to achieve the desired outcomes.
Recap
- In the first two weeks of July 2023, landslides and flash floods caused by torrential rainfall in north India, including Himachal Pradesh, Punjab, Haryana, and Delhi, wreaked havoc. North India experienced exceptionally high rainfall (over 200 mm). On the other hand, except for some parts of Gujarat and central India, the rest of the country received scant rainfall. Data show that several areas in north India recorded a significant deviation (an increase) from normal rainfall, with Punjab leading at over 200%. Chandigarh recorded the highest-ever 24-hour rainfall for the city for any day since 1952 at 283mm. Kullu in Himachal Pradesh also recorded its wettest July and second-wettest days ever.
- On June 30, the U.S. Supreme Court ruled that the U.S. administration had overstepped its authority in trying to cancel or reduce student loans. It effectively dismissed President Joe Biden’s $400 billion student loan forgiveness plan, which he announced in 2022 in line with his campaign promise. Biden’s plan claimed to relieve the burden of student loans from lower-middle-class borrowers and narrow the racial wealth gap. Data show that college tuition fees both in public and private universities increased in the last few decades. This could be attributed to the 200% increase in cumulative student debt, while the share of student borrowers increased by only 50% by 2021. Further, the impact of student loans was felt more among Black and Hispanic communities compared with their White and Asian counterparts, due to disparity in income levels.
- The fiscal situation of India’s States has garnered significant attention in recent times. Most of the small States (States with a population of less than 1 crore) have distinctive characteristics that limit revenue mobilisation. Recognising these disabilities, the Constitution has provided mechanisms to address them. But these States continue to rely heavily on the Union government for revenue. This dependence creates vulnerabilities for the States as well as the Union. Data show that the share of Union transfers in the revenue receipts of all States combined hovers between 40% and 50%. But this ratio is more than 60 in most small States, while in five of them, it is more than 90%. The capacity of small States to raise their own taxes is also limited. Eight out of nine States fare worse than the all-State average own tax revenue (OTR) to gross state domestic product (GSDP) ratio.
- In the month leading up to the panchayat elections in West Bengal, 40 people were killed in poll-related violence. Data show that political violence and related deaths peaked during and around all the recent polls in West Bengal. Moreover, a comparison of States shows that except for Jammu and Kashmir, a highly militarised region, West Bengal had the highest share of incidents of political violence. While political violence peaked during the 2019 Lok Sabha elections in many States including Uttar Pradesh, Punjab and Kerala, incidents of political violence crossed 200 in West Bengal around this period, the highest among all States.
- The response to an RTI query filed with the Minister of Higher Education by activist Chandrashekhar Gaur shows that over 30% of teaching positions were vacant in 45 Central Universities across India. A State-wise split shows that 88% of teaching positions were vacant in Odisha’s central universities, the highest among all the States. While only 20% of teacher positions sanctioned under the general category were vacant, 44% among the OBC positions, 38% among the SC positions and 45% among the ST positions remained vacant.
Fortnightly figures
- 9.89 percentage points was the decline in the share of multidimensionally poor in India, from 24.85% in 2015-16 to 14.96% in 2019-2021, according to the ‘National Multidimensional Poverty Index: A Progress Review 2023’. The report released by the Niti Aayog on July 17 claims that about 13.5 crore people were lifted out of multidimensional poverty during the period. The report said this assessment was made by identifying “acute deprivations in health, education and standard of living” using United Nations-approved parameters.
- 4.81% was India’s retail inflation in June, a three-month high. Retail inflation stood at 4.31% in May. The acceleration in retail inflation is attributed to a spike in food price inflation to 4.5% from less than 3% in the previous month, owing to rising costs faced by households for items like cereals, pulses, milk and tomatoes.
- India won 20 medals at the Commonwealth Weightlifting Championships held in Greater Noida. On the final day of the sports tournament, Lovepreet Singh and Purnima Pandey won a silver and bronze medal, respectively In total, India reigned supreme with nine gold, as many silver and two bronze medals. In the five-day tournament, Indian lifters shined in all three categories- youth, junior and senior.
- Rs. 30,600 crore was the amount invested by Foreign Portfolio Investors (FPIs) into the Indian equity market, as FPIs remained unabated in the first fortnight of this month, driven by India’s robust economic growth and strong corporate earnings. If this trend continues, Foreign Portfolio Investments in July will exceed that in May and June.
- Rs. 1.4 lakh crore was the total spending on credit cards in May, a record-high, according to the latest data released by the Reserve Bank of India. The total spending or outstanding dues on credit cards, which remained rang-bound throughout the year in the previous fiscal, have been rising by 5% month on month this year. The number of cards in use crossed 87.4 million in May, also an all-time high.
Chart of the week
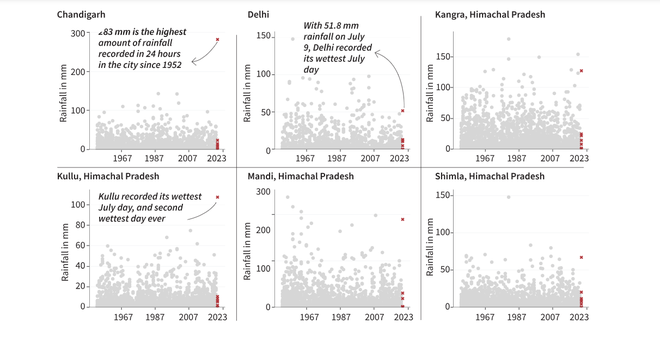
The chart shows the actual rainfall recorded on a July day in millimetres across select north Indian cities. Each grey circle corresponds to a July day between 1952 and 2022. The highlighted crosses correspond to a July day in 2023.
Chandigarh recorded a 24-hour rainfall of 283 mm on July 9, 2023. This was the highest-ever 24-hour rainfall for the city for any day since 1952. The second highest level of 144 mm was recorded in Chandigarh on July 6, 1988. Kullu in Himachal Pradesh also recorded its wettest July day, and second-wettest day ever.
Flashback
Karnataka’s economic performance was the best among all the major States in 2020-21. But while the State’s per capita GDP has improved by leaps and bounds over the years, this growth has not translated into better outcomes in education, health, and sanitation. Notably, the limited social development is restricted to certain pockets of the State leading to significant inter-district disparity.
Data showed that there is a huge income disparity between richer districts such as Bengaluru Rural, Bengaluru Urban, Chikkamagaluru, Dakshina Kannada, and Udupi whose per capita income crossed ₹3 lakh, and poorer districts such as Bidar, Koppal, Haveri and Vijayapura whose per capita income was lower than ₹1.5 lakh. Such disparities translated into socio-development indicators as well.
A series of Data Points examined the inter-district differences in the southern States. A look at Tamil Nadu’s data revealed that there were vast differences between advanced districts such as Chennai, Kanniyakumari and Coimbatore and relatively poor districts such as Ramanathapuram, Pudukkottai, Ariyalur, and Perambalur, with the poorer districts lagging in socio-economic indicators. While this was also the case in Kerala, with Kasaragod, Malappuram, Palakkad and Wayanad districts lagging behind Ernakulam, Alappuzha, Thrissur and Thiruvananthapuram, these differences were not as stark in Kerala compared with Tamil Nadu and Karnataka.
Thank you for reading this week’s edition of the Data Point newsletter! To subscribe, click here. Please send your feedback to vignesh.r@thehindu.co.in