
The semiconductor sector is often in focus for tech investors, not just because it contains prominent stocks like Nvidia (NVDA), Intel (INTC) and Advanced Micro Devices (AMD) but because it acts as a leading indicator for the stock market.
Semiconductors used to be a more cyclical business. Consumer electronics were more sensitive to the ebbs and flow of the overall market.
Don't Miss: Tyson Foods Stock Is Slumping; Here's Where It Could Find Support
Now we have semiconductors powering some sort of technology in nearly every industry on arth — from retail to agriculture, energy, industrials and everything in between.
As a result, many investors will acknowledge that semiconductor stocks hold less economic perspective than they once did. Still, this group does tend to be a stock market leader (in both directions).
The latest buzz has been AI and it’s been a leading catalyst for the rallies in Nvidia and AMD. Nonetheless, the momentum in the VanEck Semiconductor ETF (SMH) has waned in recent trading.
Let’s look at the chart.
Trading Semiconductor Stocks (SMH ETF)
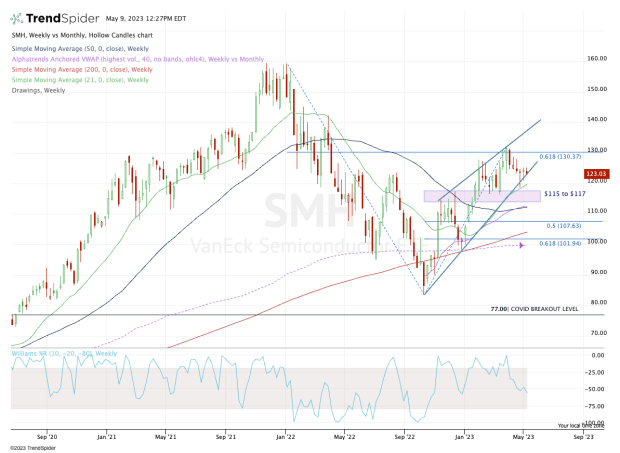
Chart courtesy of TrendSpider.com
Looking at the weekly chart, investors can see the sharp rally from the mid-$80s back up through the 200-week moving average and the monthly VWAP measure, which then became support.
While the SMH ETF has continued to put in a series of higher highs and higher lows — bullish technical developments — there are some concerns that the range is beginning to narrow.
That creates risk that the SMH could break the current uptrend, although even in that scenario, it could be just the end of the current pattern, not the end of the world.
First, the bulls would need to see how the SMH ETF handles the $115 to $117 area. This zone was resistance in the fourth quarter but support in the first quarter after its strong start to 2023.
Don't Miss: Meta Stock Has Been Great This Year but Weak for a Week. Buy The Dip?
If it overshoots this area to the downside, the weekly VWAP measure and 50-week moving average are in play near $112.
Below that, things get interesting.
The 50% retracement of the current rally comes into play near $107.50, while there’s an unfilled gap down at $106.45. So this area would be quite interesting for potential buyers.
Below that and $100 should be on investors’ radar.
On the upside, the bulls want to see the SMH ETF clear the $130 to $132 area for more upside. That could open the door to the $143 level and potentially higher.
Get investment guidance from trusted portfolio managers without the management fees. Sign up for Action Alerts PLUS now.