Pinterest, Inc (NYSE:PINS) and Snap, Inc (NYSE:SNAP) have been trading in a fairly tight horizontal pattern, which indicates consolidation.
The consolidation has been in response to the two social media stocks being heavily beaten down over the course of many months, where Pinterest plunged over 64% from its Feb. 16, 2021 all-time high of $89.90 and Snap declined about 60% from the all-time high of $83.84, which was reached on Sept. 24 of last year.
The horizontal trading patterns have both been created on average or lower-than-average trading volume, which indicates an expected or low level of investor interest. Low volume levels also indicate a stock is running out of both buyers and sellers, which is often preceded by an influx of either bullish or bearish volume to break the security either up or down from a horizontal pattern.
Whether the stocks break up or down from the pattern may depend on the S&P 500, which technically entered into a bearish market when it lost support at the 200-day simple moving average (SMA) on Monday.
Until the break from the pattern happens, both Pinterest and Snap look set to bounce, because both stocks are trending towards the bottom horizontal trendline of the pattern.
It should be noted, however, that events affecting the general markets, negative or positive reactions to earnings prints and news headlines can quickly invalidate patterns and breakouts. As the saying goes, "the trend is your friend until it isn't" and any trader in a position should have a clear stop set in place and manage their risk versus reward.
In The News: On Tuesday, Snap added a new product to the Discover channel on its Snapchat app called Dynamic Stories that allows over 40 news outlets to publish stories directly to the social media platform. The product creates a seamless upload capability for news publications to add stories and breaking news to the Discover platform and earn income from the views.
Want direct analysis? Find me in the BZ Pro lounge! Click here for a free trial.
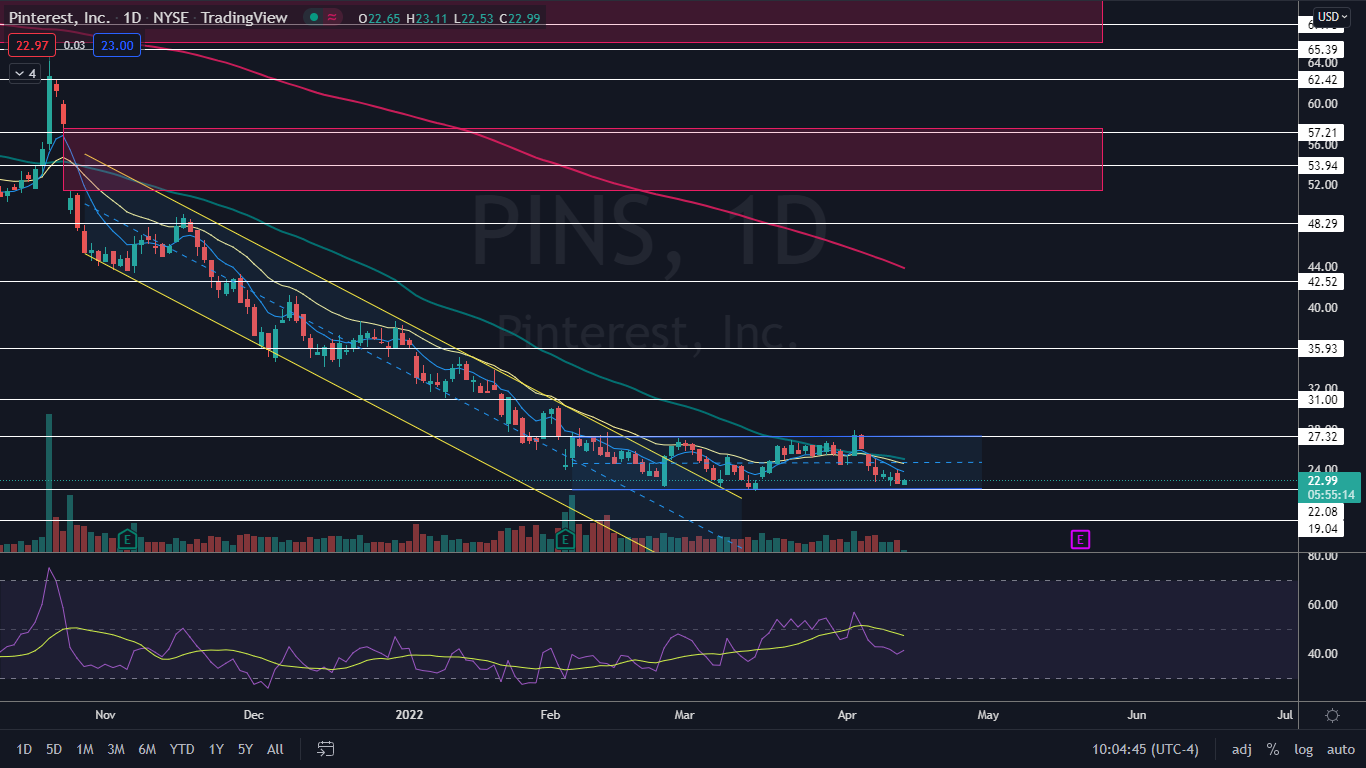
The Pinterest Chart: Pinterest was trading slightly higher on Wednesday, completely within Tuesday’s trading range, which has set the stock into an inside bar pattern on the daily chart. In this case, the inside bar is neutral because Pinterest has been trading in a horizontal pattern between $22.08 and $27.32 since Feb. 3.
- Traders and investors can watch for a break up or down from the mother bar later on Wednesday or on Thursday. If Pinterest breaks bearishly from the pattern, the stock is likely to hold support at the bottom horizontal trendline of the pattern and if Pinterest forms a reversal candlestick at that level, it could offer a solid entry point for a bullish position.
- If the stock breaks up from the inside bar pattern, Pinterest is likely to meet resistance again at the upper trendline of the pattern, which could provide a solid entry for a bearish trader wishing to take a short position in the stock.
- When Pinterest eventually breaks up or down from the horizontal pattern, traders and investors can watch for higher-than-average volume to enter into the stock, which will indicate the pattern has been recognized.
- Pinterest has resistance above at $27.32 and $31 and support below at $22.08 and $19.04.
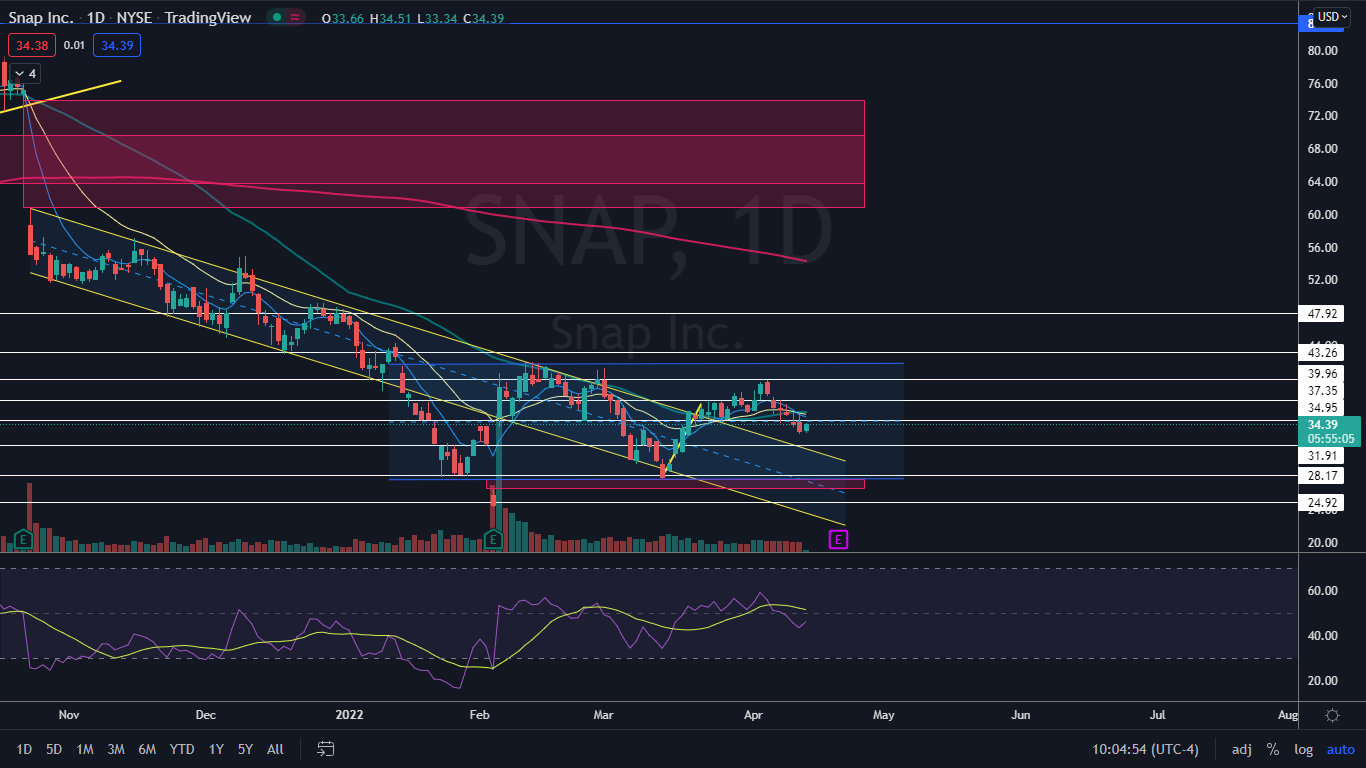
The Snap Chart: Snapchat has been trading in a horizontal pattern since Jan. 13, between the $22.19 and $27.37 levels. Like Pinterest, the stock is likely to remain within the pattern, bouncing up and down between the parallel trendlines until big volume comes in to break the stock up or down from the pattern.
- Also, similarly to Pinterest, Snap was forming an inside bar pattern on Wednesday and traders and investors can watch for a break from the mother bar to gauge future direction.
- Within the horizontal pattern, Snap may find support at the upper descending trendline of a falling channel pattern, which the stock broke up bullish from on March 22. Snap has not yet backtested the area and if the stock does so and forms a reversal candlestick at the level, it could provide a solid entry point for bullish traders.
- Snap has resistance above at $34.95 and $37.35 and support below at $31.91 and $28.17.