
-
Investors are rightfully concerned about cannabis company liquidity in the face of a constricting capital market. To dig into this, we compared adjusted cash balances to current loan and lease obligations.
-
Focusing on the 114 companies in the Viridian Value Tracker database with market caps over $25 million, we found the latest quarterly cash and equivalents, short-term debt, and current maturities of long-term debt, including leases.
-
We adjusted these figures for transactions tracked in the Viridian Deal Tracker after the quarter's close, including equity and debt raises, M&A transactions (such as asset sales) and debt restructuring transactions.
-
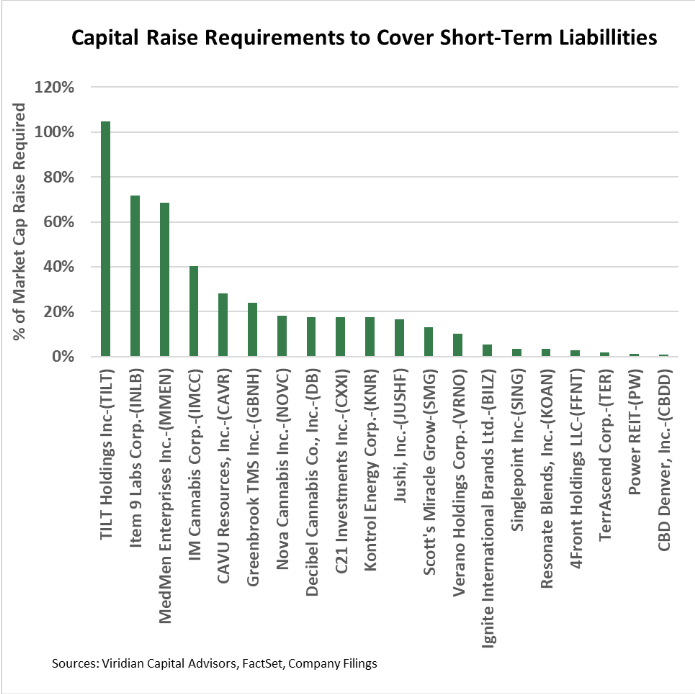
The graph shows the 20 companies with negative adjusted cash minus short-term debt. We scaled the numbers by dividing them by the company's market capitalization.
-
The graph shows that Tilt Holdings (OTC:TLLTF) would have to raise approximately 105% of its current market capitalization to have enough cash to pay its short-term maturities.
-
Most of the figures in the chart appear manageable at under 20% of the market cap raises required. Several, like MedMen (OTC:MMNFF) at 40%, are more troubling. MedMen could solve this issue by finding another buyer for its NY operations
-
The chart understates potential liquidity problems by not taking into account the negative cash flow of these companies. Still, it is a good starting point for investors to screen their portfolios for upcoming problems. Talk to us about the Viridian Credit Tracker model for a more sophisticated liquidity analysis.
-
The Viridian Capital Chart of the Week highlights key investment, valuation and M&A trends taken from the Viridian Cannabis Deal Tracker.
The Viridian Cannabis Deal Tracker provides the market intelligence that cannabis companies, investors, and acquirers utilize to make informed decisions regarding capital allocation and M&A strategy. The Deal Tracker is a proprietary information service that monitors capital raise and M&A activity in the legal cannabis, CBD, and psychedelics industries. Each week the Tracker aggregates and analyzes all closed deals and segments each according to key metrics:
-
Deals by Industry Sector (To track the flow of capital and M&A Deals by one of 12 Sectors - from Cultivation to Brands to Software)
-
Deal Structure (Equity/Debt for Capital Raises, Cash/Stock/Earnout for M&A) Status of the company announcing the transaction (Public vs. Private)
-
Principals to the Transaction (Issuer/Investor/Lender/Acquirer) Key deal terms (Pricing and Valuation)
-
Key Deal Terms (Deal Size, Valuation, Pricing, Warrants, Cost of Capital)
-
Deals by Location of Issuer/Buyer/Seller (To Track the Flow of Capital and M&A Deals by State and Country)
-
Credit Ratings (Leverage and Liquidity Ratios)
Since its inception in 2015, the Viridian Cannabis Deal Tracker has tracked and analyzed more than 2,500 capital raises and 1,000 M&A transactions totaling over $50 billion in aggregate value.
The preceding article is from one of our external contributors. It does not represent the opinion of Benzinga and has not been edited.