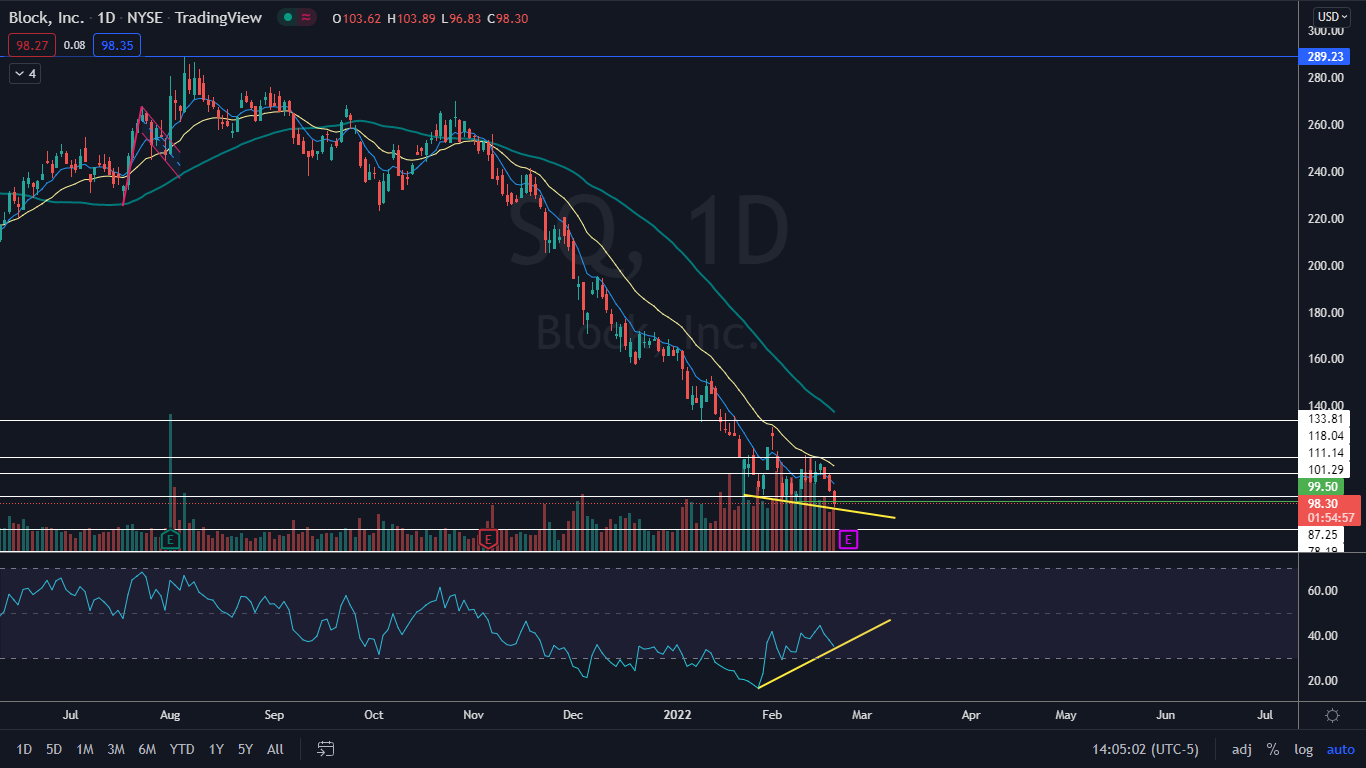
Block Inc (NYSE:SQ) was sliding more than 6% lower on Friday after breaking through an important psychological support zone at the $100 level.
The financial services and digital payments company has been severely beaten down since reaching an all-time high of $289.23 on Aug. 5, 2020, plummeting more than 65%. The stock is affected by both the general markets and the cryptocurrency sector due to its business model, which includes CashApp, a mobile payment service and stock and Bitcoin (CRYPTO: BTC) trading platform.
On Feb. 24, Block is expected to print its fourth-quarter financial results after market close. Ahead of the event, a number of analysts have upgraded the stock.
On Feb. 9, Mizuho analyst Dan Dolev reiterated a Buy rating on Block with a $210 price target, which was followed by BofA Securities analyst Jason Kupferberg, who upgraded the rating from Neutral to Buy, while reducing the price target from $221 to $185. On Thursday, Daiwa Capital initiated coverage on Block with a Buy rating and announced a price target of $160.
If Block were to trade up at even the lowest analyst price target, it would represent about a 63% move to the upside, which seems nearly impossible considering the current state of the markets where growth stocks are currently taking a massive hit. The stock is likely to at least bounce up higher over the short-term because it is flashing some reversal signals on the daily chart.
See Also: Drake Bets $1.3M In Bitcoin On Super Bowl LVI
The Block Chart: Block has been trading in a steep downtrend since Oct. 26, making a consistent series of lower highs and lower lows. The most recent lower low was printed at $99.50 on Feb. 8 and the most recent lower high was created on Feb. 10 just below the $120 level.
While the stock has been making lower lows, Block’s relative strength index (RSI) has been making higher lows, while it has developed bullish divergence on the daily chart. The situation demonstrates that bears are losing power and is often followed by a bullish move up in the stock’s price, which can mark the end of a downtrend.
Block’s RSI is also measuring in at about the 34% level, which indicates a bounce may be on the horizon. When a stock’s RSI nears or reaches the 30% level it becomes oversold, which can be a buy signal for technical traders.
The stock is trading below the eight-day and 21-day exponential moving averages (EMAs), with the eight-day EMA trending below the 21-day, both of which are bearish indicators. Block is also trading below the 50-day simple moving average, which indicates longer-term sentiment is bearish.
Want direct analysis? Find me in the BZ Pro lounge! Click here for a free trial.
- Bulls want to see Block print a bullish reversal candlestick such as a doji or hammer and then for big bullish volume to come in and push the stock back up above the important $100 level. Above the area, there is further resistance at $11.14 and $118.04.
- Bears want to see continued bearish pressure drop the stock down below its next closest support level at $87.25. Below the area, there is further support at $78.19 and $69.60.

Photo: Courtesy Block


