Retirement-age baby boomers are finding more and more reasons to remain in the workforce — indeed, one out of every five Americans age 65 or older has decided to continue working past the traditional retirement age. That is double the percentage of 35 years ago. Additionally, 52% of soon-to-be retirees are planning to continue working in some capacity after they retire from their primary careers.
Also See: Gen X Is Hoping To Retire Like Boomers — Here’s Why They Can’t
Find More: 5 Clever Ways Retirees Are Earning Up To $1K Per Month From Home
This begs the question: Where are these retirement-aged Americans working?
That’s a question GOBankingRates recently sought to answer. To do so, GOBankingRates parsed data from the 2018 and 2023 5-year U.S. Census American Community Surveys to discern the population and labor force participation rate of those age 65 to 74, tracking the cities where those numbers were highest. Other factors, such as median household income, were included. Finally, GOBankingRates ranked the cities from highest to lowest in terms of which locations had the greatest five-year change in the labor force participation rate for ages 65 to 74. From that overall matrix, GOBankingRates found the 50 cities where more Americans are working past the age of 65.

Key Findings
- California leads the charge: The Golden State has eight cities boasting large retirement-age workforces, more than any other state in the union.
- Florida has the highest change in participation rate: Royal Palm Beach’s five-year change in labor force participation rates for those 65 to 74 is 27.9% — that’s 9% more than the next-highest city listed. Further, Florida comes in second after California in terms of overall cities in the top 50, with seven locations.
- Nearly half the retirement-age populations of four cities are still working: In Aliso Viejo, California, 47.7% of those 65 to 74 are still working. While that is the highest of any city listed, three other cities are very close behind: North Lauderdale, Florida (47.5%); Carrollton, Texas (45.4%); and Doral, Florida (45.2%).
Find Out: How Much Should the Average Middle-Class Baby Boomer Have in Savings?
Discover More: 10 Things Boomers Won’t Be Able To Afford in Less Than a Decade

1. Royal Palm Beach, Florida
- % of population 65+: 17.8%
- % of labor force ages 65-74: 43.9%
- 5-year % change in labor force ages 65-74: 27.9%
- Median household income: $92,382
I’m a Retired Boomer: 3 Things I Wish I Had Done Differently To Better Prepare For Retirement Longevity

2. Shelby, North Carolina
- % of population 65+: 21.5%
- % of labor force ages 65-74: 34.7%
- 5-year % change in labor force ages 65-74: 18.8%
- Median household income: $50,705
3. North Miami Beach, Florida
- % of population 65+: 16.1%
- % of labor force ages 65-74: 40.2%
- 5-year % change in labor force ages 65-74: 16.1%
- Median household income: $57,633
4. Dover, New Hampshire
- % of population 65+: 17.2%
- % of labor force ages 65-74: 35.9%
- 5-year % change in labor force ages 65-74: 15.3%
- Median household income: $92,748

5. South Fulton, Georgia
- % of population 65+: 11.3%
- % of labor force ages 65-74: 36.0%
- 5-year % change in labor force ages 65-74: 14.8%
- Median household income: $81,798
Learn More: 8 Moves To Make Immediately If You’re a Baby Boomer Without Retirement Savings

6. Canton, Georgia
- % of population 65+: 15.8%
- % of labor force ages 65-74: 35.9%
- 5-year % change in labor force ages 65-74: 14.8%
- Median household income: $81,642

7. North Lauderdale, Florida
- % of population 65+: 10.9%
- % of labor force ages 65-74: 47.5%
- 5-year % change in labor force ages 65-74: 14.6%
- Median household income: $63,423
8. Delaware, Ohio
- % of population 65+: 14.6%
- % of labor force ages 65-74: 33.0%
- 5-year % change in labor force ages 65-74: 14.1%
- Median household income: $92,928

9. Prior Lake, Minnesota
- % of population 65+: 14.8%
- % of labor force ages 65-74: 34.0%
- 5-year % change in labor force ages 65-74: 13.8%
- Median household income: $130,278
10. Gurnee, Illinois
- % of population 65+: 14.4%
- % of labor force ages 65-74: 36.9%
- 5-year % change in labor force ages 65-74: 13.8%
- Median household income: $121,410
See More: 6 Cash-Flow Mistakes Boomers Are Making With Their Retirement Savings

11. Jacksonville Beach, Florida
- % of population 65+: 20.3%
- % of labor force ages 65-74: 39.9%
- 5-year % change in labor force ages 65-74: 13.3%
- Median household income: $115,825

12. Milton, Georgia
- % of population 65+: 9.6%
- % of labor force ages 65-74: 42.9%
- 5-year % change in labor force ages 65-74: 13.1%
- Median household income: $151,235

13. Carrollton, Texas
- % of population 65+: 12.9%
- % of labor force ages 65-74: 45.4%
- 5-year % change in labor force ages 65-74: 12.8%
- Median household income: $99,115

14. Coconut Creek, Florida
- % of population 65+: 19.3%
- % of labor force ages 65-74: 36.3%
- 5-year % change in labor force ages 65-74: 12.8%
- Median household income: $75,516
Explore More: Here’s the Minimum Net Worth To Be Considered Middle Class in Your 60s

15. Kearny, New Jersey
- % of population 65+: 14.0%
- % of labor force ages 65-74: 38.8%
- 5-year % change in labor force ages 65-74: 12.7%
- Median household income: $83,212
16. West Springfield, Massachusetts
- % of population 65+: 16.4%
- % of labor force ages 65-74: 37.3%
- 5-year % change in labor force ages 65-74: 12.0%
- Median household income: $70,401

17. Miami Lakes, Florida
- % of population 65+: 16.2%
- % of labor force ages 65-74: 39.6%
- 5-year % change in labor force ages 65-74: 11.9%
- Median household income: $97,255

18. Niles, Illinois
- % of population 65+: 26.3%
- % of labor force ages 65-74: 32.4%
- 5-year % change in labor force ages 65-74: 11.7%
- Median household income: $78,563

19. Desert Hot Springs, California
- % of population 65+: 12.2%
- % of labor force ages 65-74: 27.9%
- 5-year % change in labor force ages 65-74: 11.6%
- Median household income: $50,349
Also Read: Trump’s Economy — Why Millennials Love It and Boomers Don’t
20. Murrysville, Pennsylvania
- % of population 65+: 29.9%
- % of labor force ages 65-74: 38.3%
- 5-year % change in labor force ages 65-74: 11.5%
- Median household income: $120,685
21. Doral, Florida
- % of population 65+: 8.3%
- % of labor force ages 65-74: 45.2%
- 5-year % change in labor force ages 65-74: 11.4%
- Median household income: $88,474
22. Kenosha, Wisconsin
- % of population 65+: 13.4%
- % of labor force ages 65-74: 29.8%
- 5-year % change in labor force ages 65-74: 11.4%
- Median household income: $68,532
23. Oak Lawn, Illinois
- % of population 65+: 18.6%
- % of labor force ages 65-74: 33.0%
- 5-year % change in labor force ages 65-74: 11.4%
- Median household income: $82,493

24. Grove City, Ohio
- % of population 65+: 18.7%
- % of labor force ages 65-74: 30.5%
- 5-year % change in labor force ages 65-74: 11.3%
- Median household income: $90,888
Check Out: 4 Retirement Expenses Boomers Didn’t Plan For — but Should Have
25. Trenton, New Jersey
- % of population 65+: 12.3%
- % of labor force ages 65-74: 28.6%
- 5-year % change in labor force ages 65-74: 11.2%
- Median household income: $47,102
26. Cleburne, Texas
- % of population 65+: 14.7%
- % of labor force ages 65-74: 30.4%
- 5-year % change in labor force ages 65-74: 11.2%
- Median household income: $66,324

27. Weatherford, Texas
- % of population 65+: 17.3%
- % of labor force ages 65-74: 34.3%
- 5-year % change in labor force ages 65-74: 11.2%
- Median household income: $78,738

28. Hobbs, New Mexico
- % of population 65+: 11.4%
- % of labor force ages 65-74: 34.9%
- 5-year % change in labor force ages 65-74: 11.1%
- Median household income: $65,691

29. Covington, Kentucky
- % of population 65+: 14.6%
- % of labor force ages 65-74: 31.3%
- 5-year % change in labor force ages 65-74: 11.0%
- Median household income: $58,814
Discover Next: How Much the Average Upper-Class Retiree Claims in Social Security Benefits at Age 65

30. Thomasville, North Carolina
- % of population 65+: 17.2%
- % of labor force ages 65-74: 27.6%
- 5-year % change in labor force ages 65-74: 10.9%
- Median household income: $58,246

31. Florissant, Missouri
- % of population 65+: 15.4%
- % of labor force ages 65-74: 31.7%
- 5-year % change in labor force ages 65-74: 10.9%
- Median household income: $66,344

32. Temple City, California
- % of population 65+: 18.8%
- % of labor force ages 65-74: 29.2%
- 5-year % change in labor force ages 65-74: 10.9%
- Median household income: $102,449

33. Rockwall, Texas
- % of population 65+: 15.3%
- % of labor force ages 65-74: 38.2%
- 5-year % change in labor force ages 65-74: 10.8%
- Median household income: $114,926

34. Huntington Park, California
- % of population 65+: 11.4%
- % of labor force ages 65-74: 32.2%
- 5-year % change in labor force ages 65-74: 10.8%
- Median household income: $56,952
Learn More: Here’s How Much You Need To Retire With a $100K Lifestyle
35. Marshalltown, Iowa
- % of population 65+: 16.9%
- % of labor force ages 65-74: 28.9%
- 5-year % change in labor force ages 65-74: 10.6%
- Median household income: $68,854

36. Rogers, Arkansas
- % of population 65+: 11.3%
- % of labor force ages 65-74: 28.0%
- 5-year % change in labor force ages 65-74: 10.5%
- Median household income: $82,993

37. Coachella, California
- % of population 65+: 9.1%
- % of labor force ages 65-74: 18.3%
- 5-year % change in labor force ages 65-74: 10.5%
- Median household income: $67,558
38. Westfield, New Jersey
- % of population 65+: 14.7%
- % of labor force ages 65-74: 42.2%
- 5-year % change in labor force ages 65-74: 10.4%
- Median household income: $212,700

39. Mount Vernon, New York
- % of population 65+: 18.1%
- % of labor force ages 65-74: 39.5%
- 5-year % change in labor force ages 65-74: 10.3%
- Median household income: $77,171
Find Out: How Much the Average Middle Class Retiree Spends Monthly at Age 68

40. Clovis, New Mexico
- % of population 65+: 13.0%
- % of labor force ages 65-74: 25.9%
- 5-year % change in labor force ages 65-74: 10.3%
- Median household income: $54,029
41. Chino, California
- % of population 65+: 12.1%
- % of labor force ages 65-74: 27.4%
- 5-year % change in labor force ages 65-74: 10.1%
- Median household income: $103,845

42. Orem, Utah
- % of population 65+: 9.9%
- % of labor force ages 65-74: 39.0%
- 5-year % change in labor force ages 65-74: 9.9%
- Median household income: $81,292

43. Atlantic City, New Jersey
- % of population 65+: 16.3%
- % of labor force ages 65-74: 30.7%
- 5-year % change in labor force ages 65-74: 9.9%
- Median household income: $36,220

44. Tupelo, Mississippi
- % of population 65+: 16.1%
- % of labor force ages 65-74: 32.3%
- 5-year % change in labor force ages 65-74: 9.9%
- Median household income: $66,314
Great Question: What Is a Good Monthly Retirement Income?

45. Franklin, Massachusetts
- % of population 65+: 14.0%
- % of labor force ages 65-74: 36.4%
- 5-year % change in labor force ages 65-74: 9.9%
- Median household income: $142,788

46. Aliso Viejo, California
- % of population 65+: 10.5%
- % of labor force ages 65-74: 47.7%
- 5-year % change in labor force ages 65-74: 9.8%
- Median household income: $137,970

47. Murrieta, California
- % of population 65+: 12.5%
- % of labor force ages 65-74: 29.1%
- 5-year % change in labor force ages 65-74: 9.8%
- Median household income: $109,780

48. Los Gatos, California
- % of population 65+: 20.1%
- % of labor force ages 65-74: 40.6%
- 5-year % change in labor force ages 65-74: 9.8%
- Median household income: $207,891

49. Gillette, Wyoming
- % of population 65+: 11.9%
- % of labor force ages 65-74: 30.0%
- 5-year % change in labor force ages 65-74: 9.8%
- Median household income: $90,699
50. Grand Forks, North Dakota
- % of population 65+: 13.6%
- % of labor force ages 65-74: 37.9%
- 5-year % change in labor force ages 65-74: 9.8%
- Median household income: $63,838
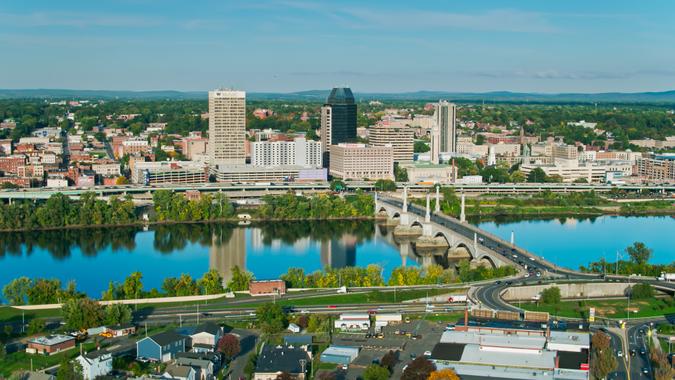
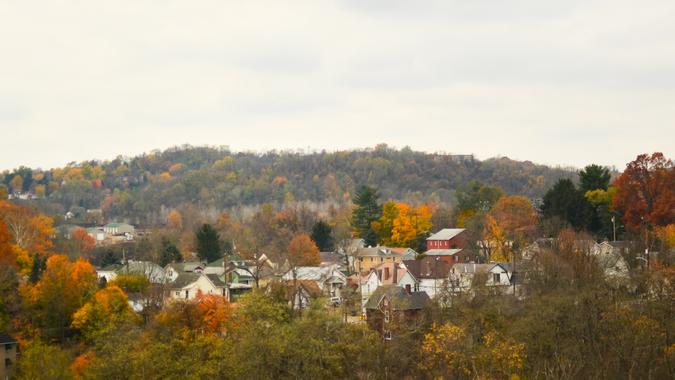
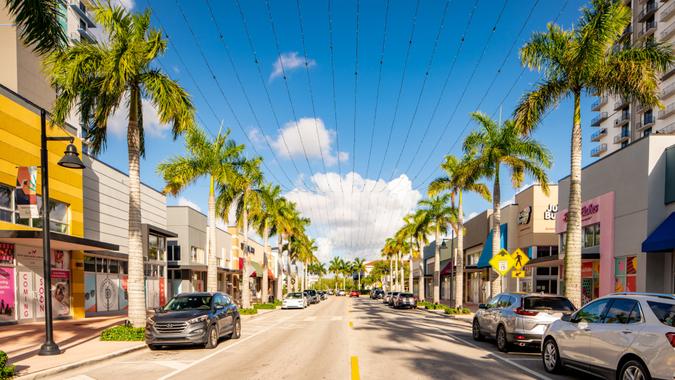
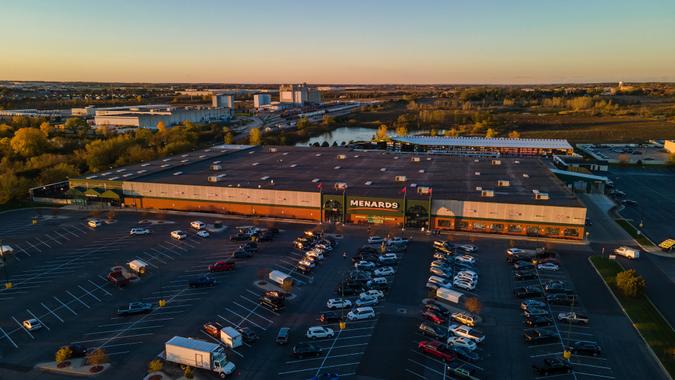
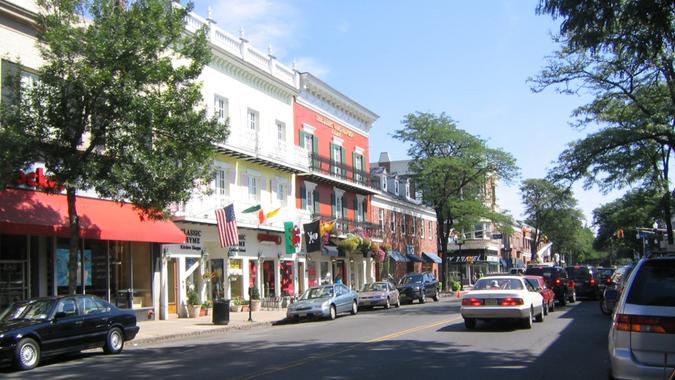
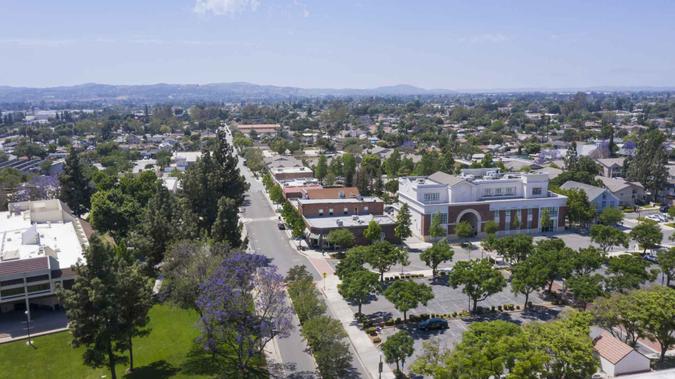
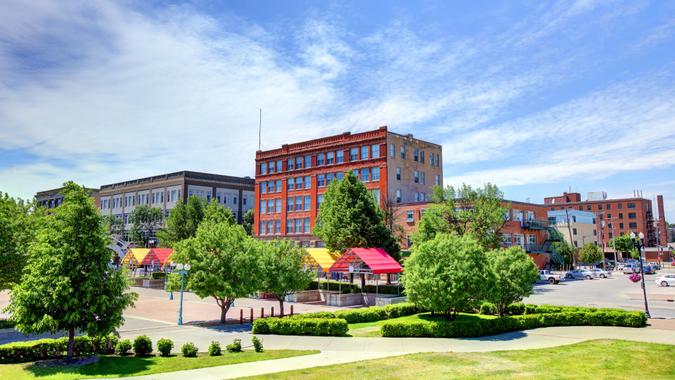
Editor’s note: Photos are for representational purposes only and might not reflect the exact locations listed.
Methodology: Using data from the 2018 and 2023 5-year U.S. Census American Community Surveys, the population and labor force participation rate was sourced for the population ages 65-74. To qualify for this study, a location had to have a population of at least 2,500 for ages 65-74. Census Designated Places (CDPs) were also not considered for this study. The top 50 locations with the highest increase in labor force participation rate for ages 65-74 were identified. For each location a number of factors were found including; total population, population ages 65+, total households, and median household income were also sourced from the 2018 and 2023 US Census ACS. The cities were sorted to show the largest 5-year increase in labor force participation for ages 65 to 74. All data was collected on Nov. 21, 2025.
More From GOBankingRates
This article originally appeared on GOBankingRates.com: 50 Cities Where More Americans Are Working Past Age 65