Zillow Group Inc. (NASDAQ:Z) shares are pushing higher after the company announced strong fourth-quarter financial results. Zillow reported quarterly revenue of $3.88 billion, which beat the $2.78 billion estimate. Internet, media and tech revenue grew 14% year-over-year to $483 million and mortgage revenue came in at $51 million for the quarter.
Zillow was up 14.06% at $54.59 Friday afternoon.
Zillow Daily Chart Analysis
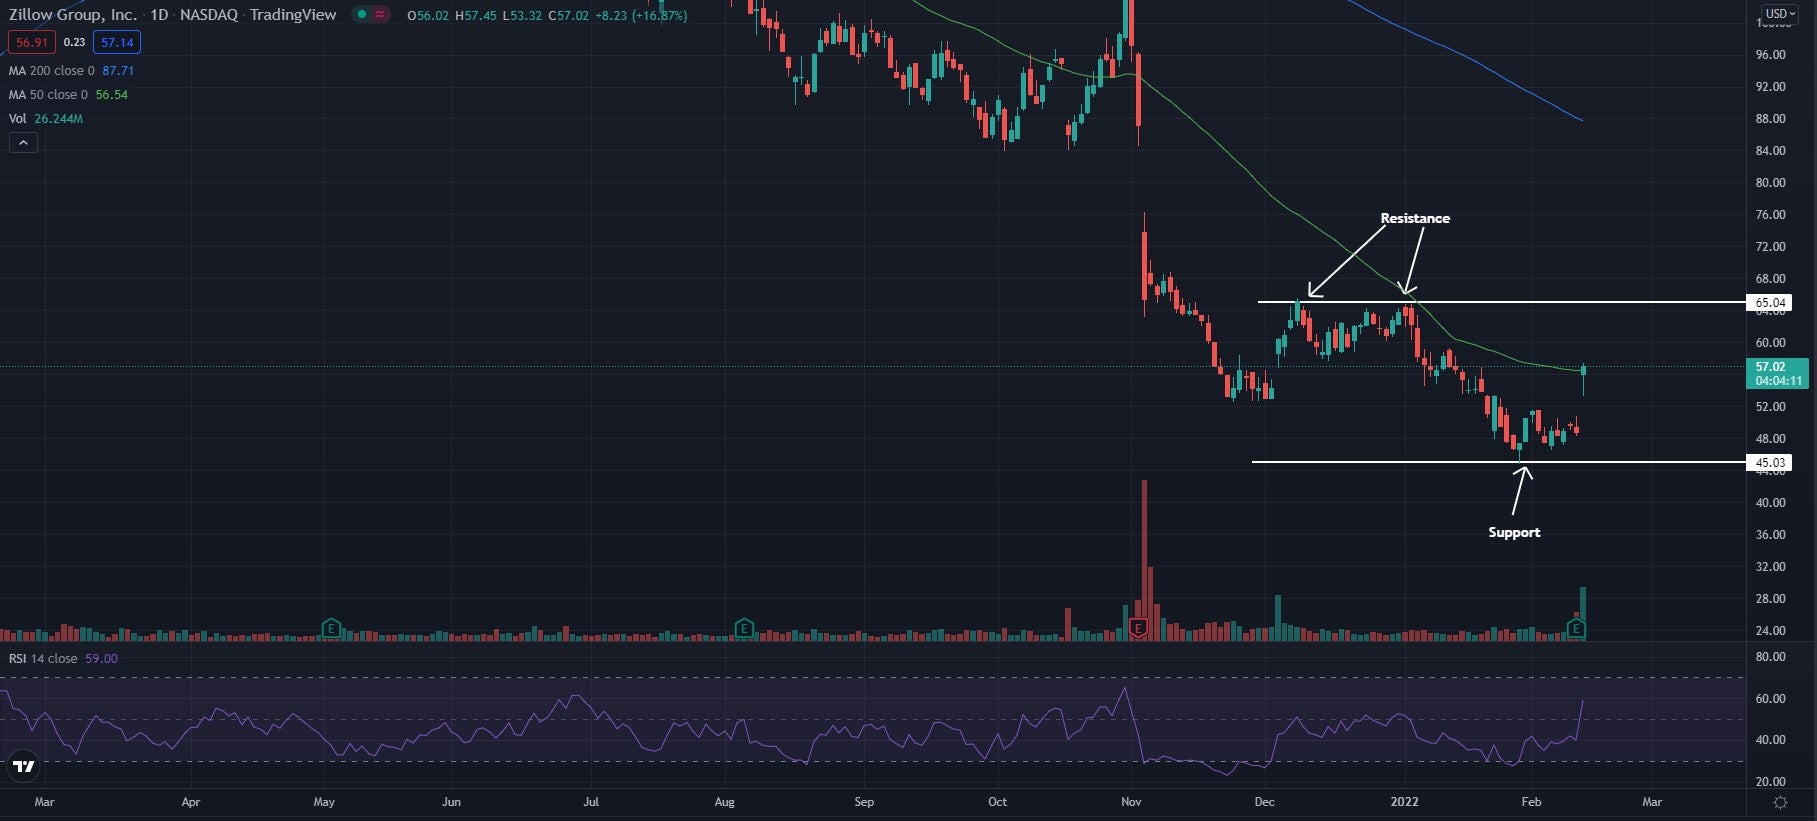
- Shares have been ripping higher and are pushing toward resistance in what traders call a sideways channel. The stock is showing an area of resistance near the $65 level, and is showing that it has held support near the $45 level. These levels may continue to hold in the future until one of the levels is broken.
- The stock is trading above the 50-day moving average (green) but below the 200-day moving average (blue), indicating the stock looks to be consolidating. The 50-day moving average may hold as an area of support while the 200-day moving average may act as an area of resistance.
- The Relative Strength Index (RSI) has been pushing higher the past few days and now sits at 58. This shows that the stock is now seeing more buying pressure than it is selling pressure and possibly showing a sign of reversal.

What’s Next For Zillow?
The stock has recently formed an area of support and resistance after showing levels where it was unable to cross above and below in recent weeks. Bullish traders are looking to see the stock form higher lows and go on to break above the $65 resistance.
Bulls are then looking to see the stock hold this level as an area of support and then continue on its bullish run. Bearish traders are looking to see the stock fall back to the $45 level and crack below it. If this level holds as resistance, the stock will likely see a further bearish push.
Photo courtesy of Zillow.


