To many cyclists, lusting after high-end road bikes is as much a part of the allure of our sport as actually riding.
These machines can be expensive - often prohibitively so - but they remain undeniably exciting, leading to the whiling away of many a lunch break browsing your favourite cycling magazine or website.
Even if our budget doesn't allow us to shop with legitimate intent, trickle-down technology means that the cutting-edge innovations we covet today may become accessible to us in the future. So captivated we are that we continue to browse, even if purchasing a new bike isn't on the horizon at all.
For a long time, the major selling point of a road bike was its weight. Aerodynamics had grown in importance, but it wasn't until the early 2010s that manufacturers really started investing in 'aero' when designing bikes. Soon after, the aero road bike category was born.
For a time, this meant brands often had two race bikes in their stable; one for climbing mountains and another for sprinters or flatter terrain. Some even had a third 'endurance' bike, which were favoured by amateurs and occasionally raced on the cobbled roads of the Spring Classics.
Many still operate that three-bike stable, but things have moved on a little. Aero bikes have become lighter, lightweight bikes have become more aero, and some brands have even converged the two into a single 'one bike to rule them all'.
While you'd think that makes things simple when buying, the truth is that buying a road bike can still be complicated.
Nowadays, it's rare to find a new bike launch without aerodynamic claims that look something like "10 watts faster at 40km/h," or "27 seconds faster over 40km." In isolation, those claims can be handy, but they rarely help us get a sense of the bigger picture.
Often, brands will compare their latest launch with their own outgoing model; or another bike in their range. Almost never will you see a brand compare its bike to the competition, but this is we suspect down to legal reasons or differences in testing protocols; you can bet your bottom dollar they're all doing competitor analysis.
That's where we come in.
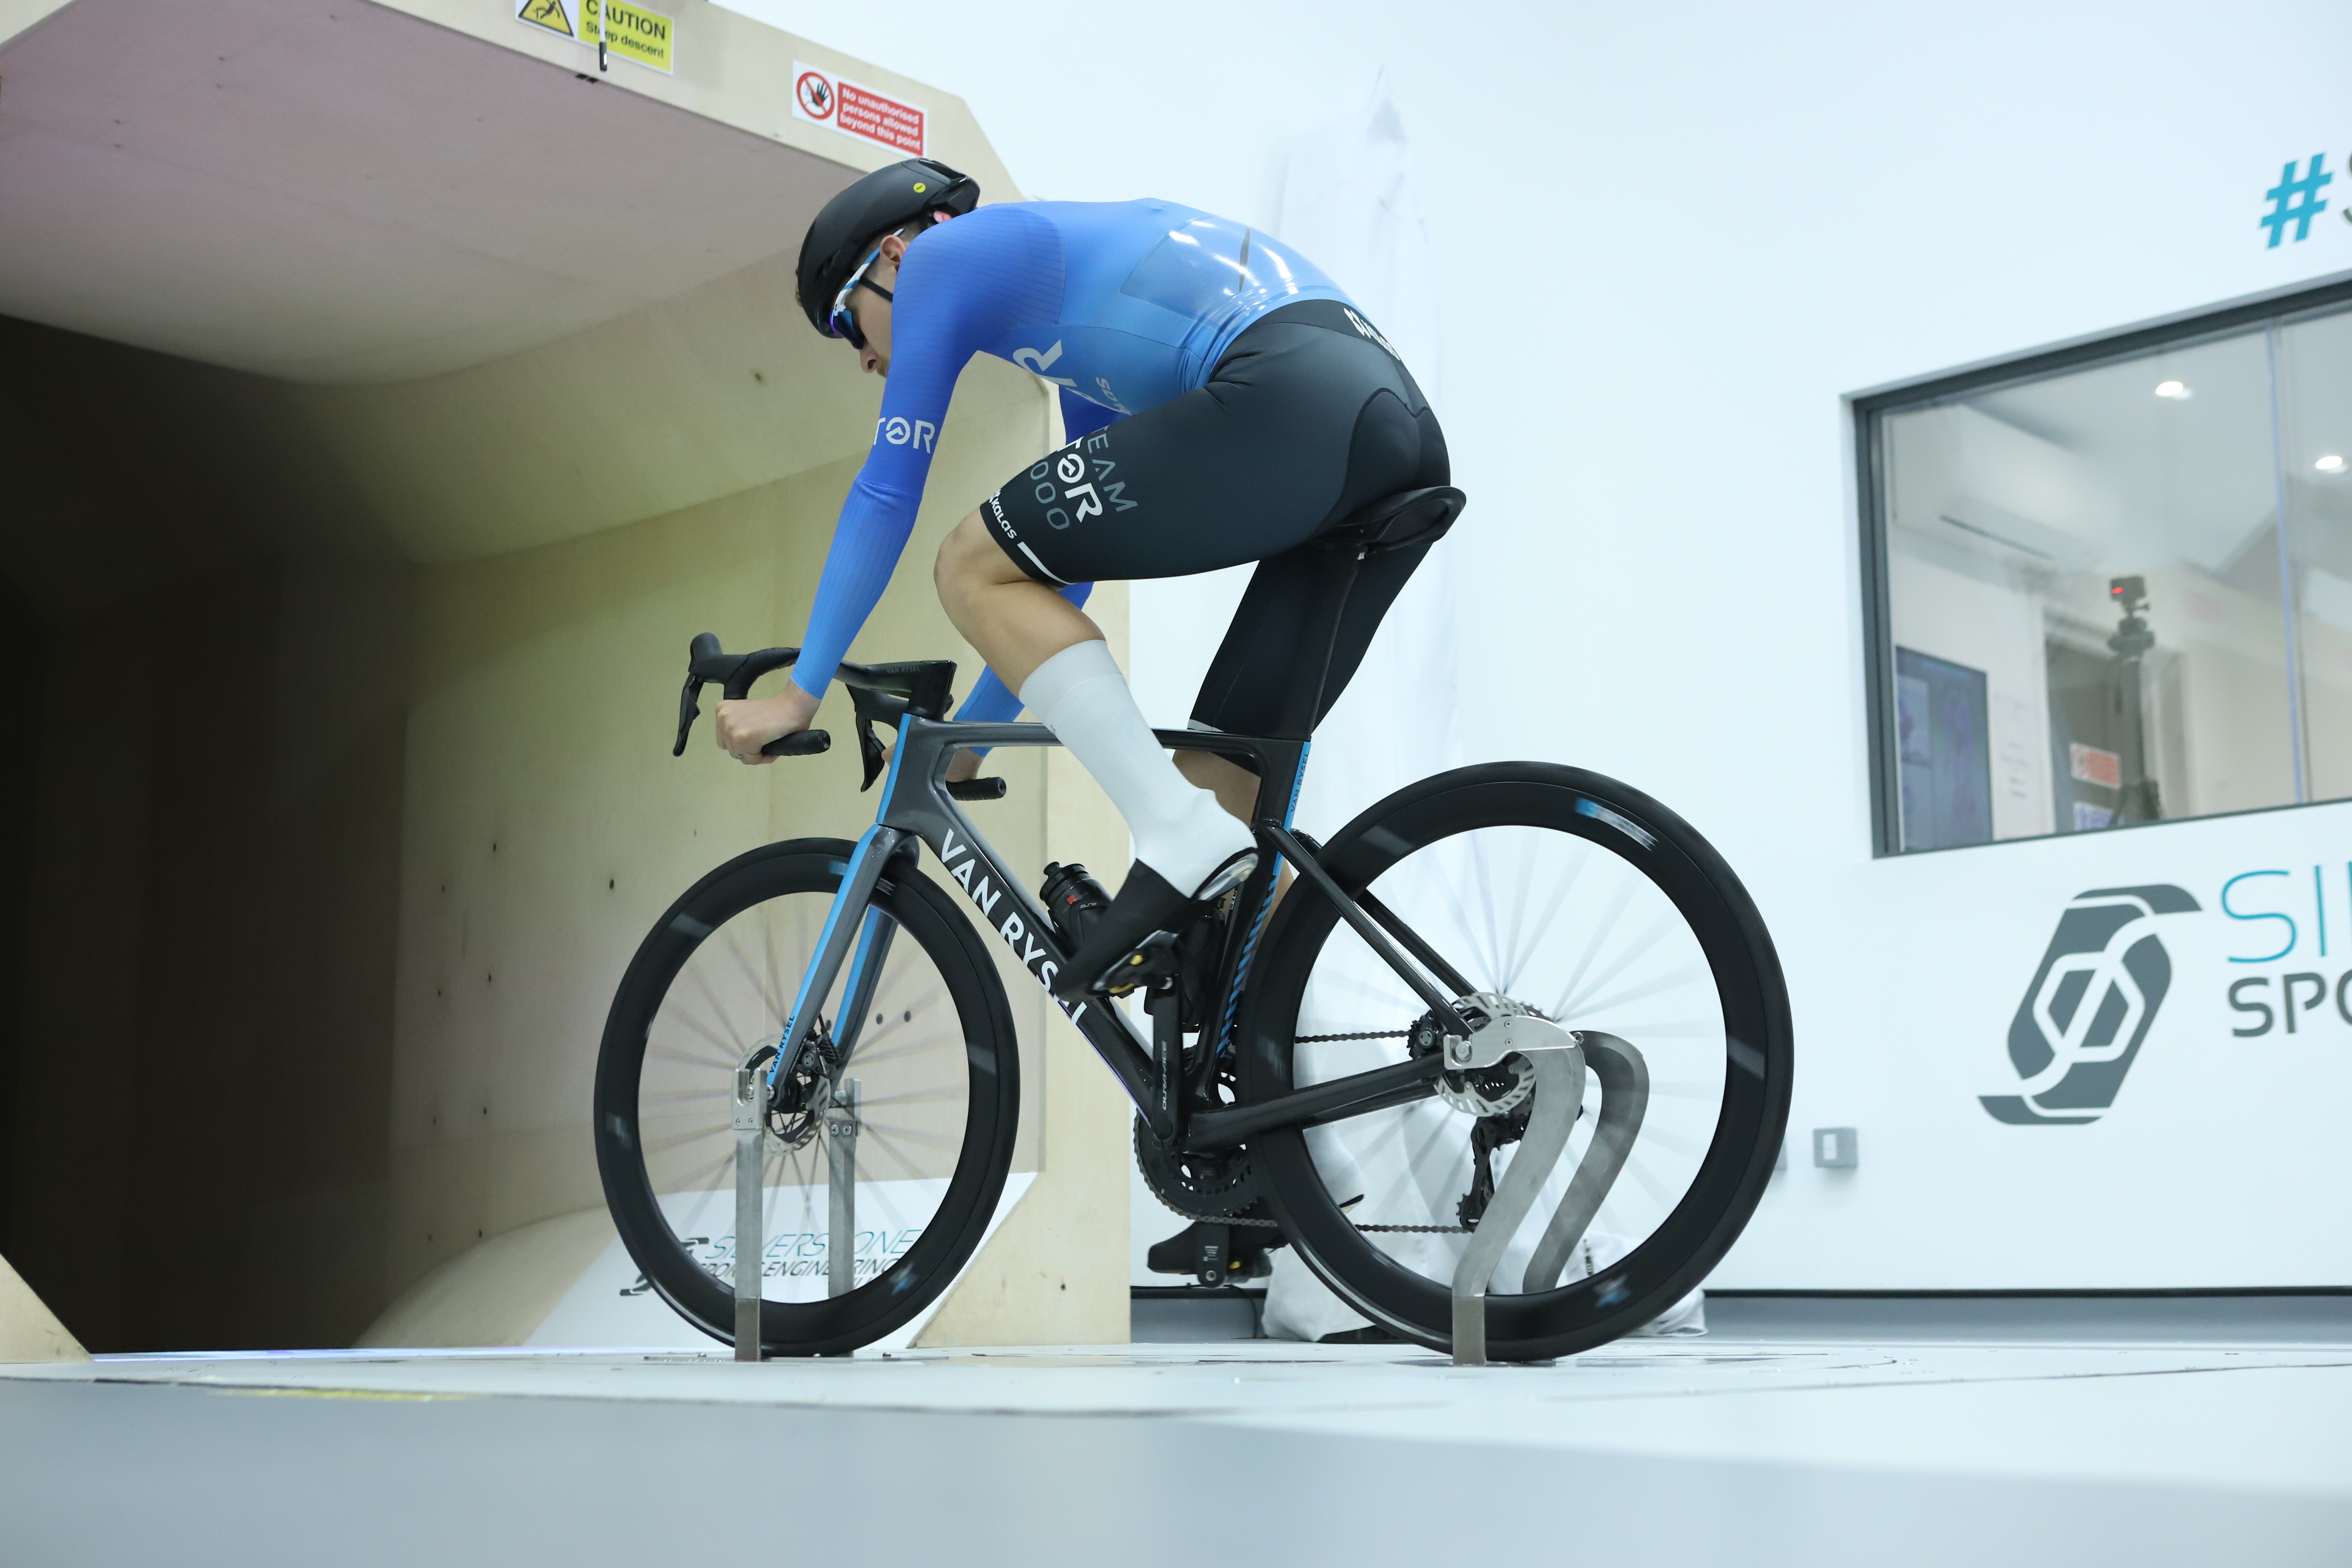
We took 11 of today's best road bikes (as well as an old rim-brake bike from 2015 as a baseline) to the wind tunnel for a back-to-back test to find out which was fastest, which was slowest, and how much faster they are than that baseline. We also ran some additional tests on position and wheel upgrades, which we will share in the coming weeks.
Before we get into the thick of it, a quick interlude to say that this feature is not sponsored. We paid the normal commercial rate for our wind tunnel access and bought or borrowed everything used in the test. This content was made possible solely and entirely by our paying subscribers.
The Bikes
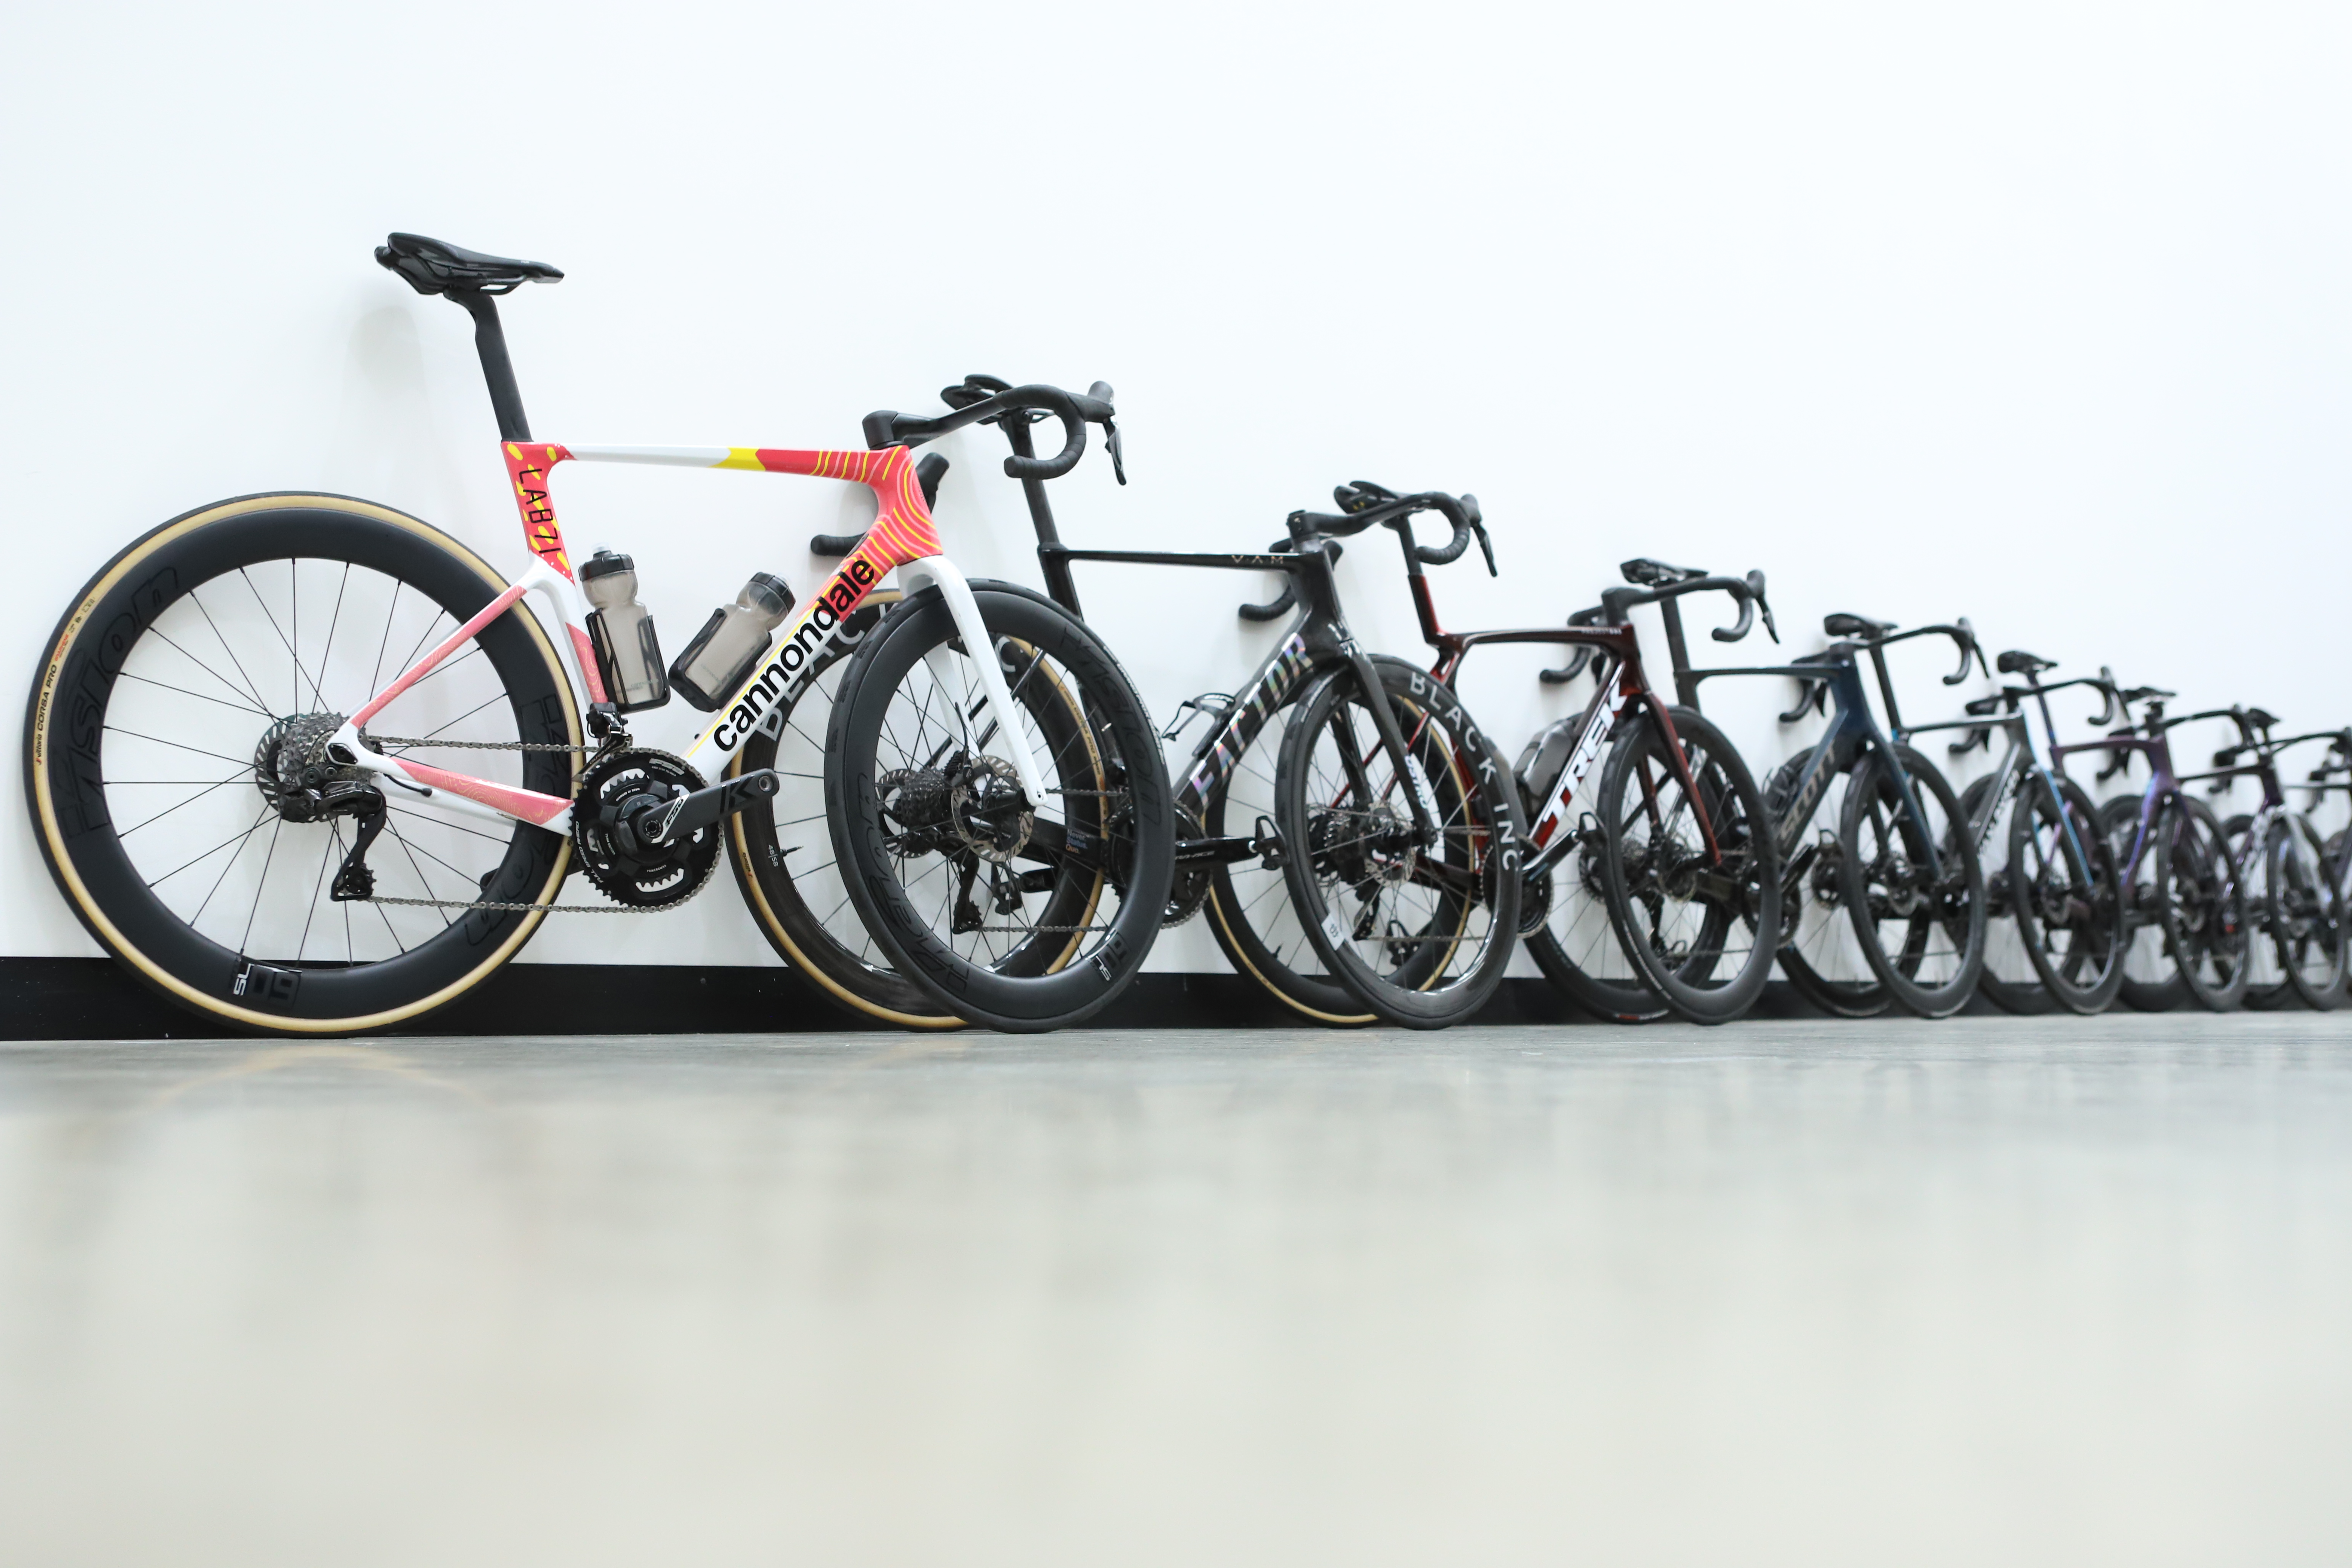
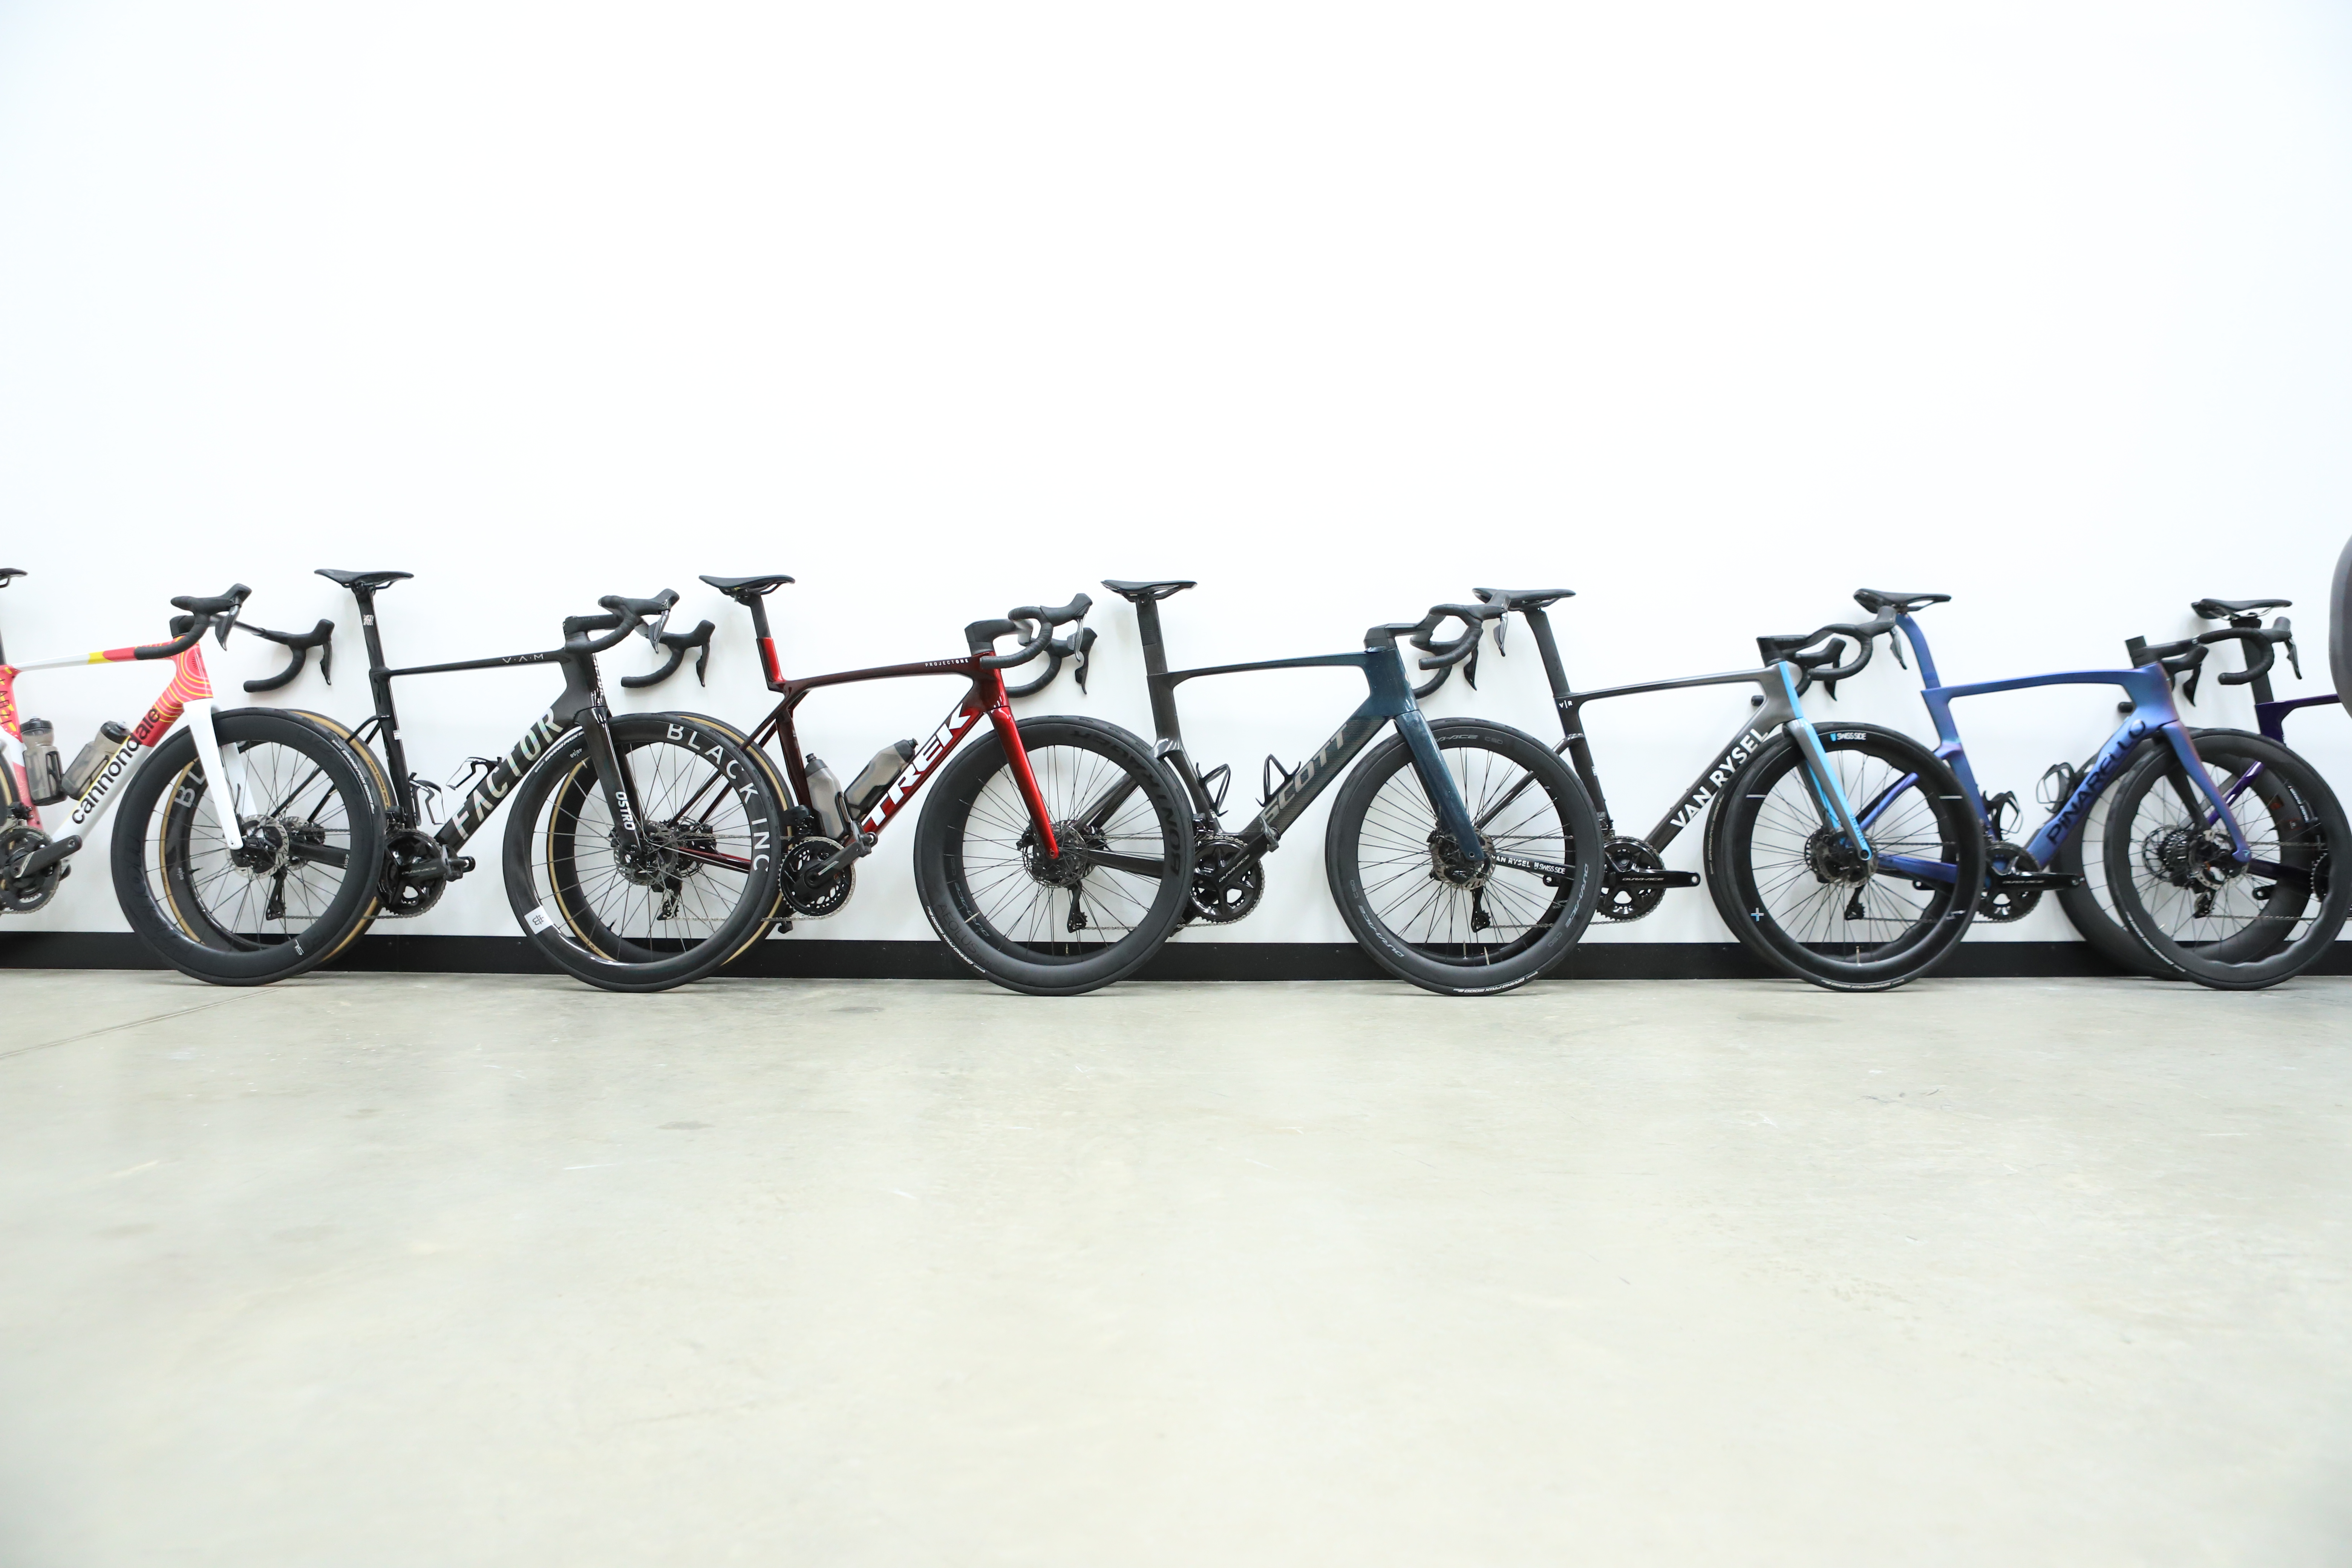
Our aim was to have a selection of high-end road bikes that offered a balance between what consumers might be looking to buy, and a reflection of the bikes seen in today's WorldTour peloton. We wanted a similar-level of bike from each brand, because although the aerodynamic difference between two groupsets will be negligible, we find that in some cases Dura-Ace / SRAM Red level bikes are specced with one-piece cockpits whereas cheaper models have two-piece bar and stem setups. The same goes for high-end wheels with bladed spokes.
Some of the bikes in the test are 'all out aero', such as the Cervélo S5 and the Scott Foil, whereas others fall more in the 'aero all-rounder' category, such as the Specialized Tarmac and the new Trek Madone.
Where brands offered both an aero model and an aero all-rounder, such as Cannondale with the SystemSix and SuperSix Evo respectively, we chose the bike that was more commonly raced in the WorldTour.
In alphabetical order, the bikes are as follows:
- Cannondale SuperSix Evo 4 Hi-Mod Team Edition
- Canyon Aeroad CFR
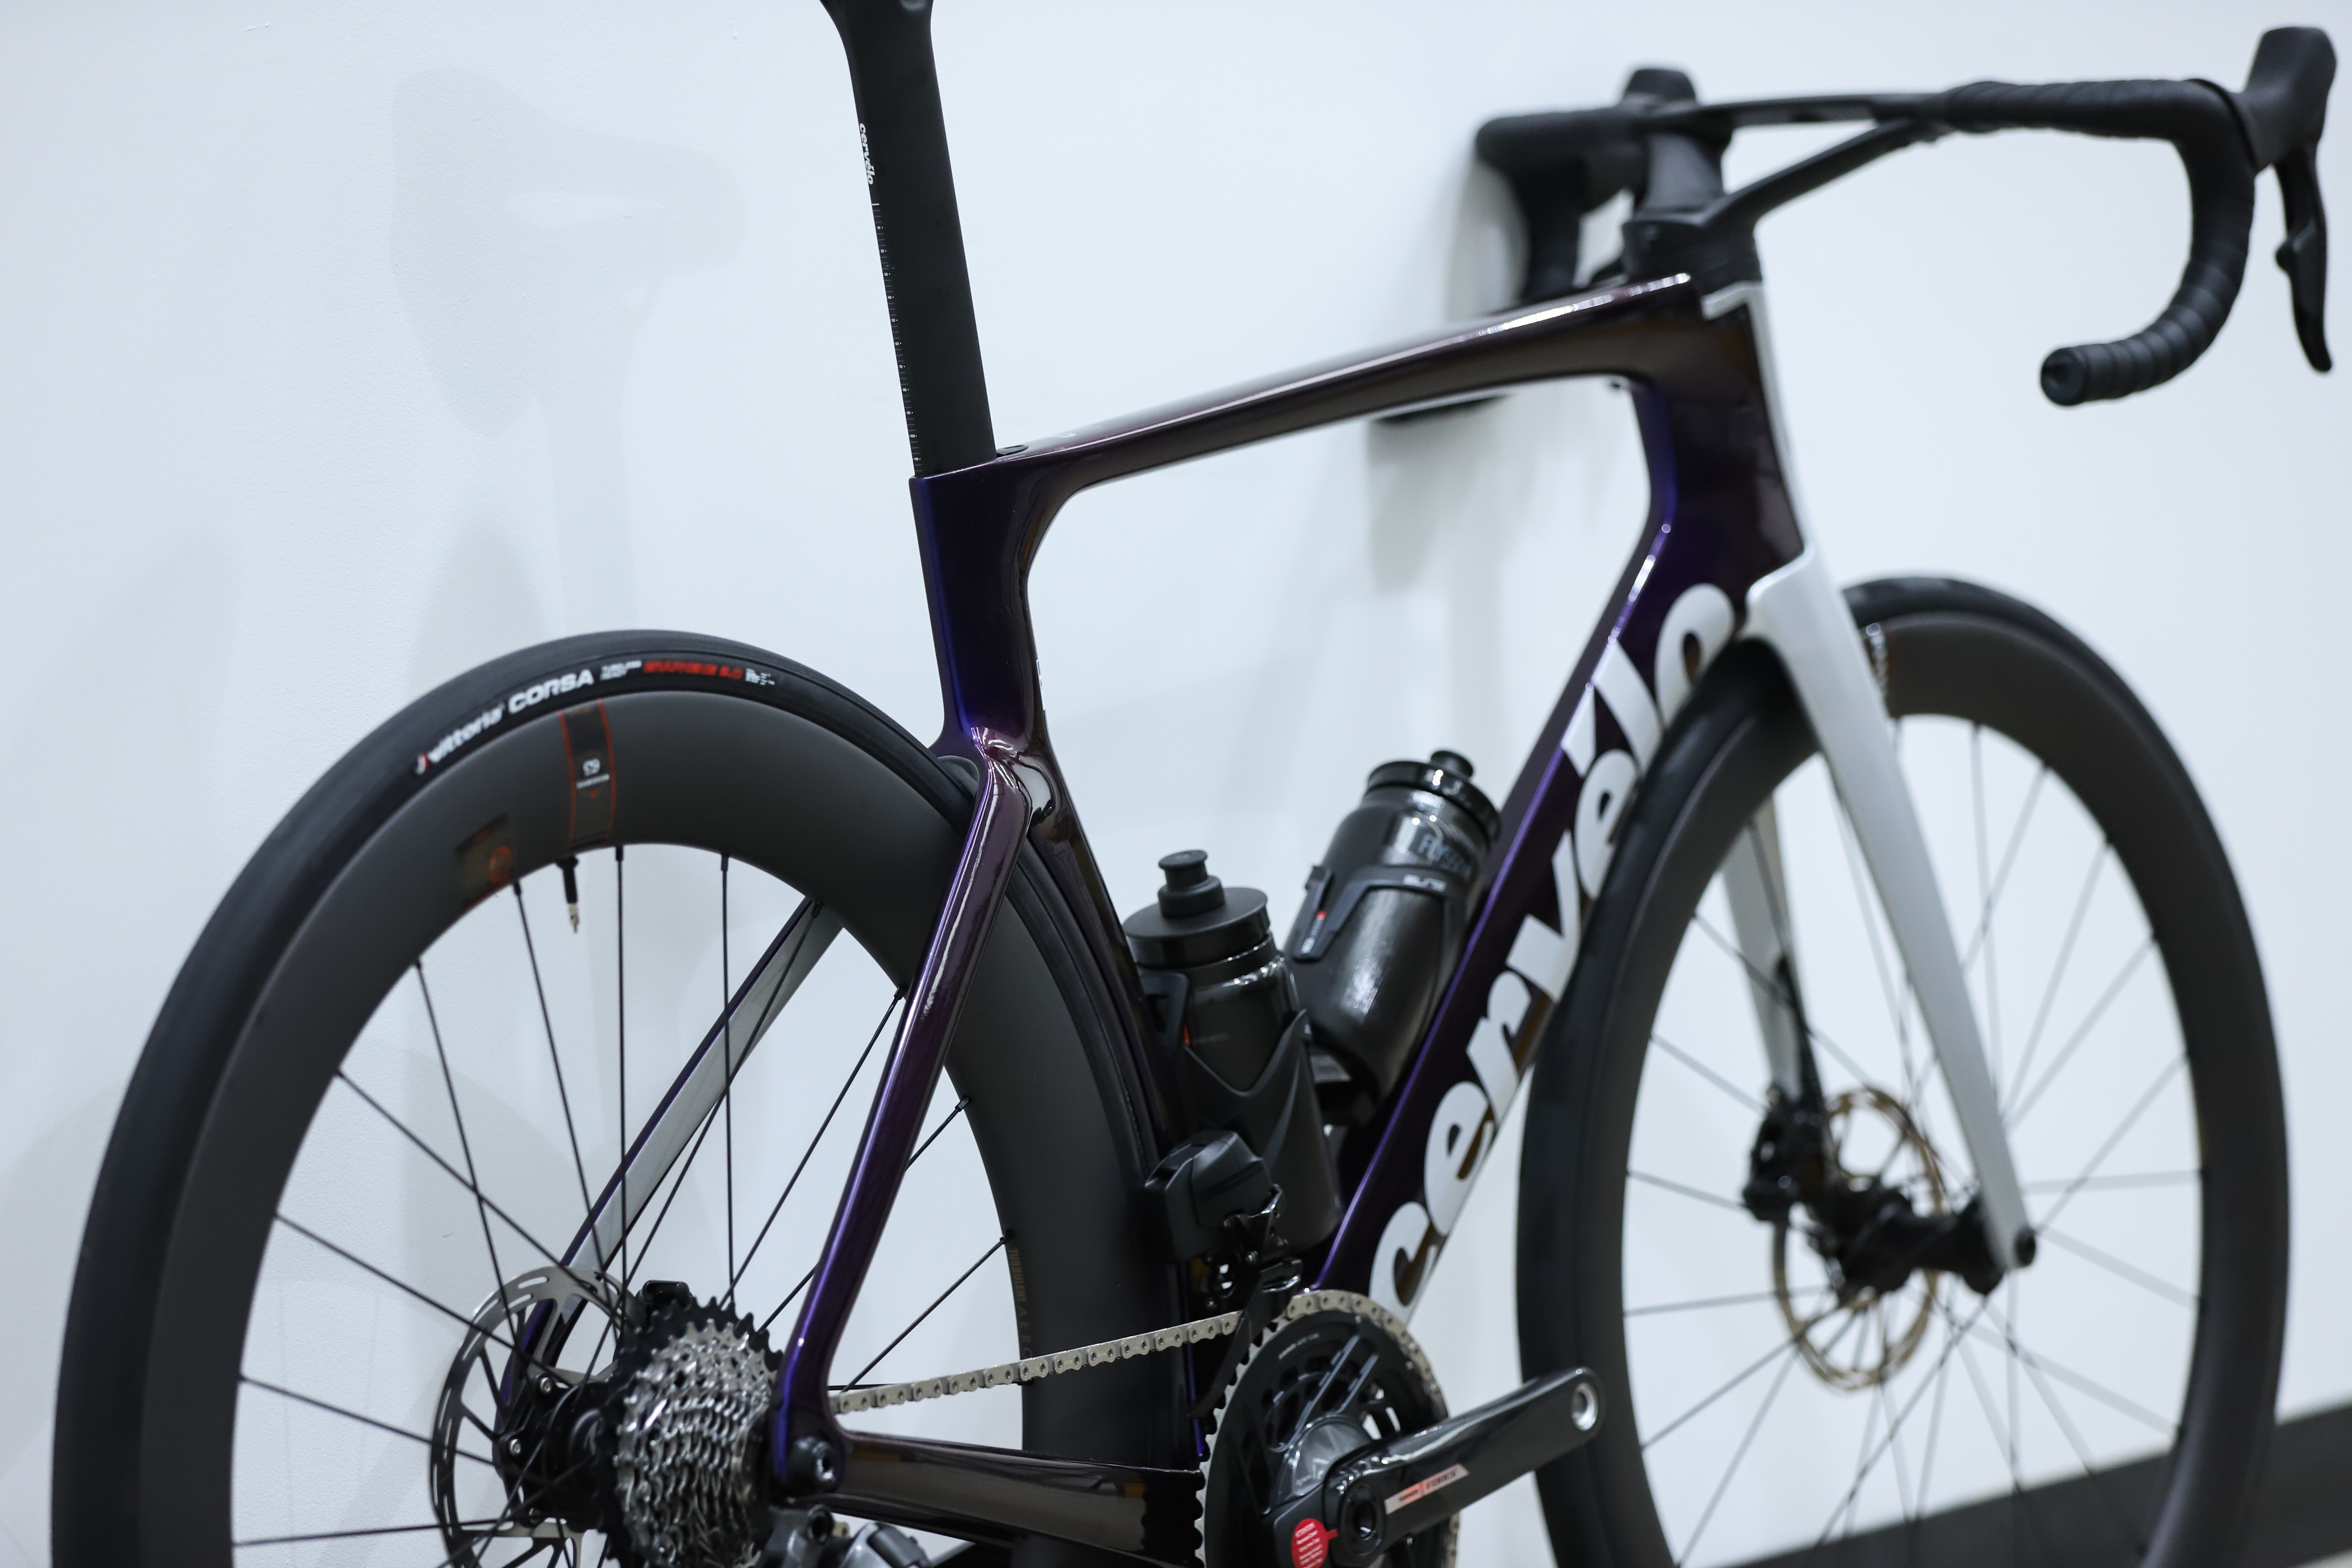
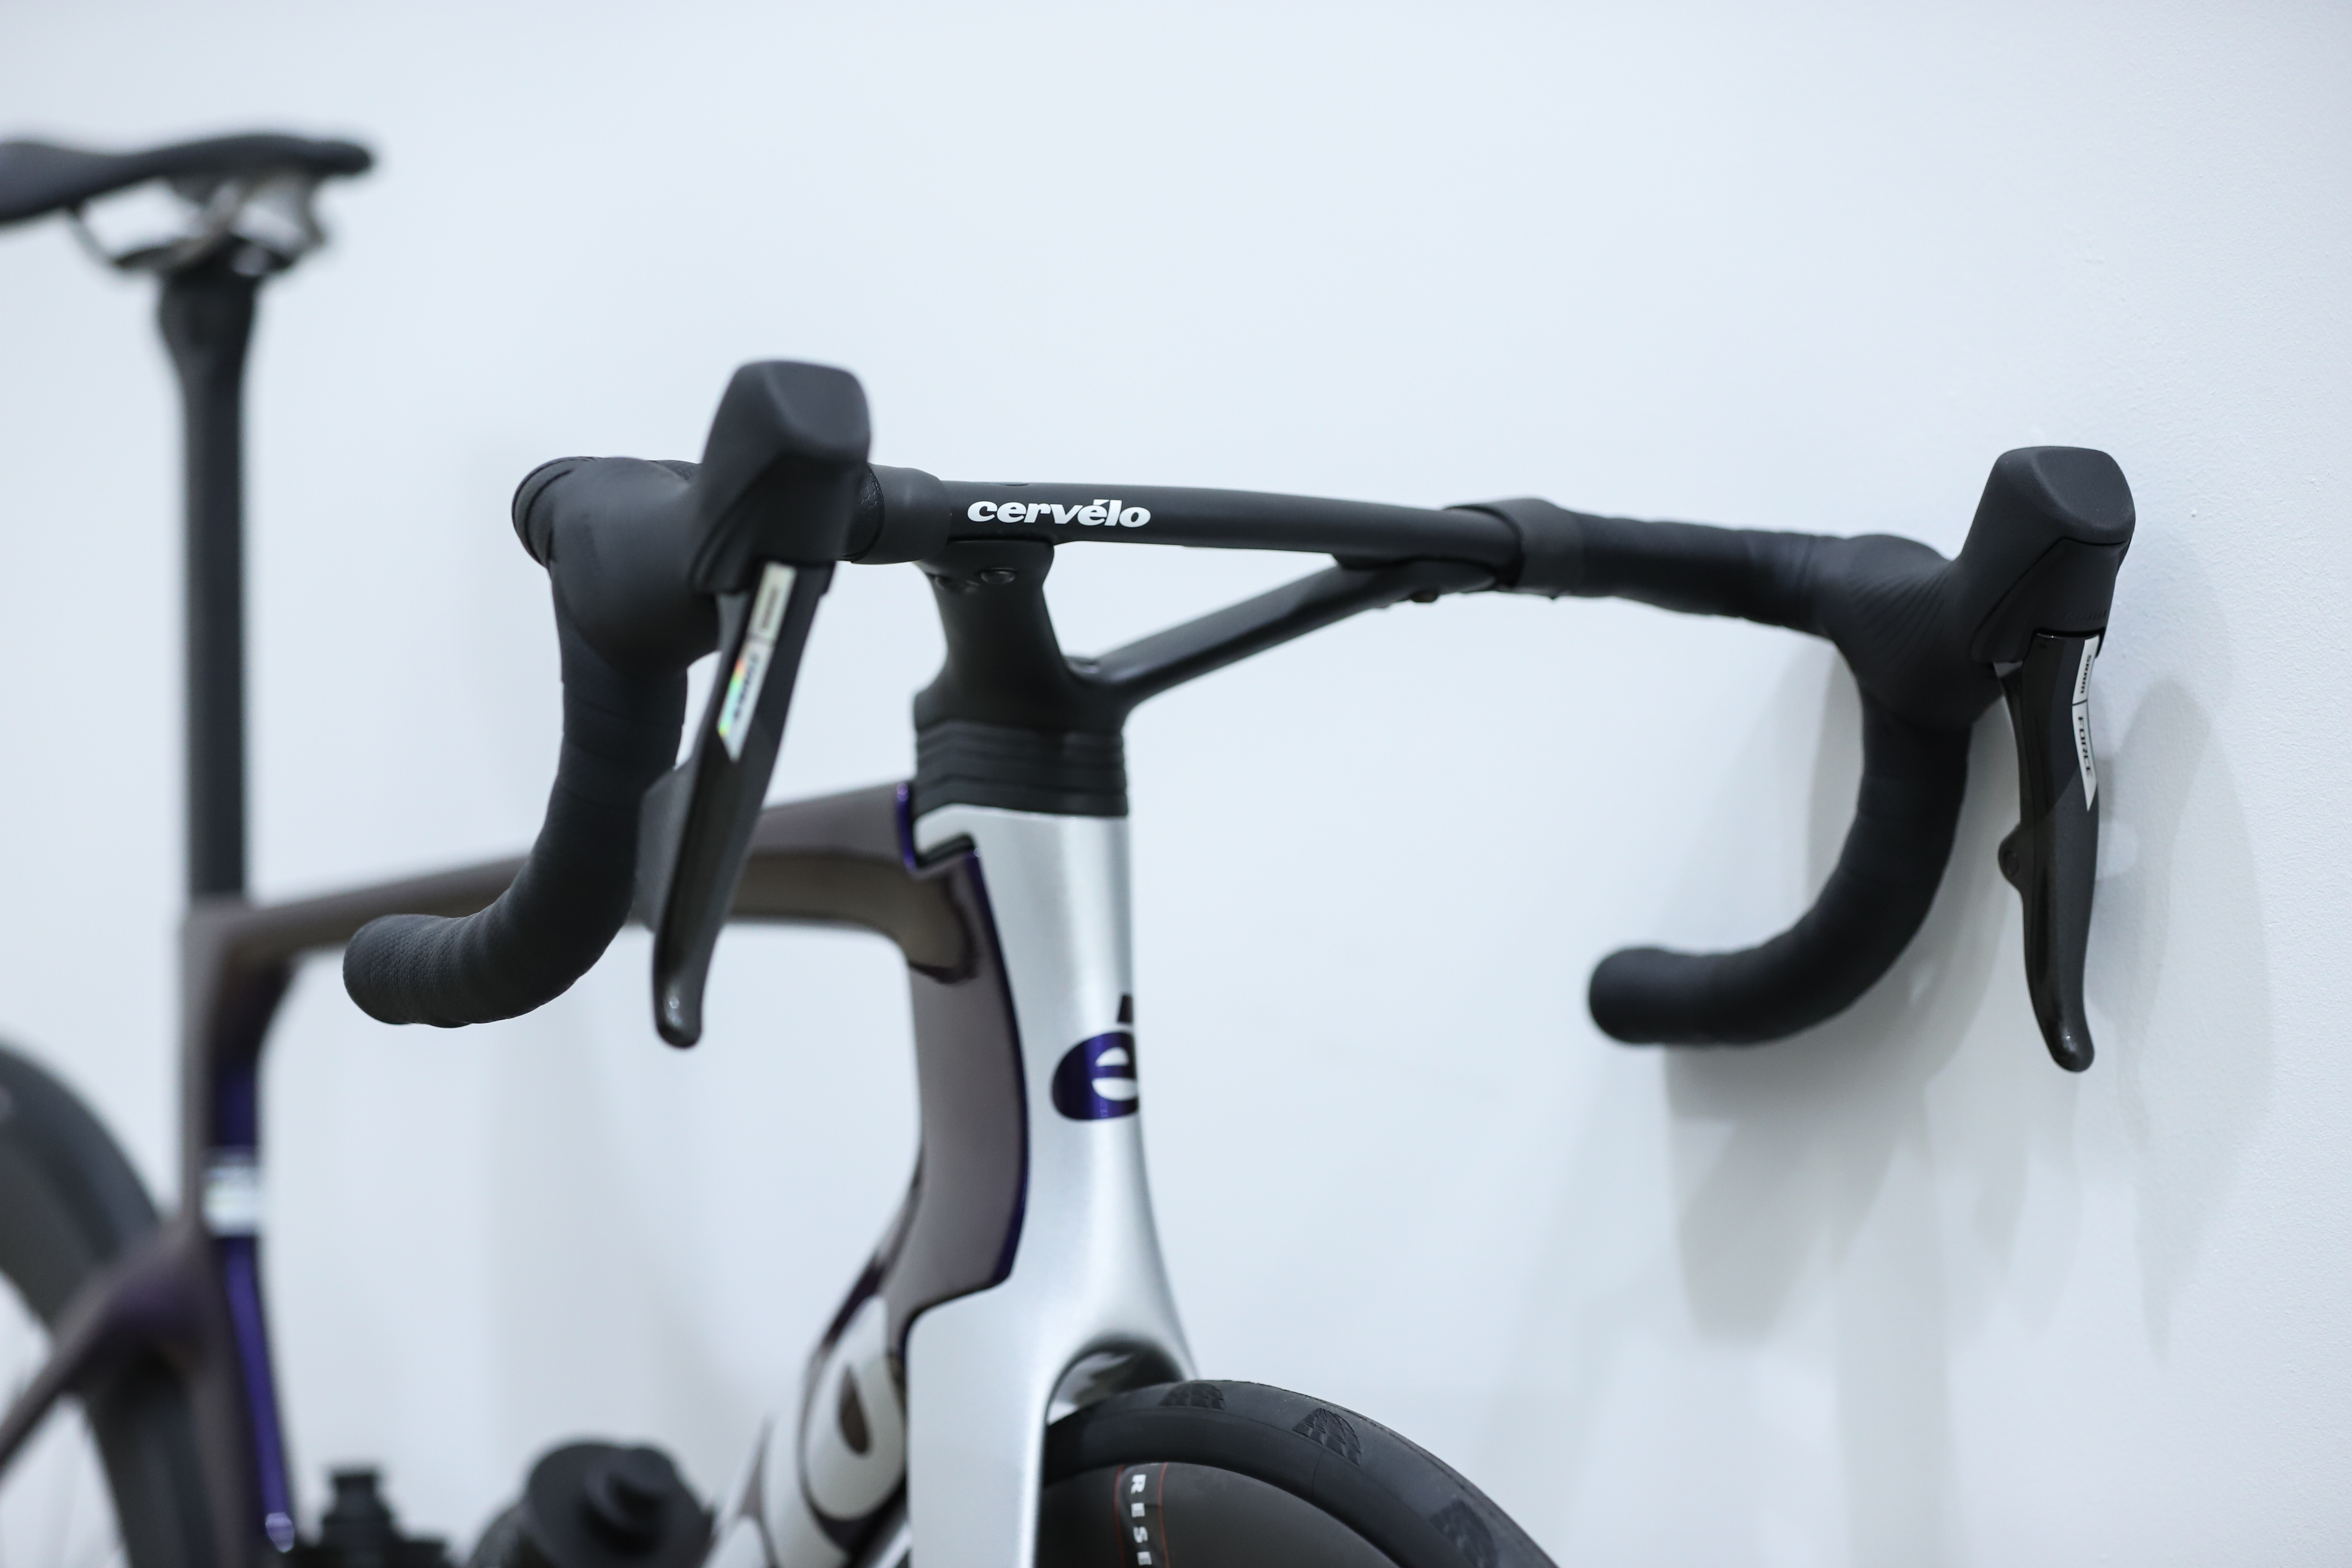
- Cervélo S5
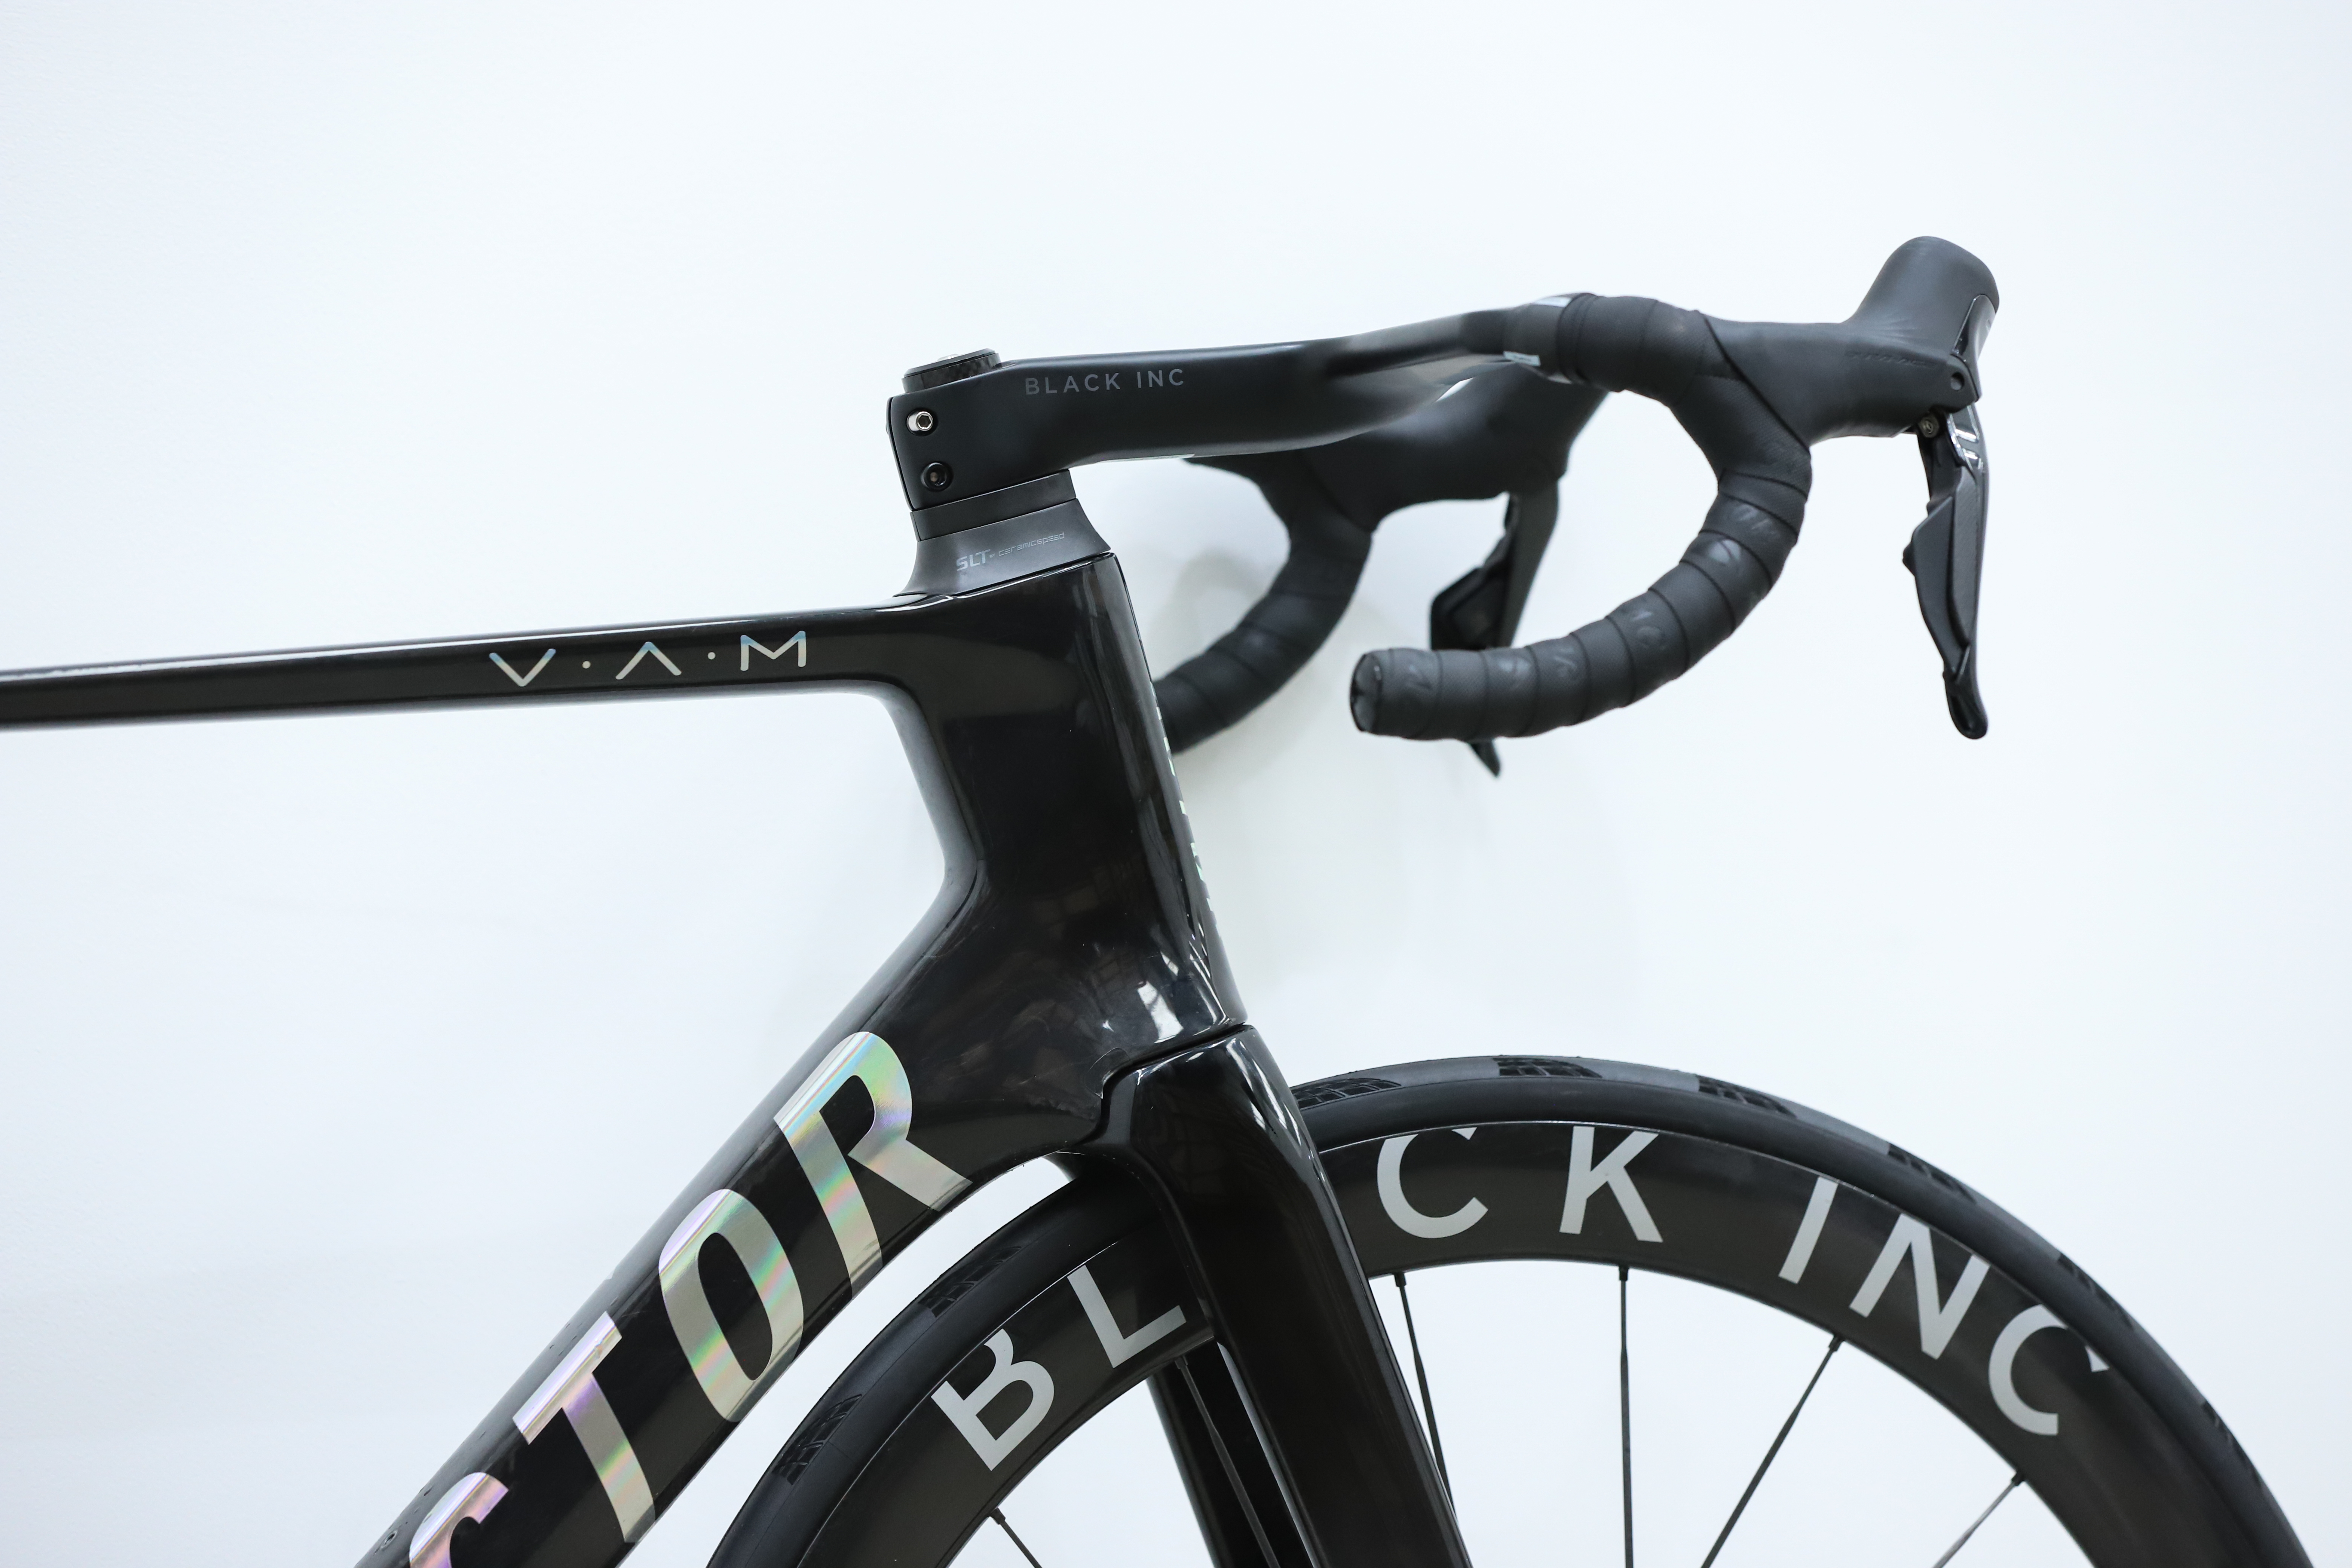
- Factor OSTRO VAM
- Giant Propel Advanced SL 0
- Look 795 Blade RS
- Pinarello Dogma F
- Scott Foil RC Pro
- Specialized S-Works Tarmac SL8
- Trek Madone SLR 7 Gen 8
- Van Rysel RCR Pro Team Replica
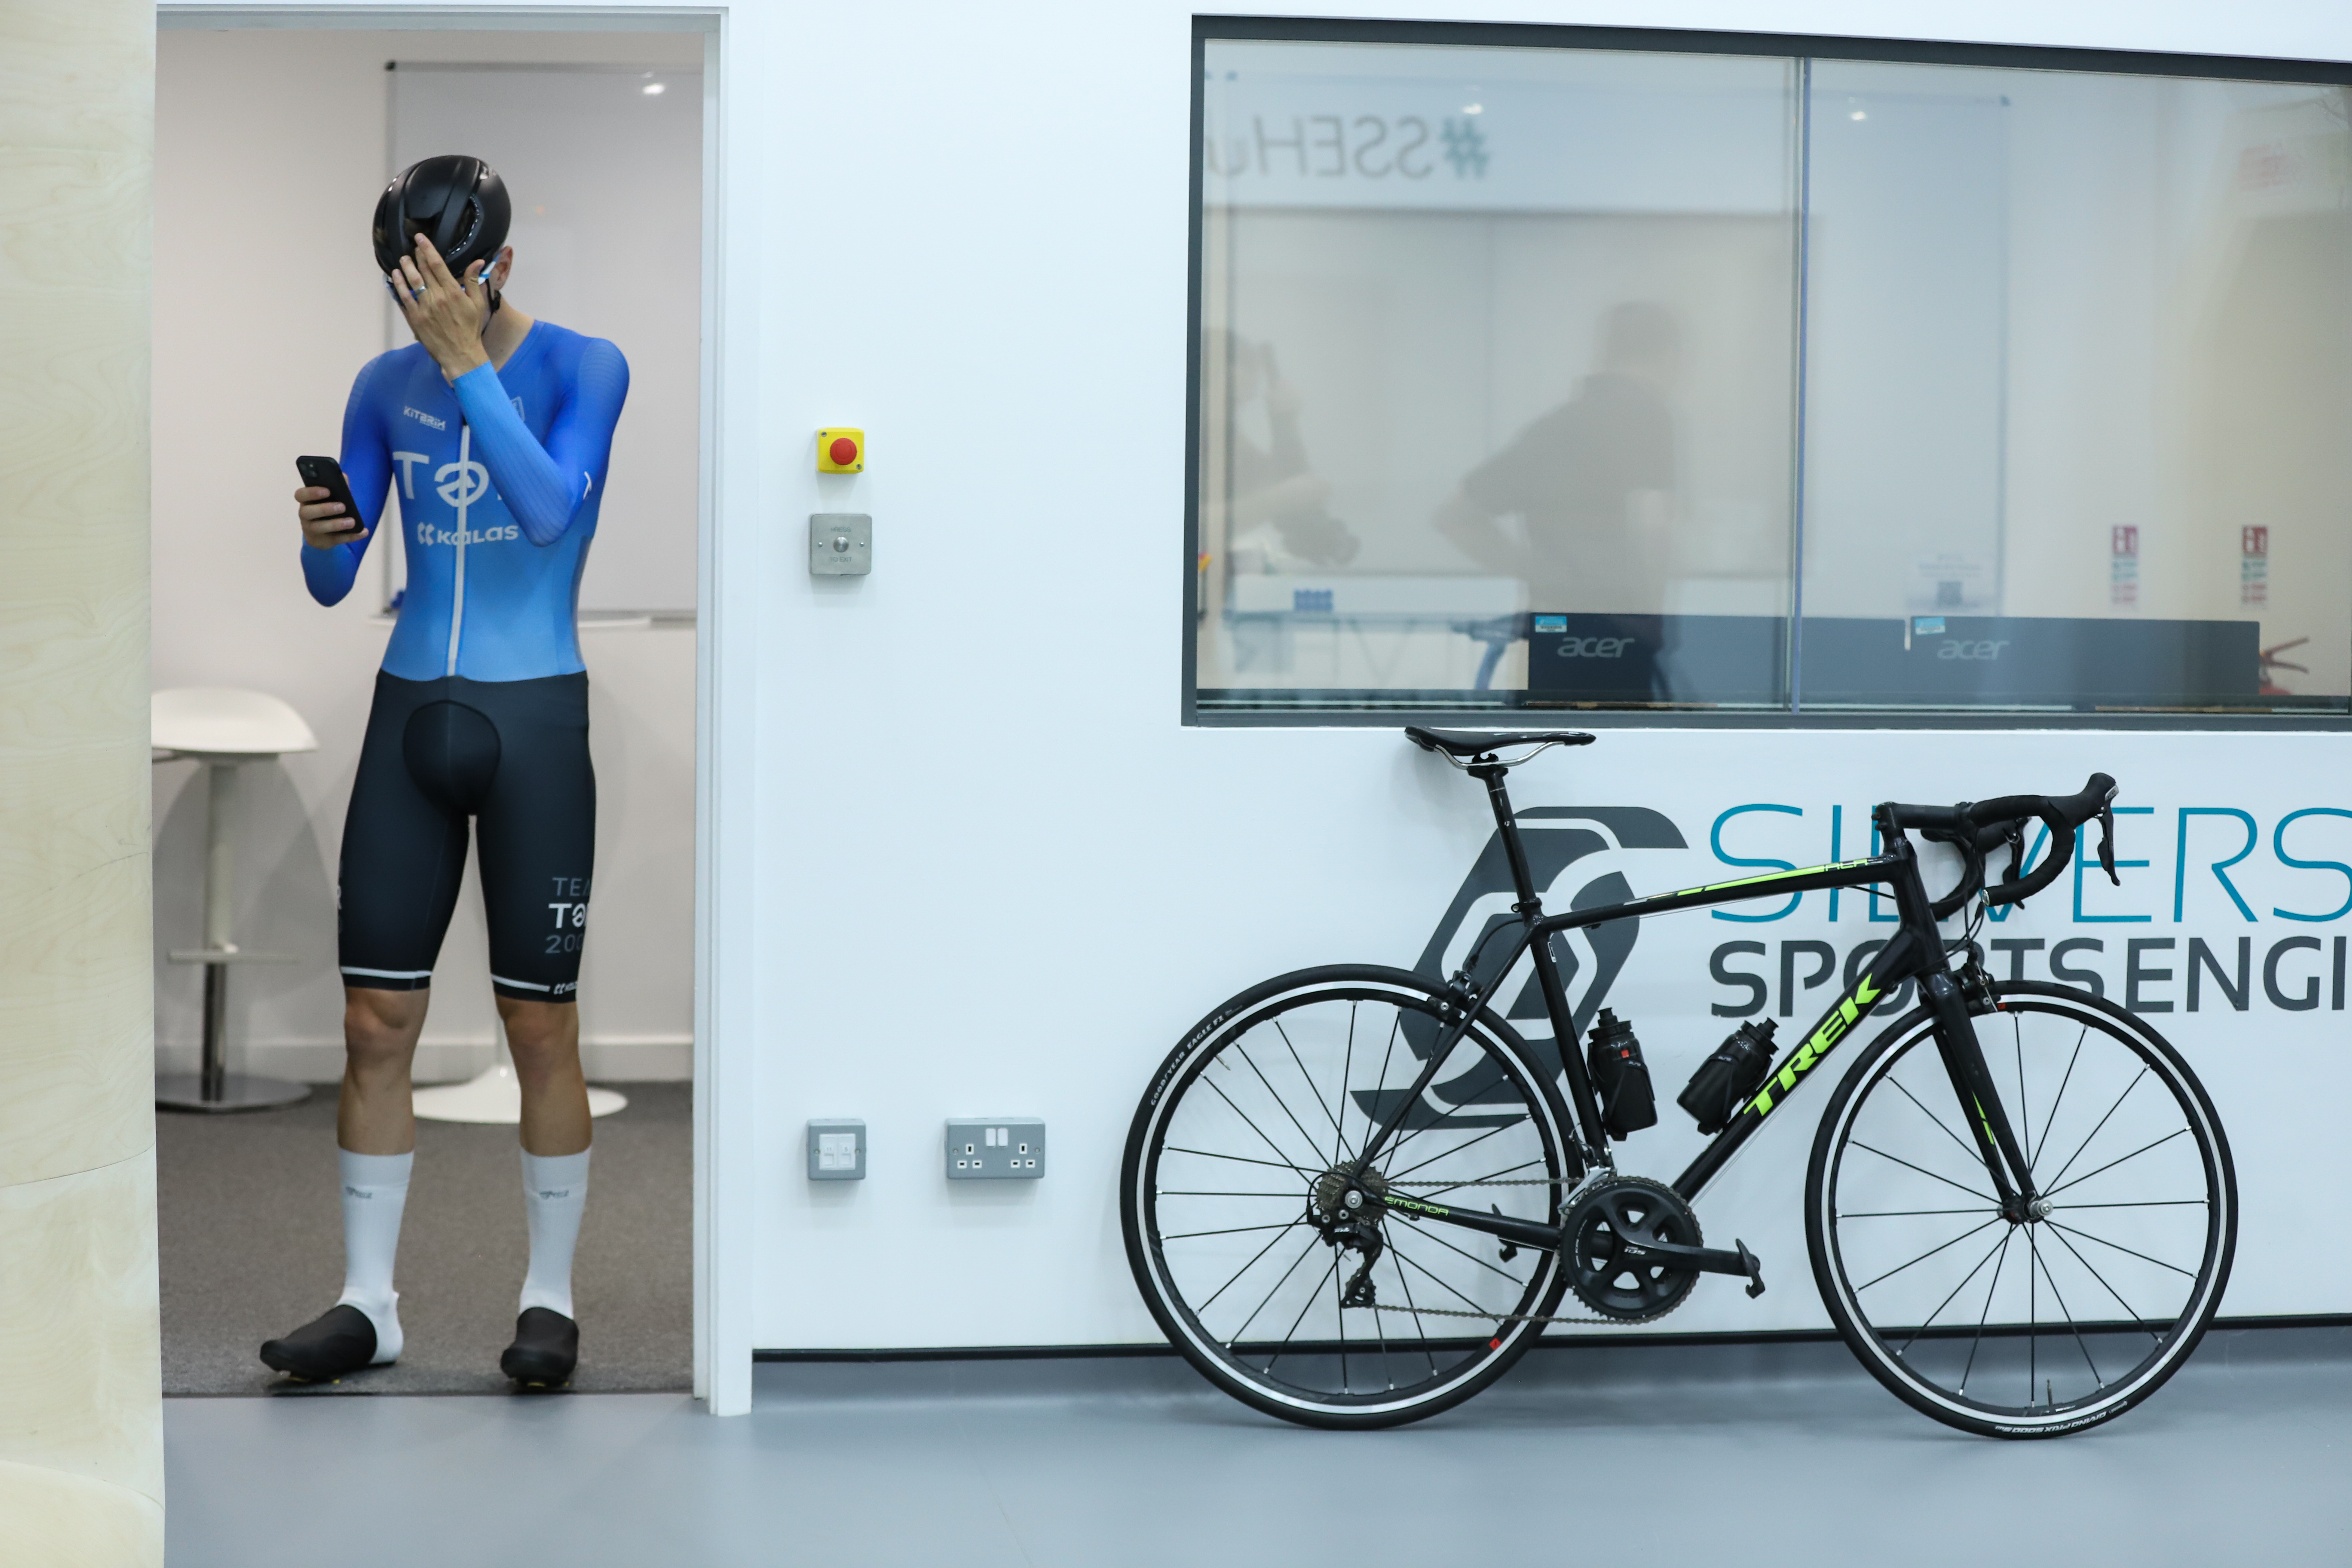
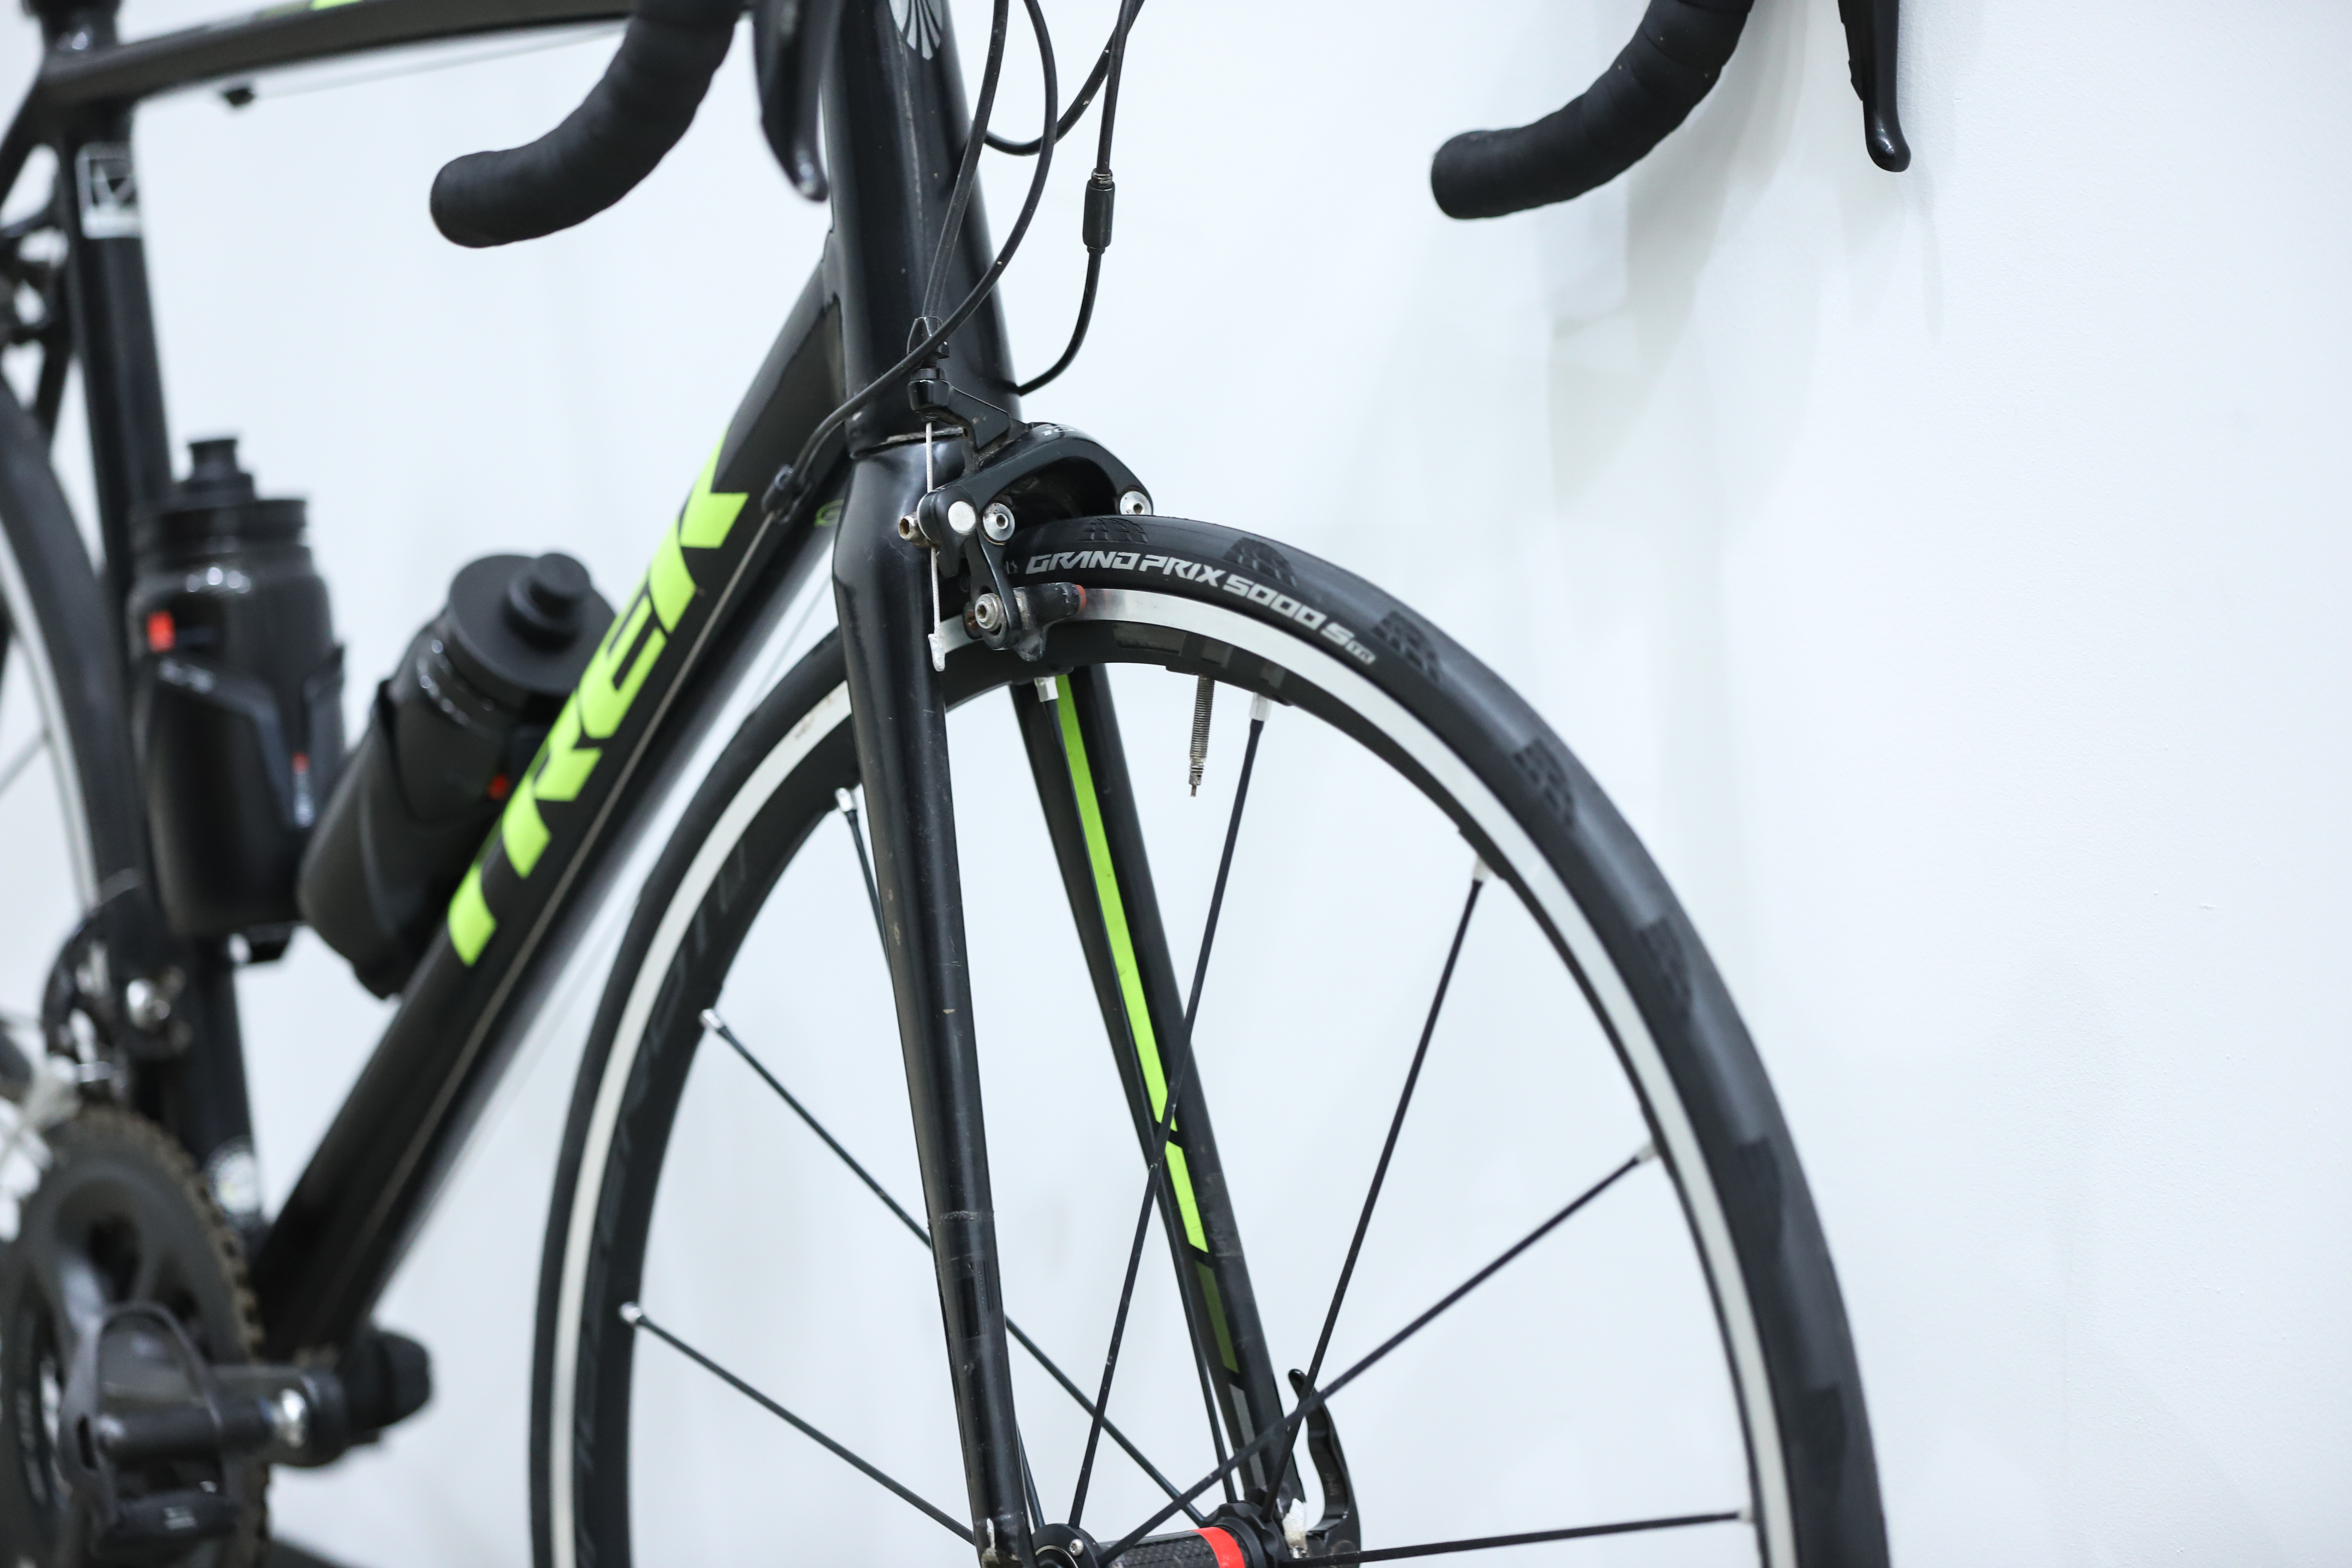
- And our baseline: My own 2015 Trek Emonda ALR with box-section rims, rim brakes, external cables and round bars.
Each bike was a size 56cm or the brand's closest equivalent.
We were limited, to a point, by what we could get our hands on. For example, we wanted to include the Colnago V4Rs (for a Pogačar vs Vingegaard bike comparison), a Merida Scultura, the BMC Teammachine R, the Bianchi Oltre, the Enve Melee, the new Van Rysel aero bike, and others, but either the bikes were unavailable or our attempts to contact the brands went unanswered.
The test
We took the bikes to the wind tunnel at the Silverstone Sports Engineering Hub, testing each one's aerodynamic performance, measured in Coefficient of Drag x Area (CdA).
This is quantified in metres squared, or M^2. The drag coefficient is effectively a definition of how easily air passes over an item's surface, and is largeley affected by the shape of the item but it can also be affected by surface material, and that's why many cyclists wear aero socks instead of bare legs. The area is quite simply the item's frontal area, or size.
We did this via two tests - the bike alone, and then with a rider (me!) - and we wanted to understand three things:
- Which is the fastest superbike? Of the bikes we were able to get our hands on, which would take the crown?
- Or are all modern bikes within such a tight margin that, as a result, you can effectively ignore aerodynamic claims when buying your next bike, and instead focus on other factors such as weight, comfort, spec and customer experience?
- How much faster are they than our baseline? Using my own entry-level 2015 Trek Emonda ALR to represent the age-old bike you've been riding for years or the entry-level model that ignited your passion more recently, we wanted to know how much you stand to gain by upgrading to a modern-day race bike.
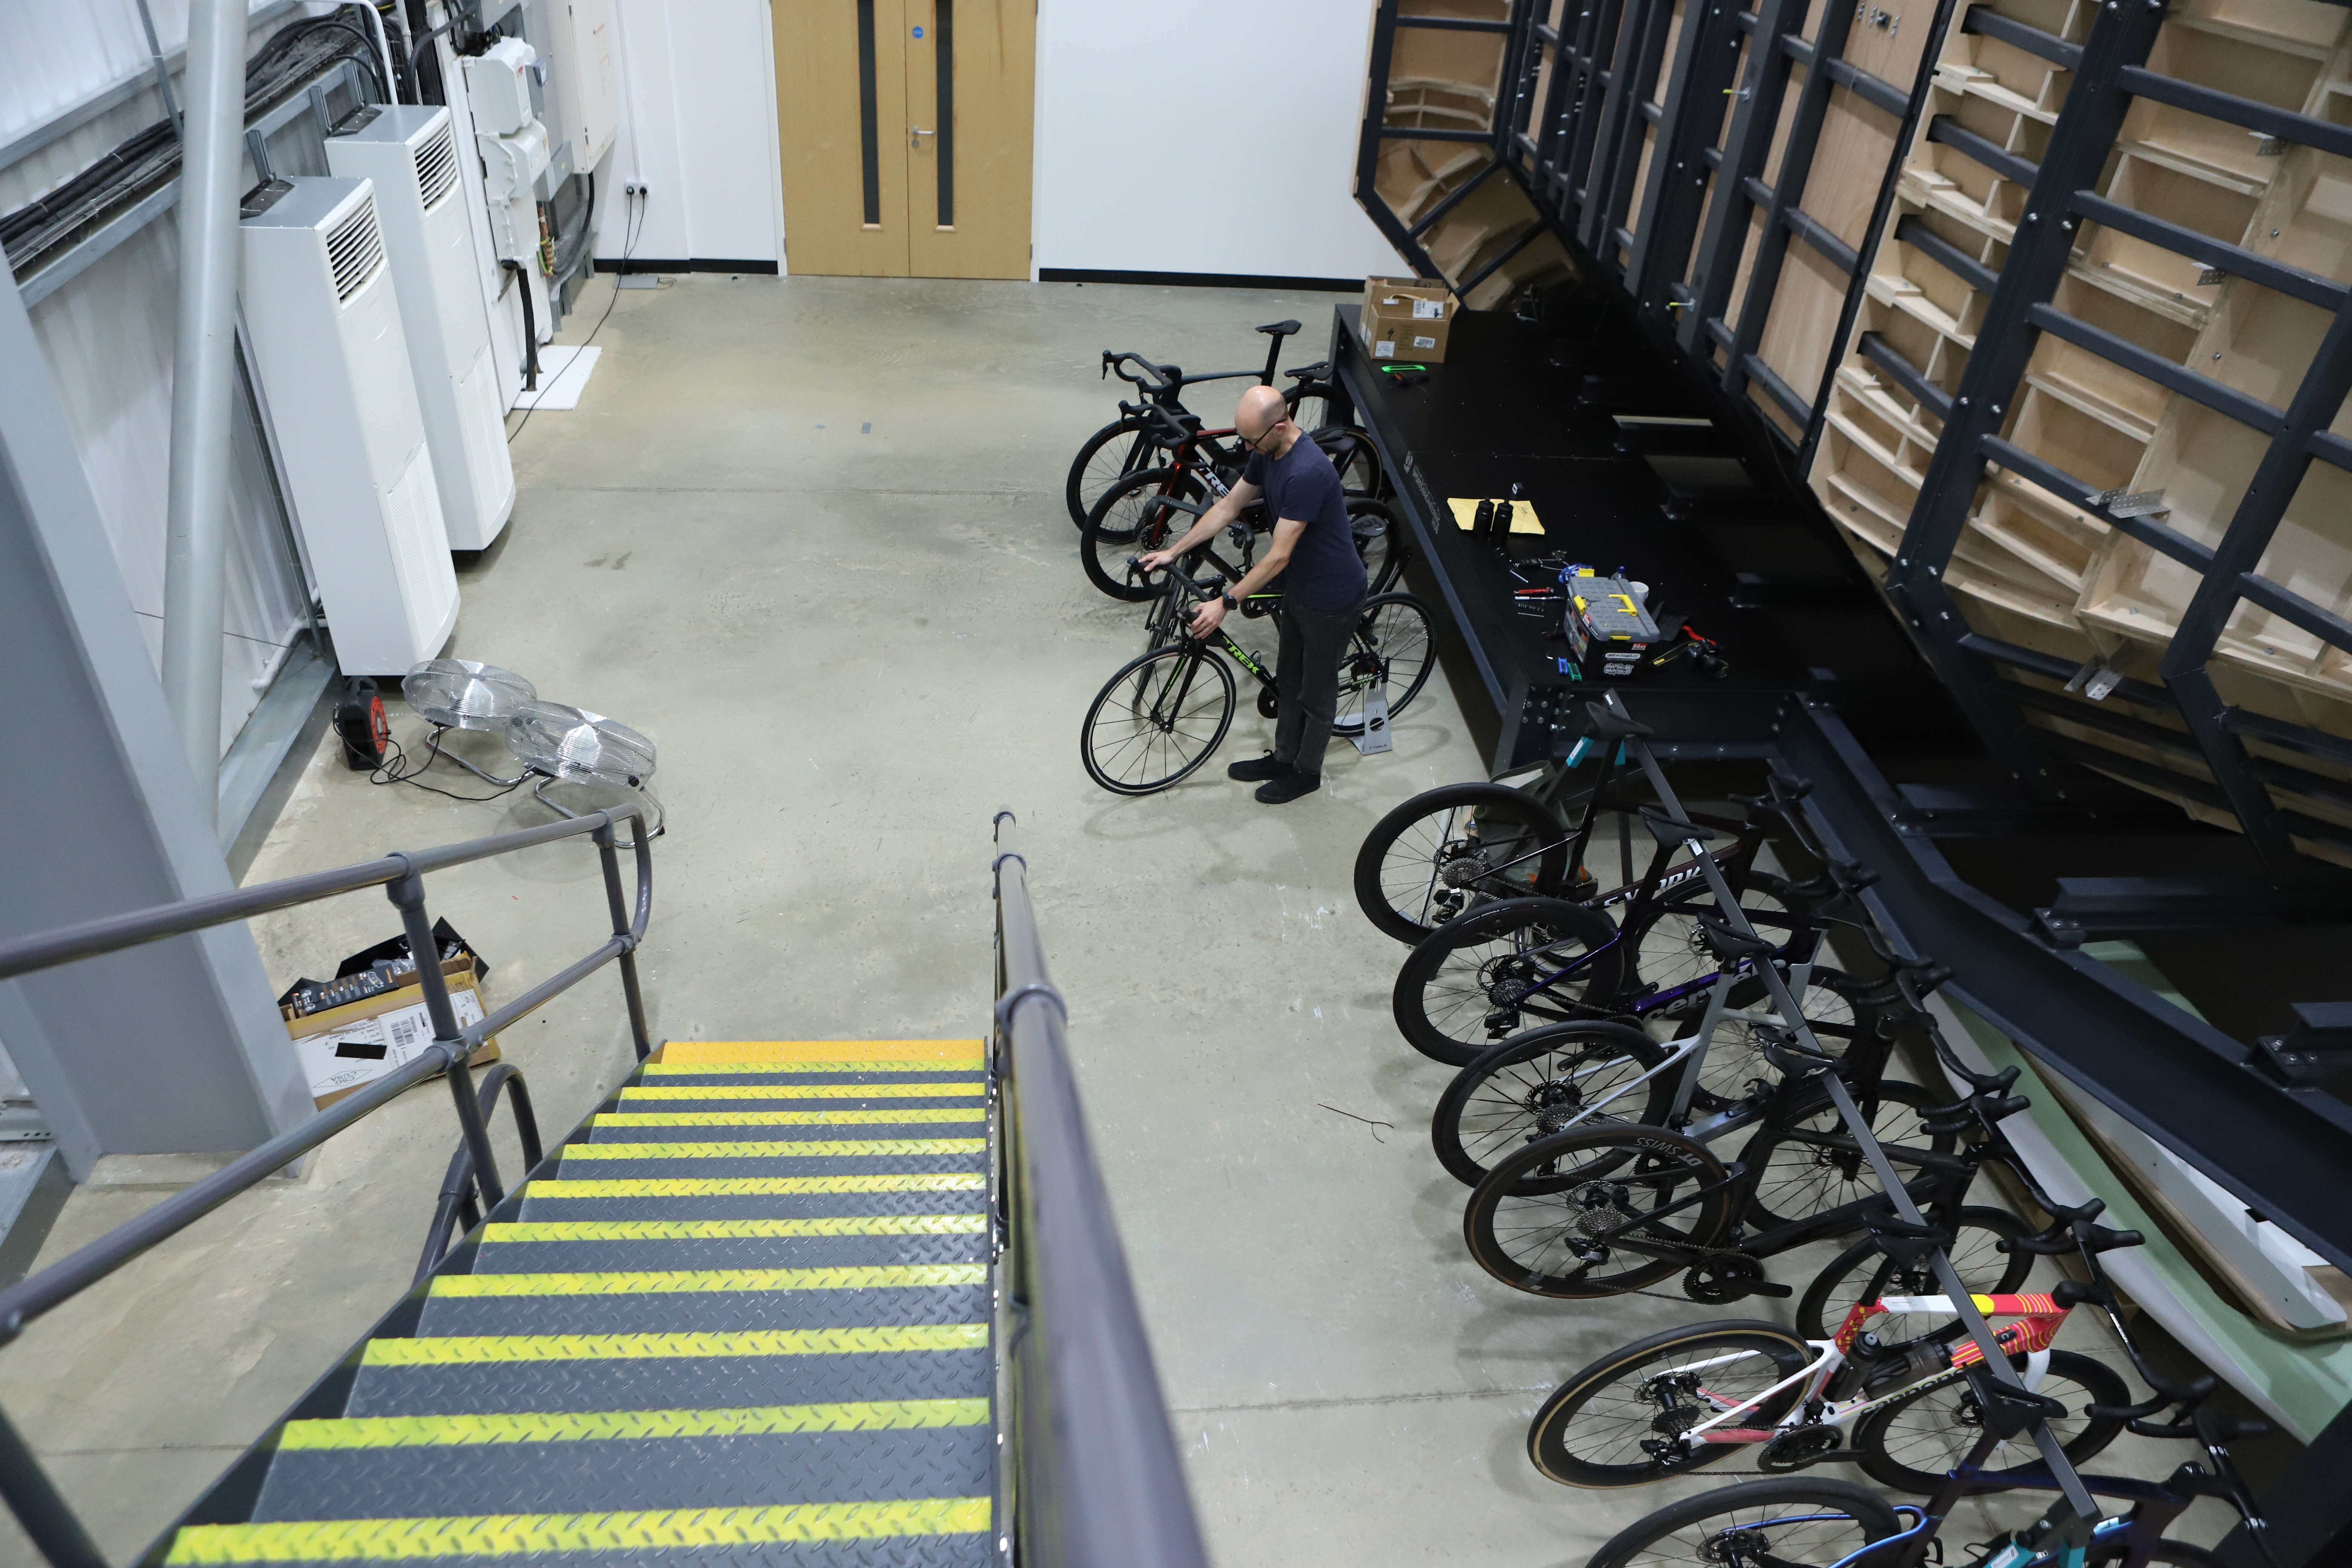
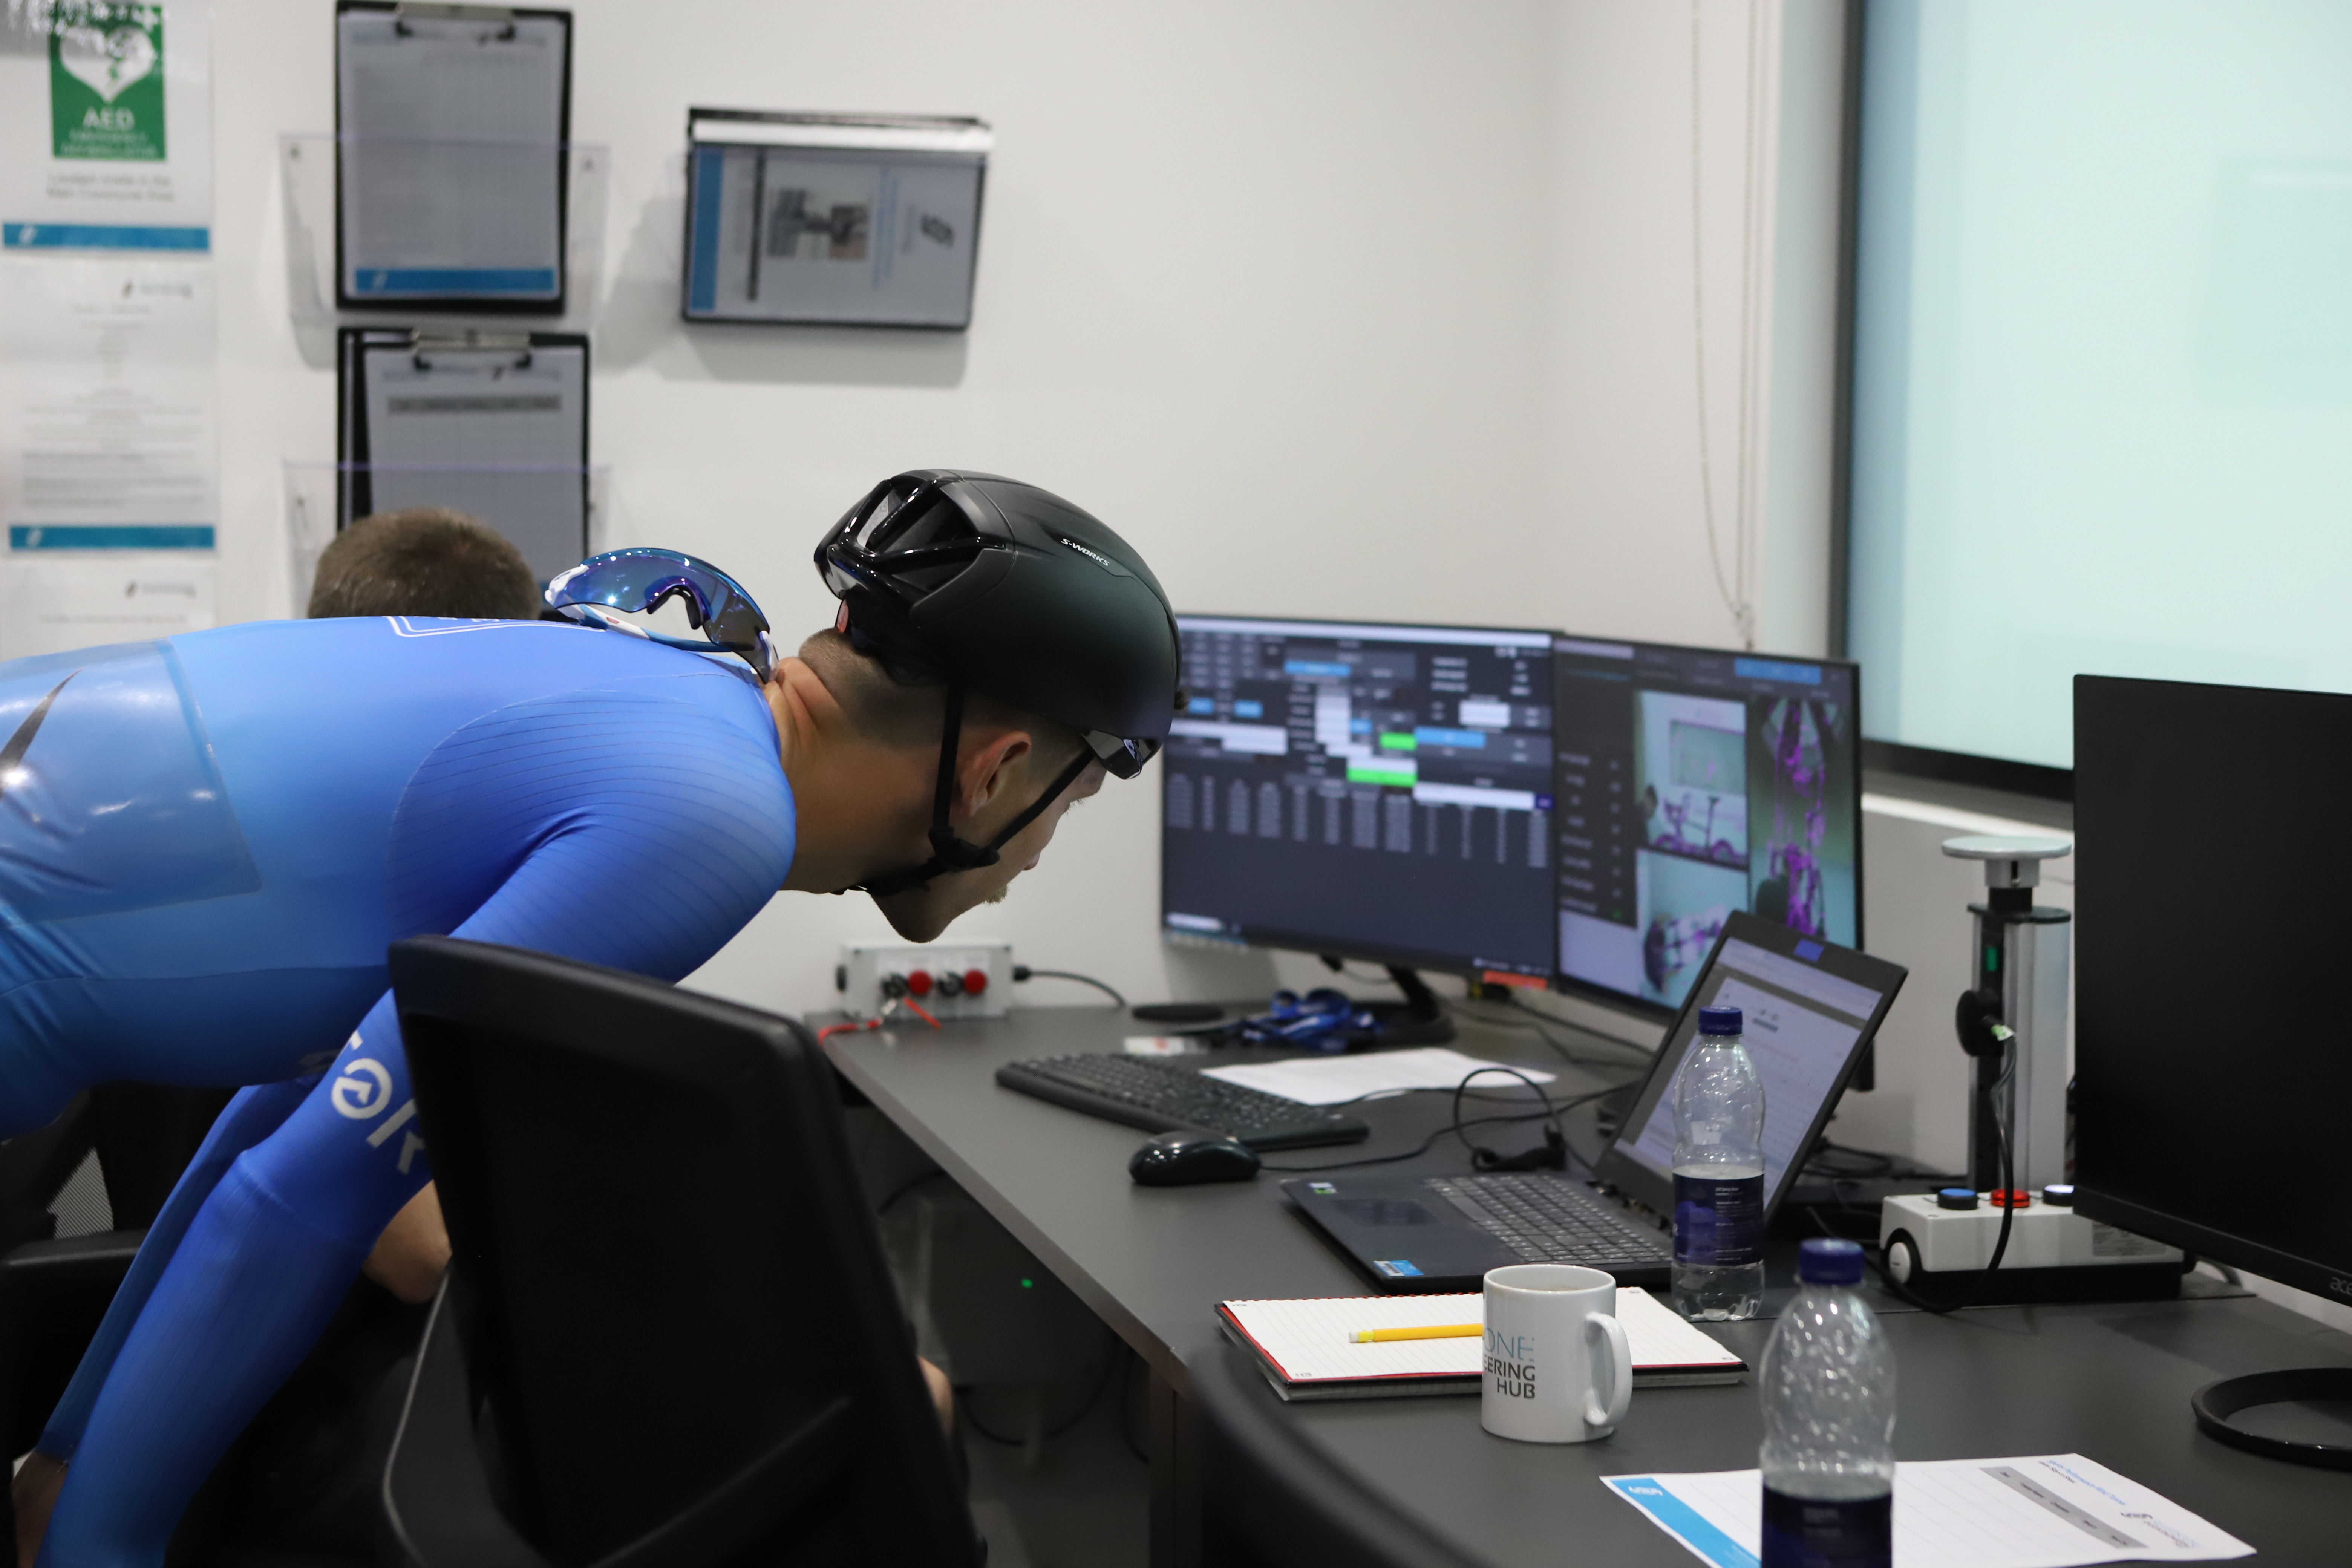
Present on the day were:
- Me - Josh Croxton - guiding proceedings as well as pedalling the bike in the rider-on tests.
- Tom Wieckowski - in charge of bike preparation and standardisation, ensuring the day could run smoothly.
- Sam Gupta - All the excellent photography you see here.
- Andrew Daley - the excellent video capture which will cover our social media.
- Max, Nick, Jack and Graham from Silverstone Sports Engineering Hub (SSE Hub) - in charge of running the tunnel itself, mounting each bike to the wind tunnel stanchions, and guiding the protocol, as explained below.
Our protocol
The protocol was designed by myself with guidance from the aero experts from SSE Hub.
We tested at seven yaw angles: -15, -10, -5, 0, +5, +10 and +15 degrees. Yaw, for the uninitiated, is just aerodynamicist speak for the angle of wind as it is experienced by the rider (and the bike, more pertinently). It takes into account the forward motion of the bike and rider, so the faster you ride the closer your average yaw will be to zero degrees, but by doing a spread we gather data for how well the bikes cope in cross-headwinds as well as a block headwind, or still day where your forward motion creates a zero degree yaw angle situation.
All tests were performed at 40km/h (24.85mph), representative of a typical amateur road race, a fast club ride, or a slow professional peloton (the 2024 Tour de France was raced at an average of 41.4kmh).
We began the day capturing at 30km/h too, to reflect a more all-day pace for well-trained amateurs, but soon realised we would run out of time to get through all of our bikes before the day was up. I also found that during the second sweep of rider-on testing, fatigue of holding the solid position would set in before the end of the test and the data would become less reliable. We decided to bin that 30km/h data and forge on at 40km/h only.
For the rider-on test, we tested for 30 seconds per yaw. We could have tested longer on each test, but found this was a nice sweetspot between a long enough capture to get trustworthy data, but short enough that fatigue didn't set and nullify the repeatability and allowed us to get through all the bikes in the allotted time. Cadence was held at a consistent rate of around 90 RPM.
For the bike-only test, we ensured the wheels were spinning at the correct speed; the behaviour of airflow over the rim and spokes is very different on a static wheel, and thus not representative of the real world. We tested for 15 seconds per yaw here. The data here is much 'cleaner' (there's no rider pedalling or having to hold a position) so better accuracy can be obtained without the need for longer captures.
Standardisations
The wind tunnel itself is designed to account for any changes in temperature or air density in its results. Prior to each test, the wind tunnel underwent a taring process, similar in principle to the tare on your kitchen scales or zero-offsetting your power meter to ensure accurate readings.
As always, we standardised as many variables as possible. This included the bike size, rider position, the front tyre, computer mounts, and where relevant, the bottles and cages on each bike.
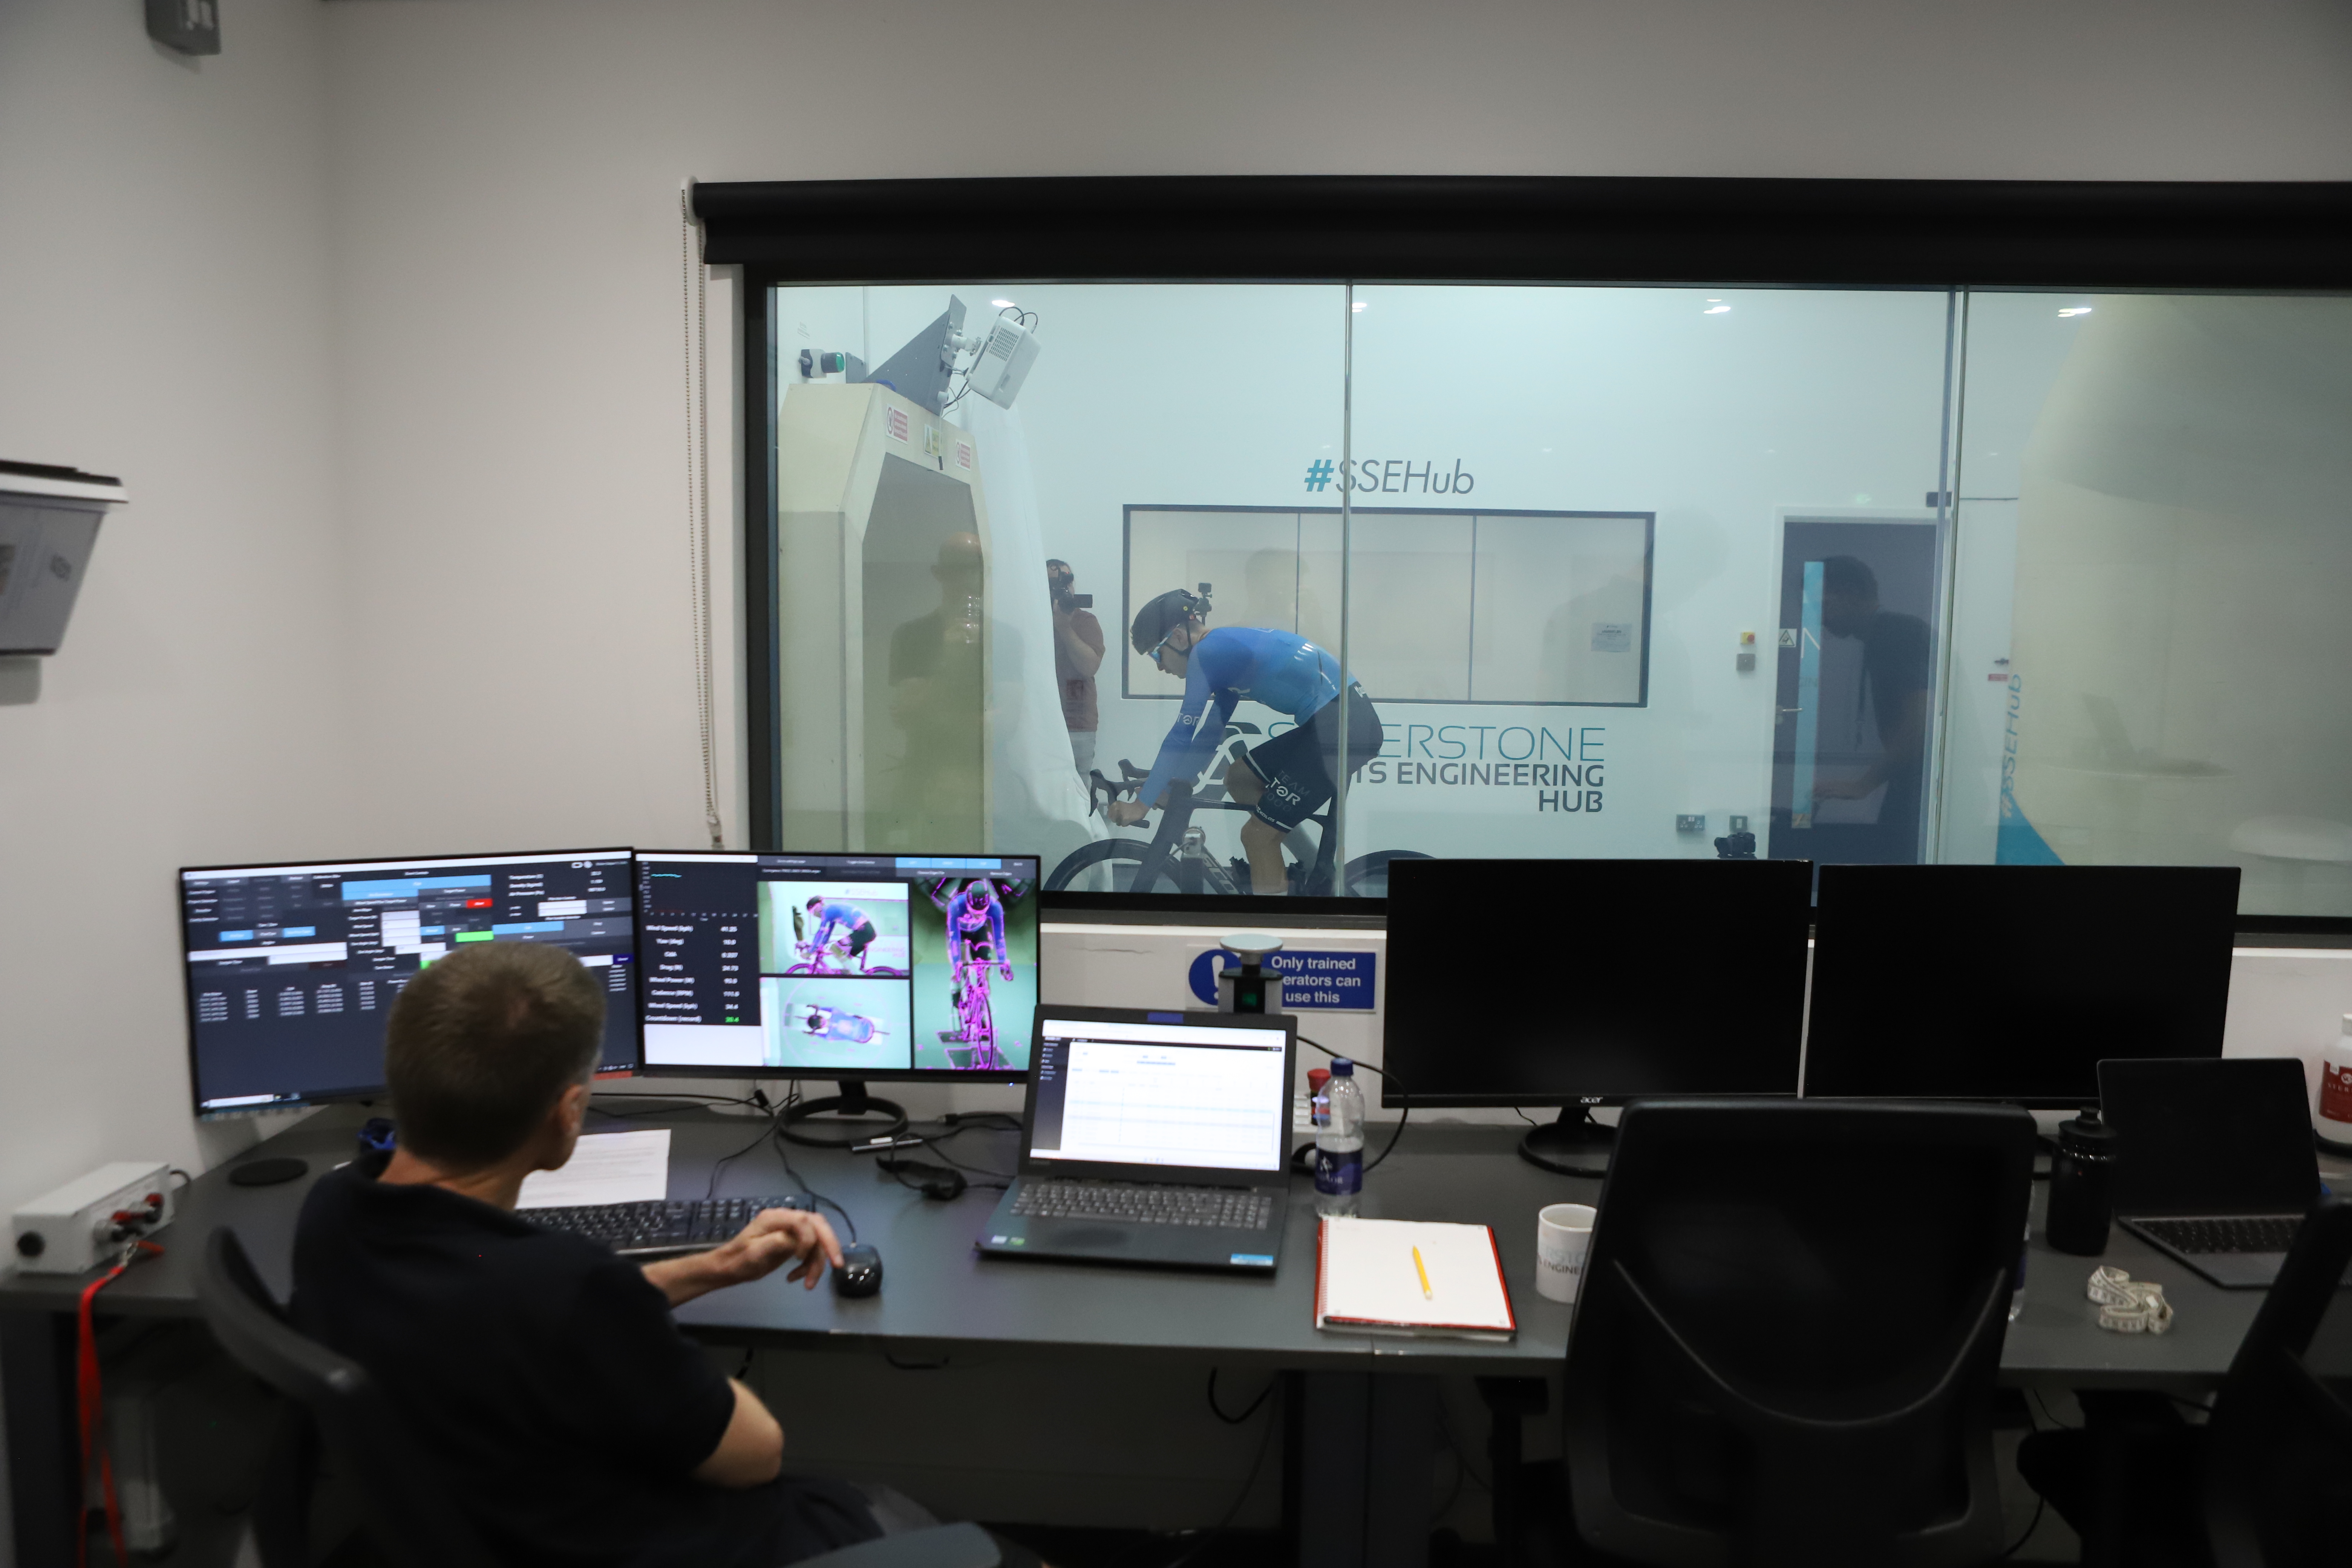
The wind tunnel also projects an 'edge' or an outline of my position from the baseline test from three angles (front-on, side-on and top-down) onto the floor, so that I could remain in a consistent position for subsequent runs.
Each test bike was a size 56cm, or the closest equivalent per the brand's geometry chart. Upon receipt, each bike was fitted to me, and positions matched to each other as closely as possible. More on this below.
We wanted to test each bike as closely to how a buying customer would use them in the real world, but with some concessions where necessary to ensure consistent testing.
We removed computer mounts from all bikes. We know that 95% of riders will run an out-front mount, but only around half of the bikes featured actually came with one. We didn't want some tested with and others without, so in the absence of an available mount for the remaining bikes, we ran them all without.
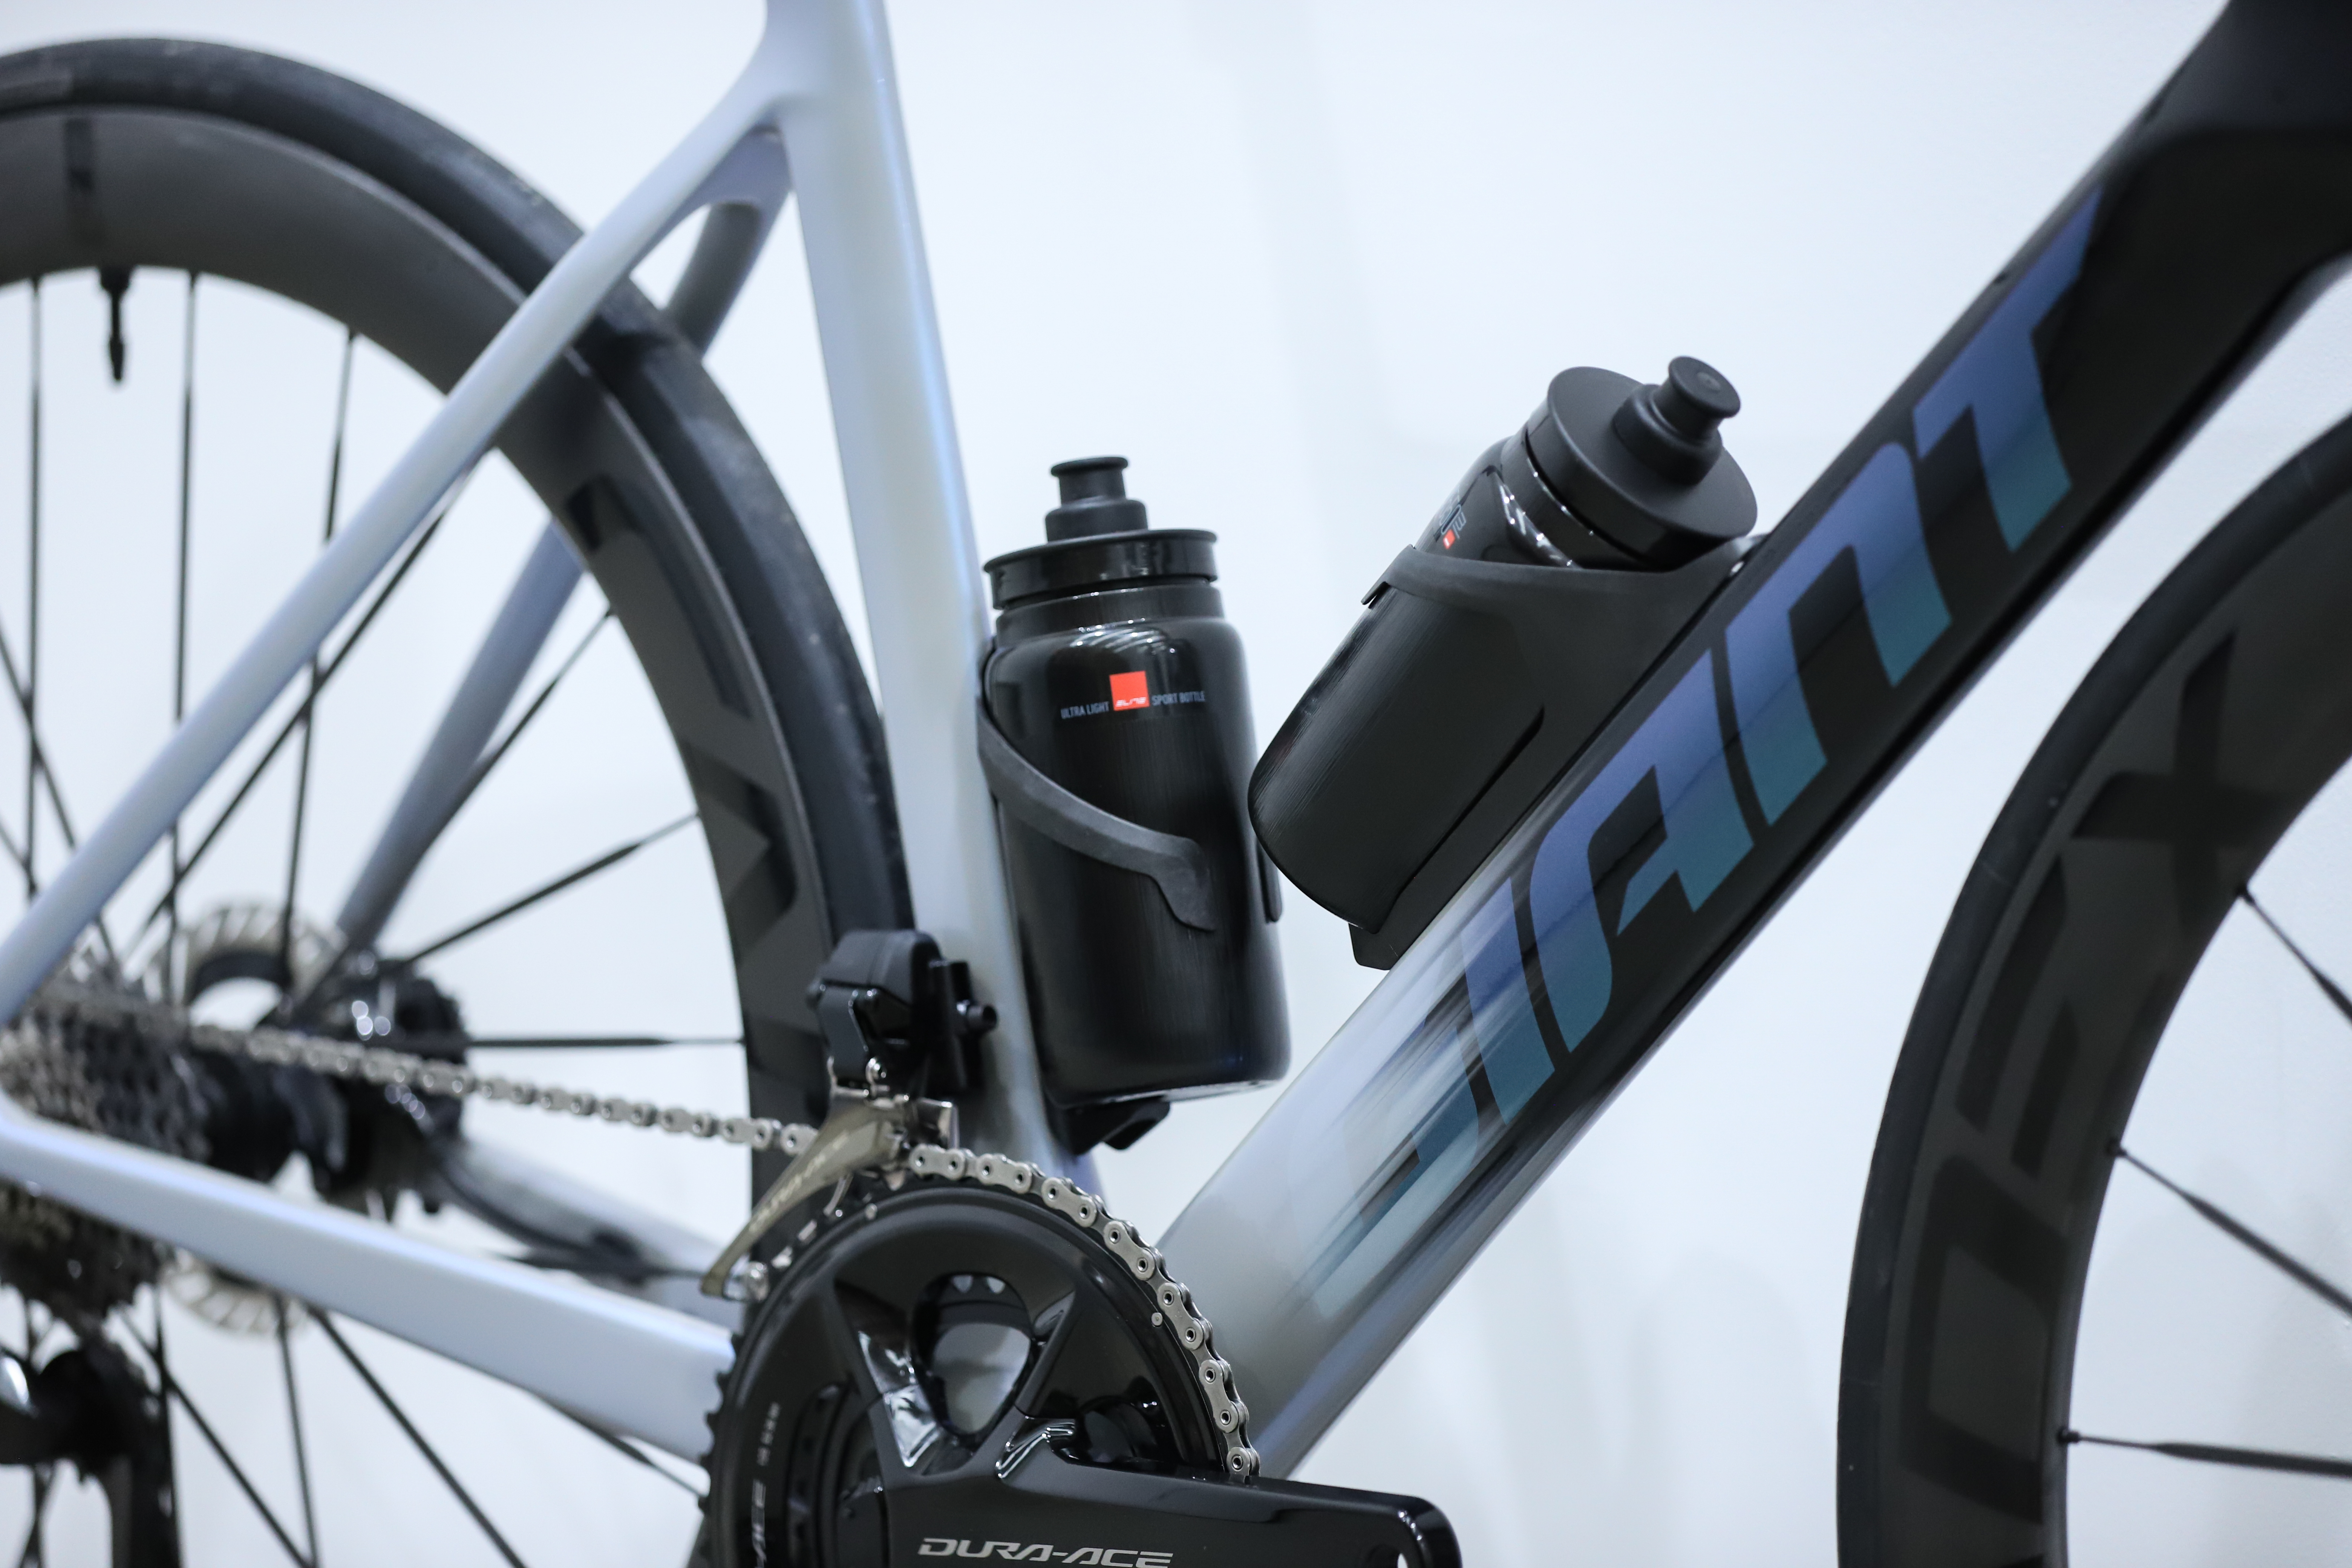
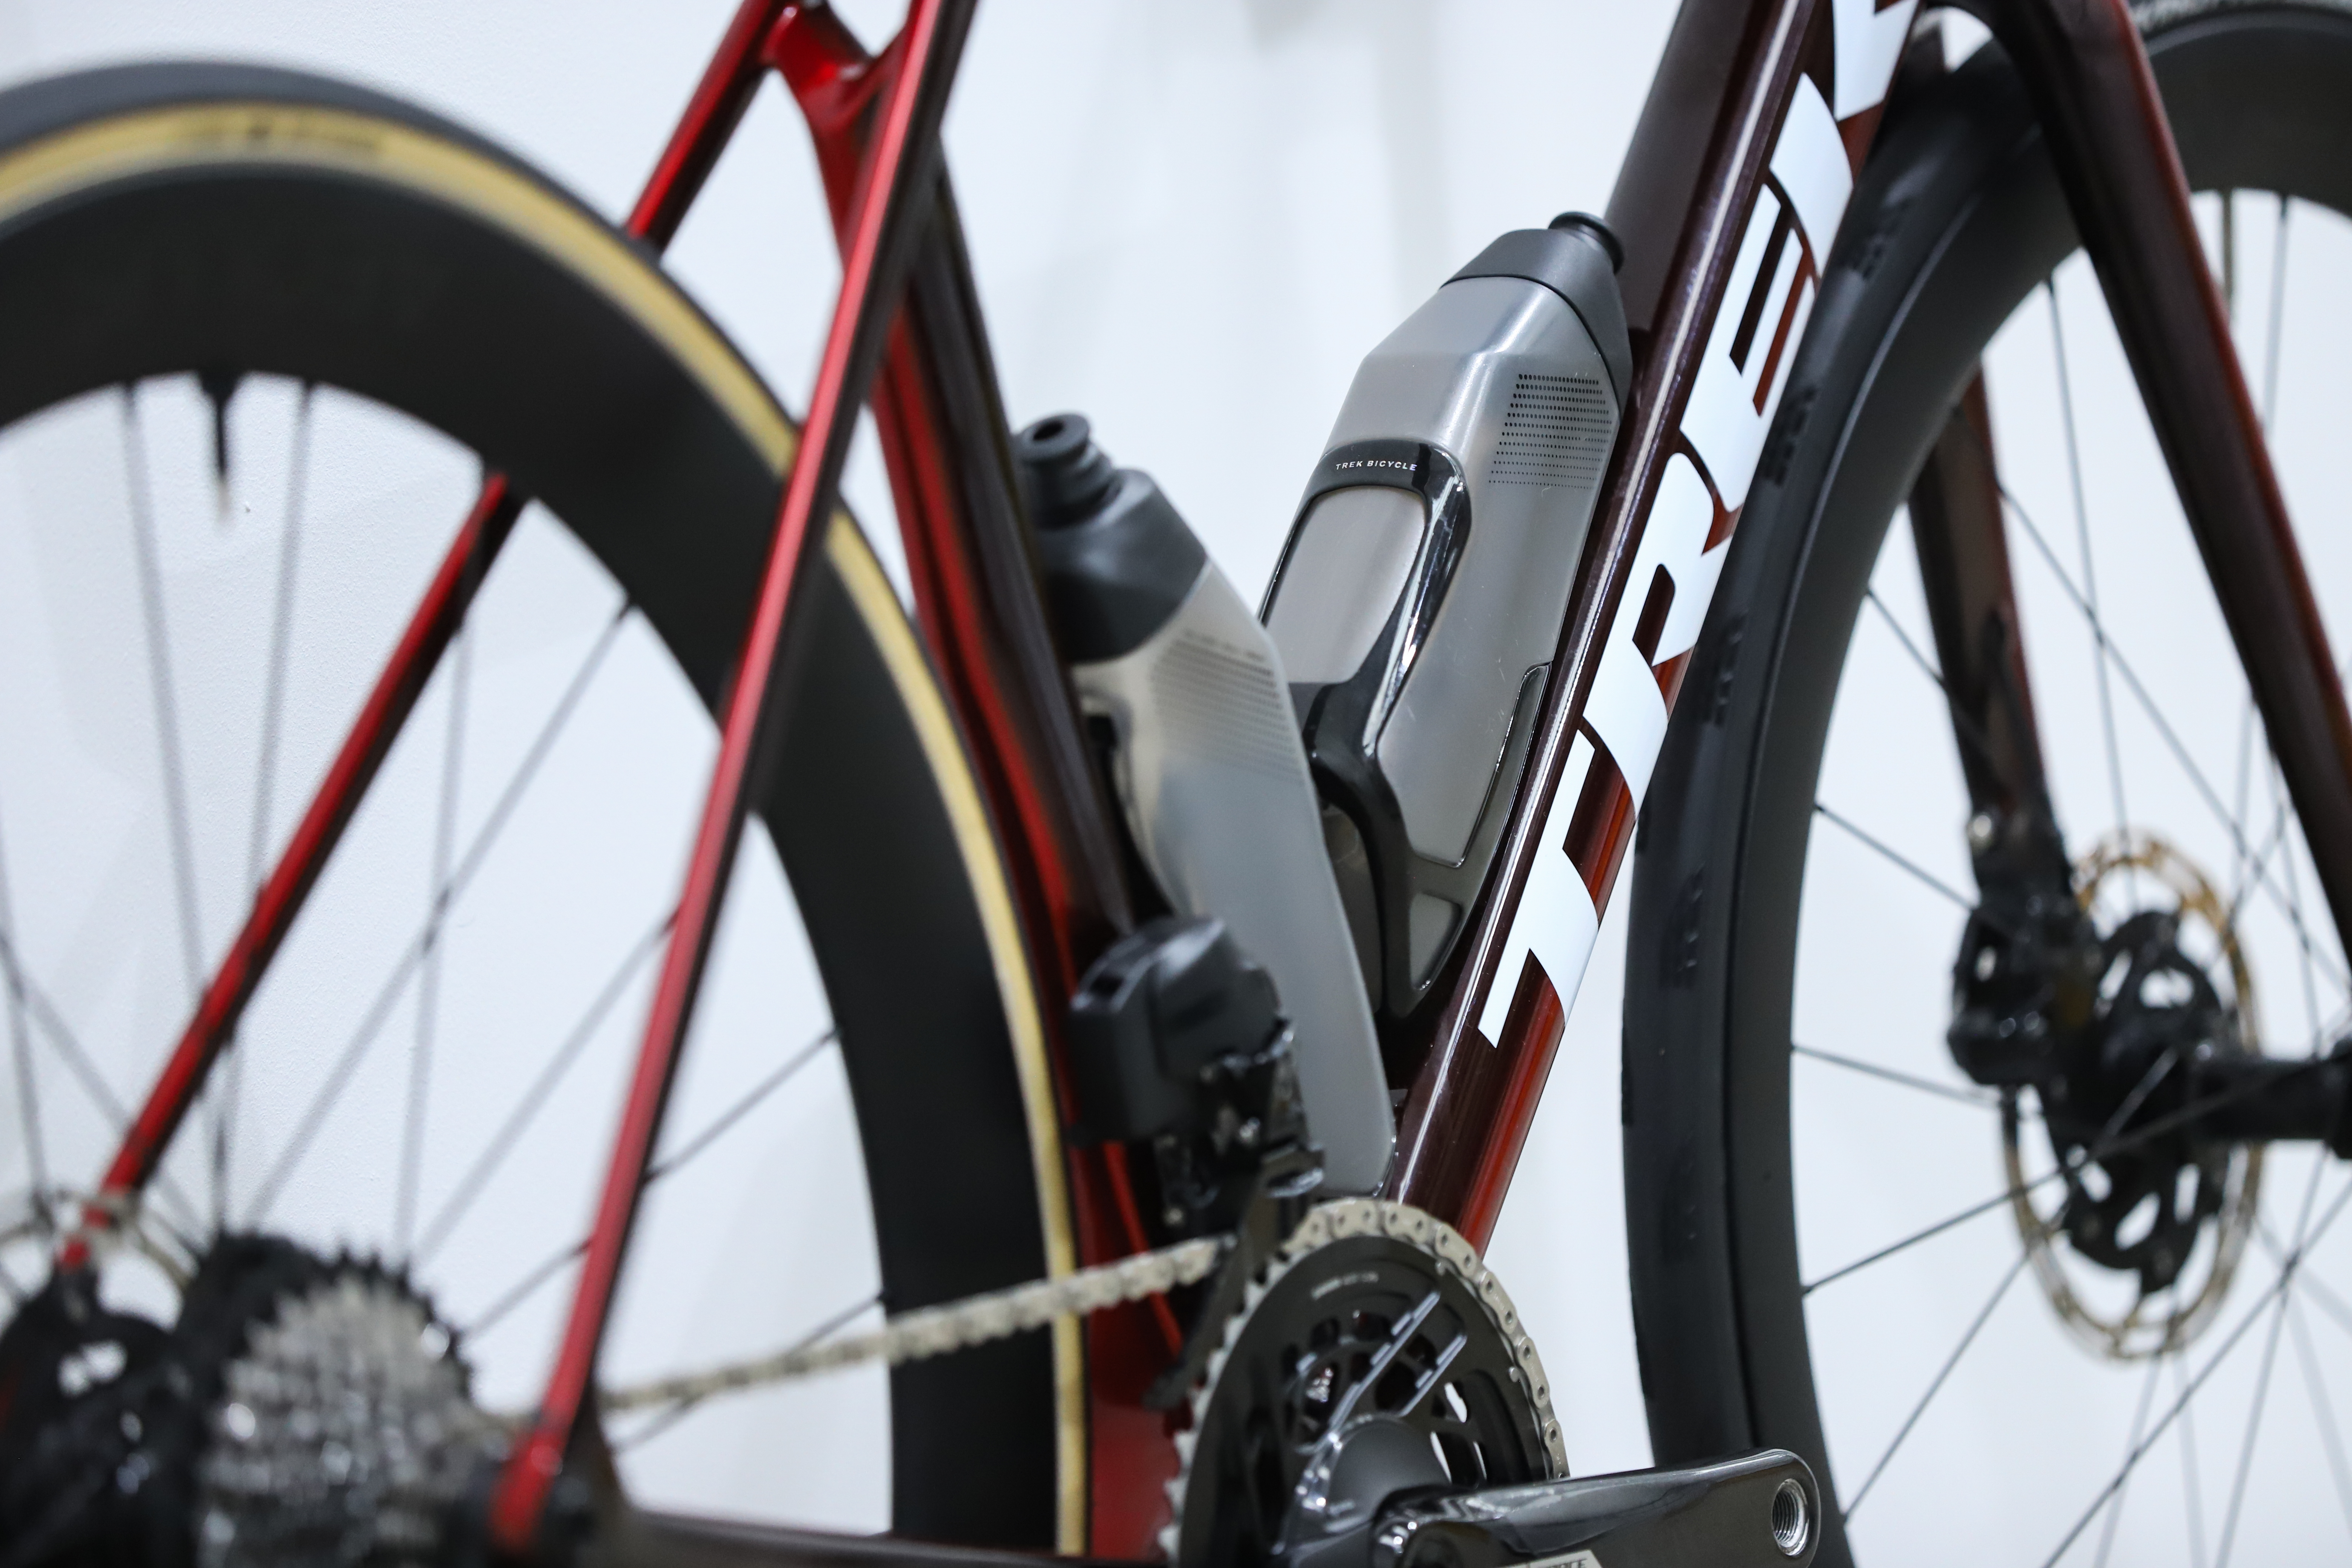
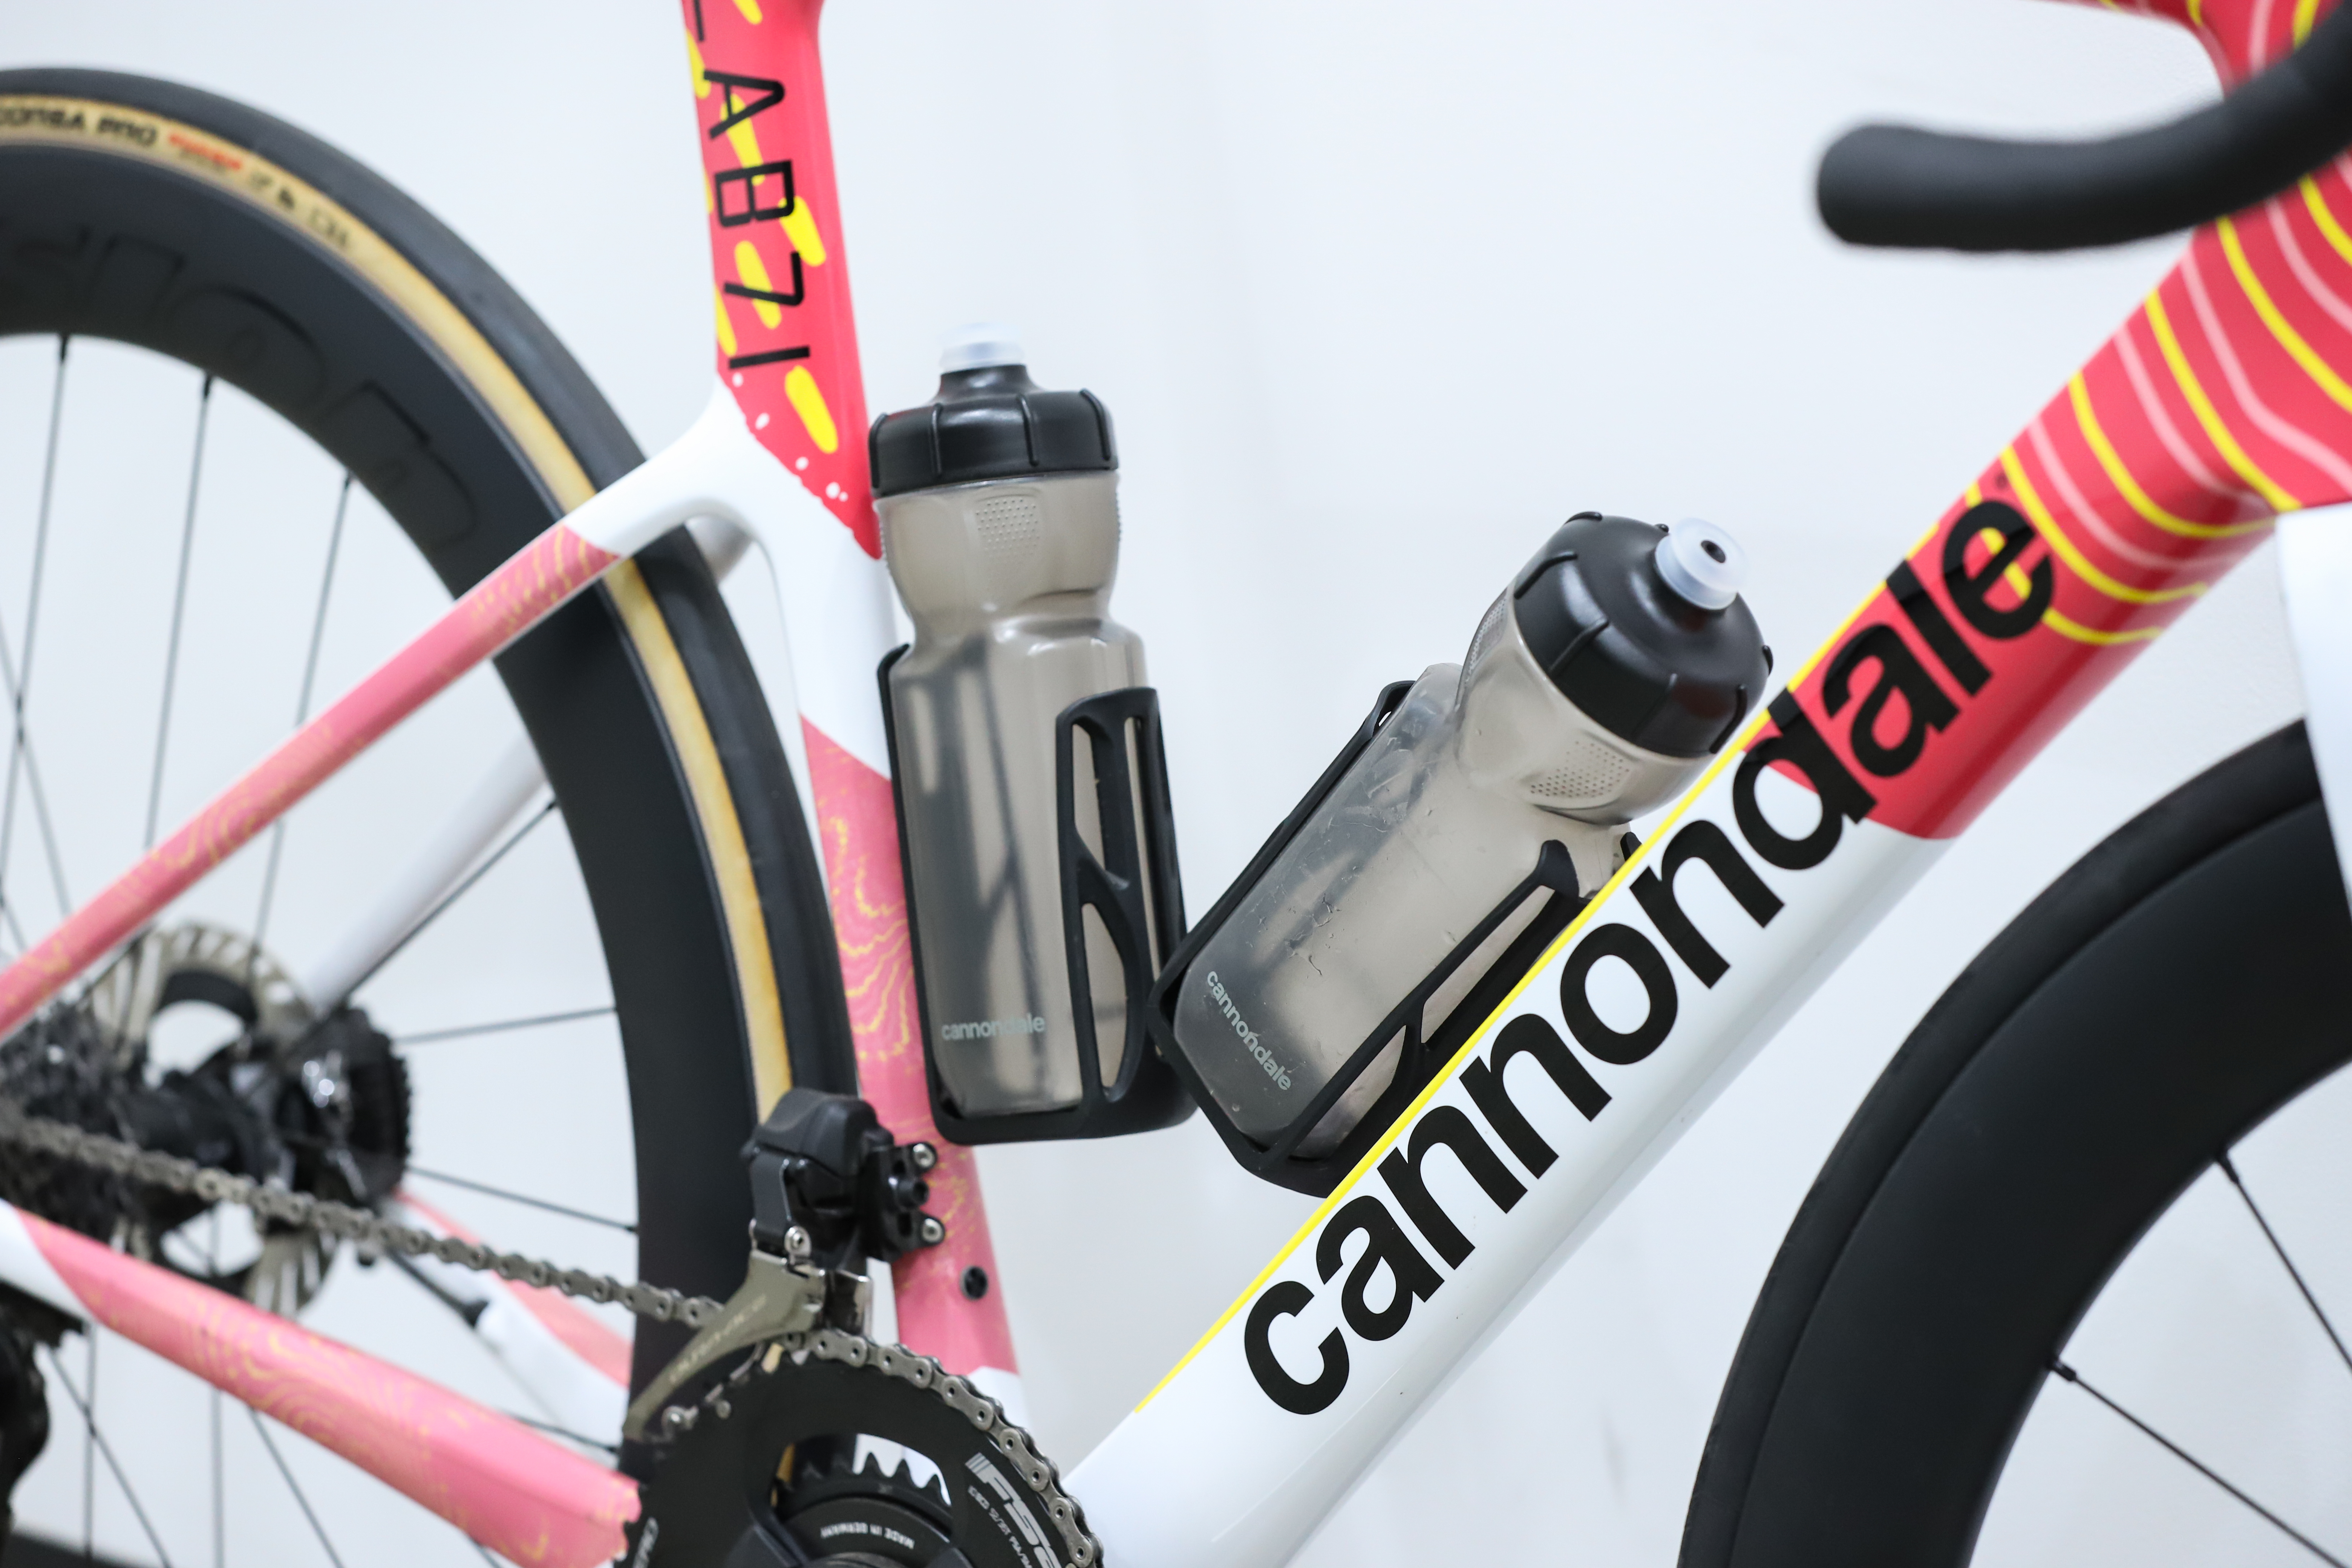
The Madone, Propel and Supersix were all designed with aero bottle cages, so we ran them for the test. The remaining bikes were all given Elite Vico Carbon cages and Elite Fly bottles - both a common sight in the WorldTour. Our thinking here is that if you buy those bikes and have those aero cages, you’ll use them. Therefore the aero performance of the bike with those cages is more relevant to you than without them.
The Factor OSTRO VAM also offers aero cages too, but sadly we couldn't get our hands on those in time for the test.
I kept the helmet on all day to ensure it was fitted consistently. I also marked my skinsuit position so it could be made the same again after toilet breaks.
Confidence
This was calculated by testing the baseline Trek Emonda ALR at the beginning and the end of the day in identical setups.
There seems to be some discussion about the best way to then calculate the error margin from this. Some will take the average CdA from the entire sweep (all seven yaw angles) and calculate the difference between the two. If we took this approach, our error margin would have been 0.24% and 0.53% for the bike-only and rider-on tests respectively.
However, others compare each yaw angle individually and take the biggest of these differences. We chose to take this approach in the interest of offering fairer, more confident conclusions for our readers.
In addition, the following factors could affect the results:
- The handlebars fitted ranged from 38cm to 42cm, which meant my hands were in a slightly different position. Using the 'Edge' markings that Silverstone provides, I was able to roll my wrists inward or outward to standardise my riding position, and we were meticulous enough with our pre-test bike fit adjustments that I was able to offset the differences and hold myself in the baseline position well. We, and more importantly the team from SSE Hub, were satisfied that my body position was consistent across tests.
- The bike-only tests would also be affected by differing bar widths due to the increased surface area, but without the potential effect on the rider’s position. The effect is small when compared to the entire bike’s size and the drag coefficient of each constituent part hitting the wind (front on or downstream), but not insignificant.
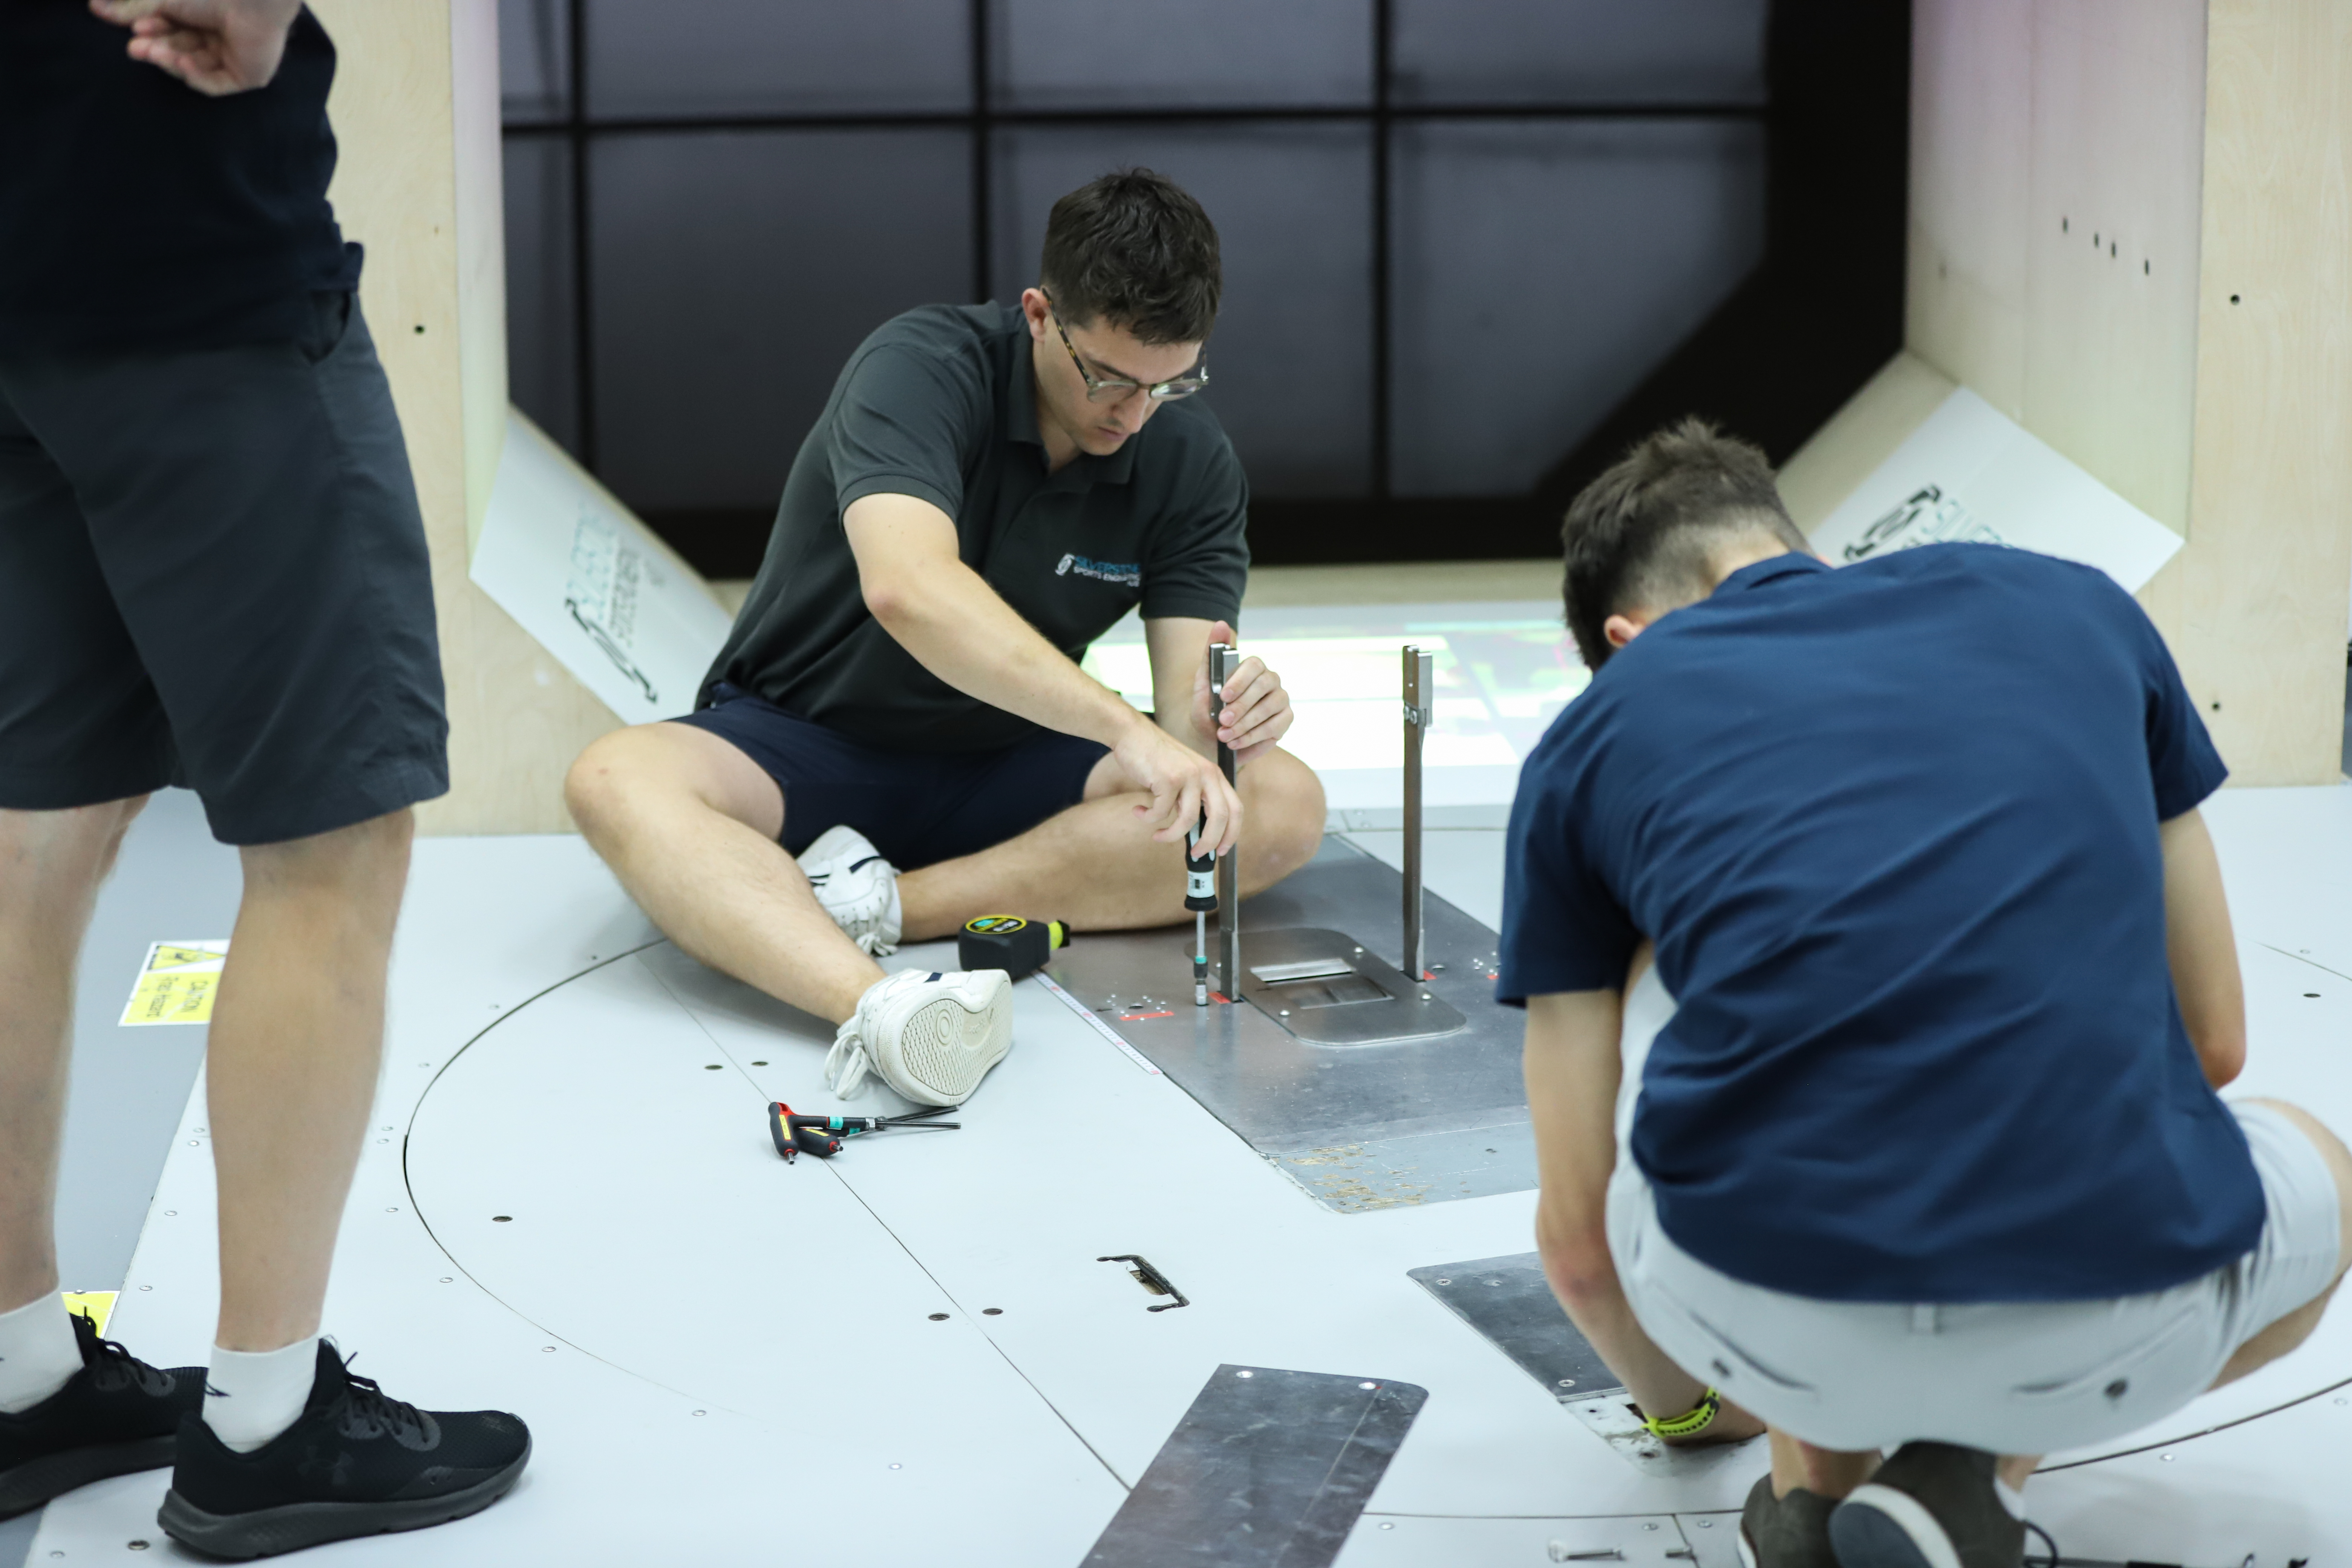
- Holding each bike in place was a set of stanchions. No adjustments are made to account for them, given they're the same for all bikes and we're interested in the differences rather than the absolute values. However, an extra plate was added in order to mount the Pinarello due to its blind drive-side dropouts, reducing our confidence in the dataset for this bike. We still think the data will be interesting to our readers, so have chosen to share our findings as we have them. Canyon and Cannondale's bikes also feature blind dropouts, but both brands sent drilled-out bikes that could be mounted as normal.
Additional details and disclaimers
Cyclingnews does not claim that this data is the final word on the aerodynamic performance of the bikes featured, but rather an additional stream of independent, unbiased testing and information for our readers.
The results are simply representative of our day of testing. We hope that being clear about our method and our protocol allows readers to appreciate the data while also understanding the bigger picture.
The charts shown in the results below show the data with the error margins highlighted. For simplicity, when we report the CdA for each bike/test, we will do so as it came out of the wind tunnel to four significant figures.
With this data, we've done some calculations to solve for power (watts) and speed (km/h) at different power outputs. These calculations do not factor in additional losses such as drivetrain friction or rolling resistance, nor do they factor in the likelihood of experiencing such yaw angles at the given speeds. These are made to help our readers understand the potential impact (big or small) that CdA may have.
We have also included the weight of each bike. These are real weights taken moments before being sent into the wind tunnel in their ready-to-test state with pedals and bottle cages fitted.
We also understand that other factors come into play when buying a road bike, such as how it rides, weight, comfort, spec, tyre clearance, aesthetics, customer experience and more. The best road bikes for you will be a balance of those features alongside aerodynamics, each weighted per your preferences.
The results
Rider on bike results
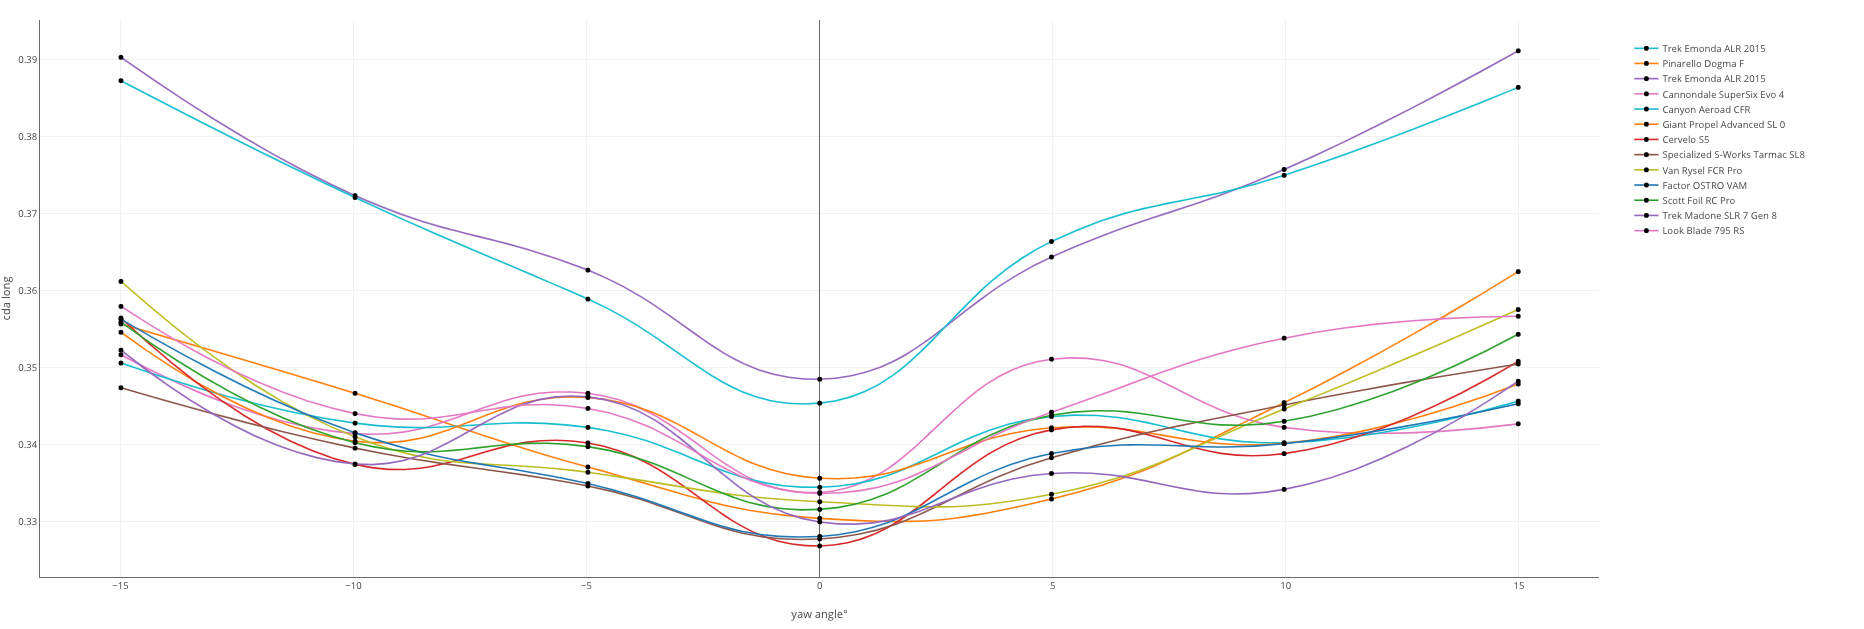
Here you can see the CdA plotted against Yaw for each bike. The two lines that sit higher than the rest are the two runs we did on our baseline bike. This shows that all of our new superbikes have a lower drag coefficient than a 10-year-old alloy bike: A positive start!
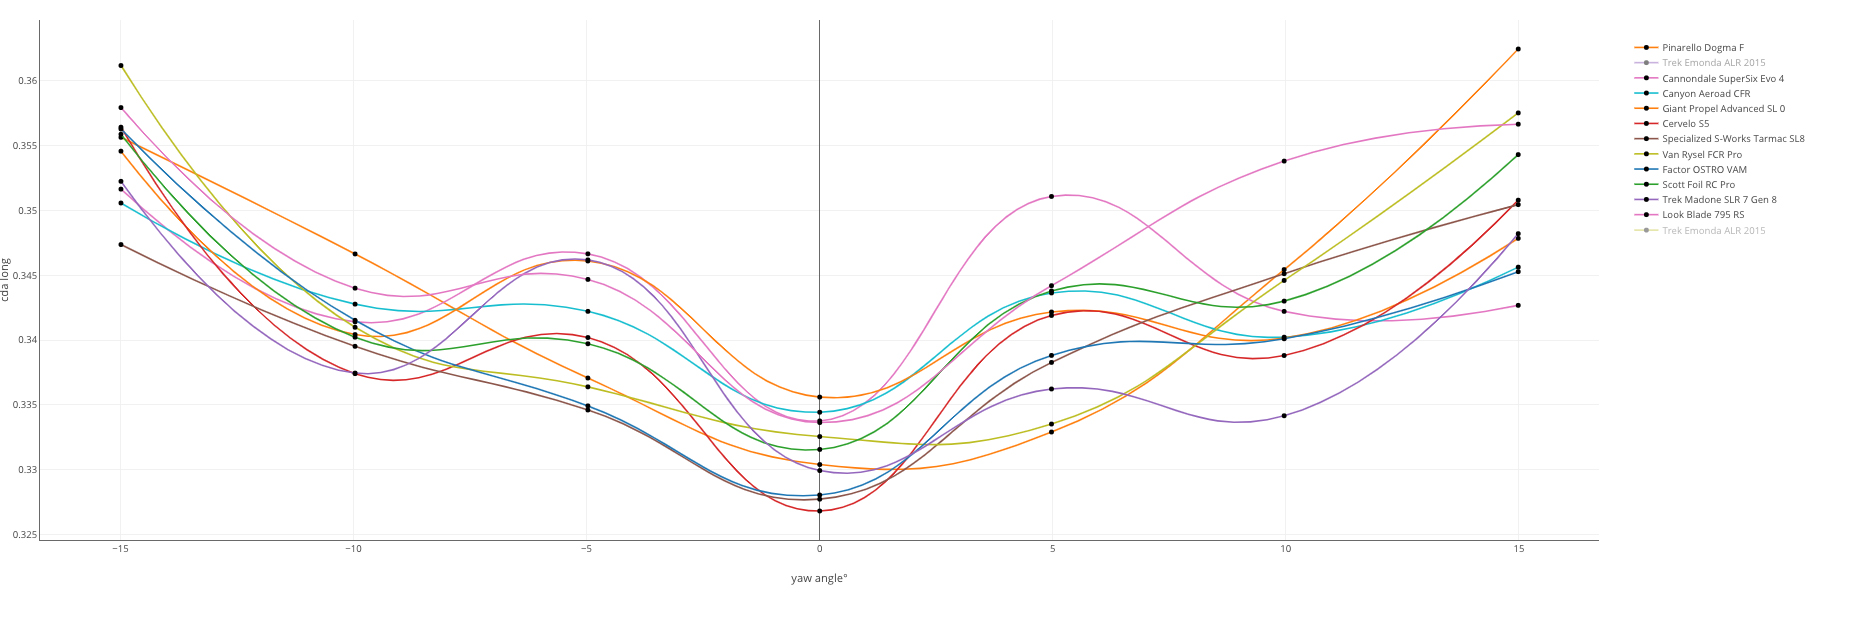
Removing the two baseline runs, you can see that the rest of the bikes are close to each other, with the lines overlapping at various points. At face value, this suggests that some bikes are more aerodynamic at certain yaw angles, while being slower at others.

However, when you add in our error bars, drawn from our confidence margin explained above, it becomes clear that the results overlap. We can't confidently conclude a stand-out winner here.

Using just the average CdA figures, this bar chart with the error bars overlaid shows things more clearly. Of the first 10 bikes, we can't confidently conclude an order. Besides knowing that the baseline bike is significantly slower, we can only really conclude that the Look Blade 795 RS is slower than the Specialized, Trek, Factor Cervélo and Canyon.

This graph shows the power required at 40km/h for each of the bikes. The Specialized Tarmac sits at 280.2 watts (+/- our error of 3.91 watts).
The Look Blade 795 RS is at 286.29 watts, again with the same 3.91-watt leeway. Factoring in that margin, the difference between our superbikes could be nothing at all, but it could be as much as 13.91 watts.
The baseline Trek Emonda ALR came out at 304.67 watts. Factoring in that margin again, the S-Works Tarmac is at least 16.65 watts faster than the baseline but could be as much as 32.29 watts faster.
Bike only results
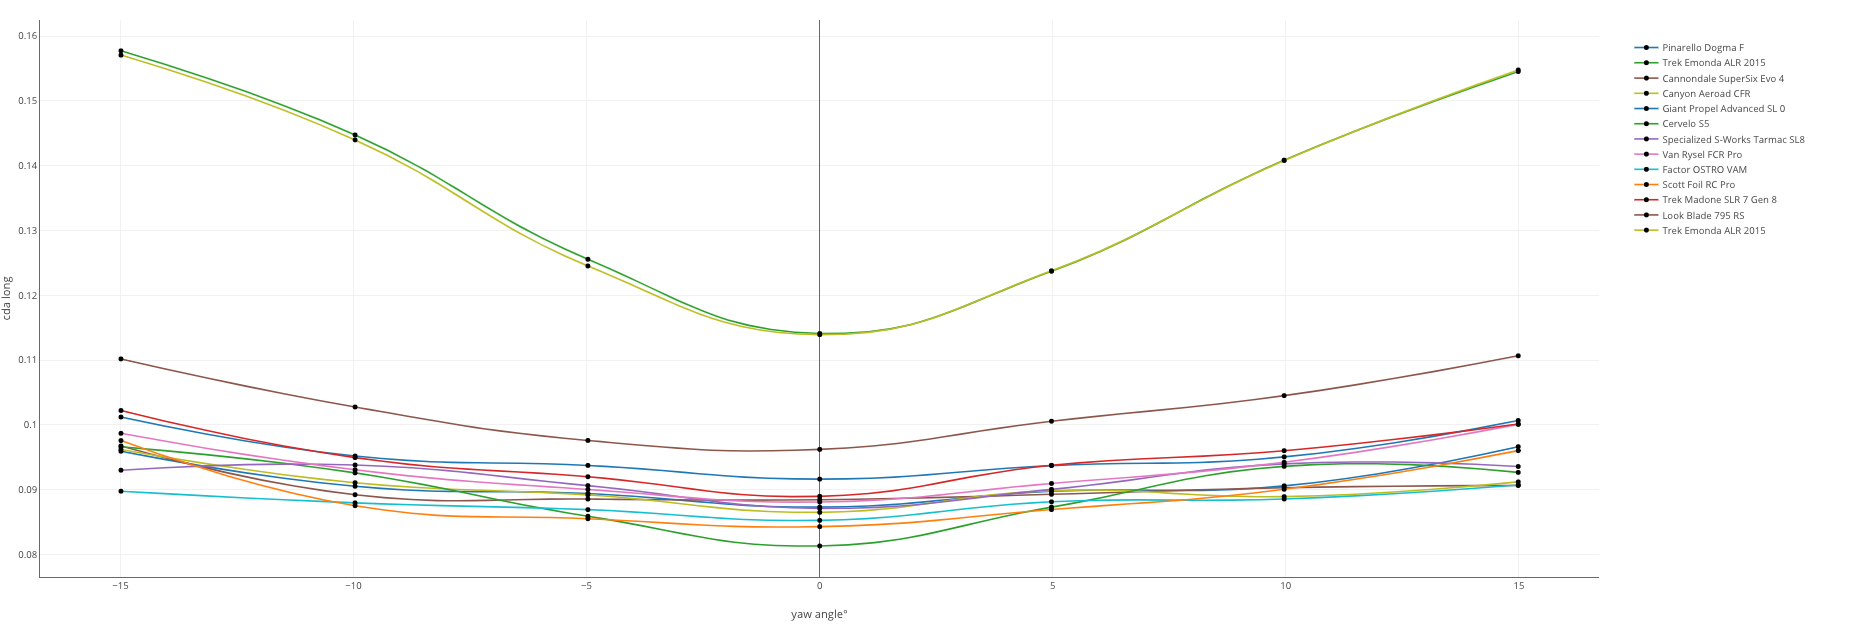
As with the rider-on-bike data above, we can see that most of the race bikes sit in a cluster together, while the two baseline bike runs sit significantly higher. This shows that the race bikes are generally more aerodynamic than the baseline. Another good start!
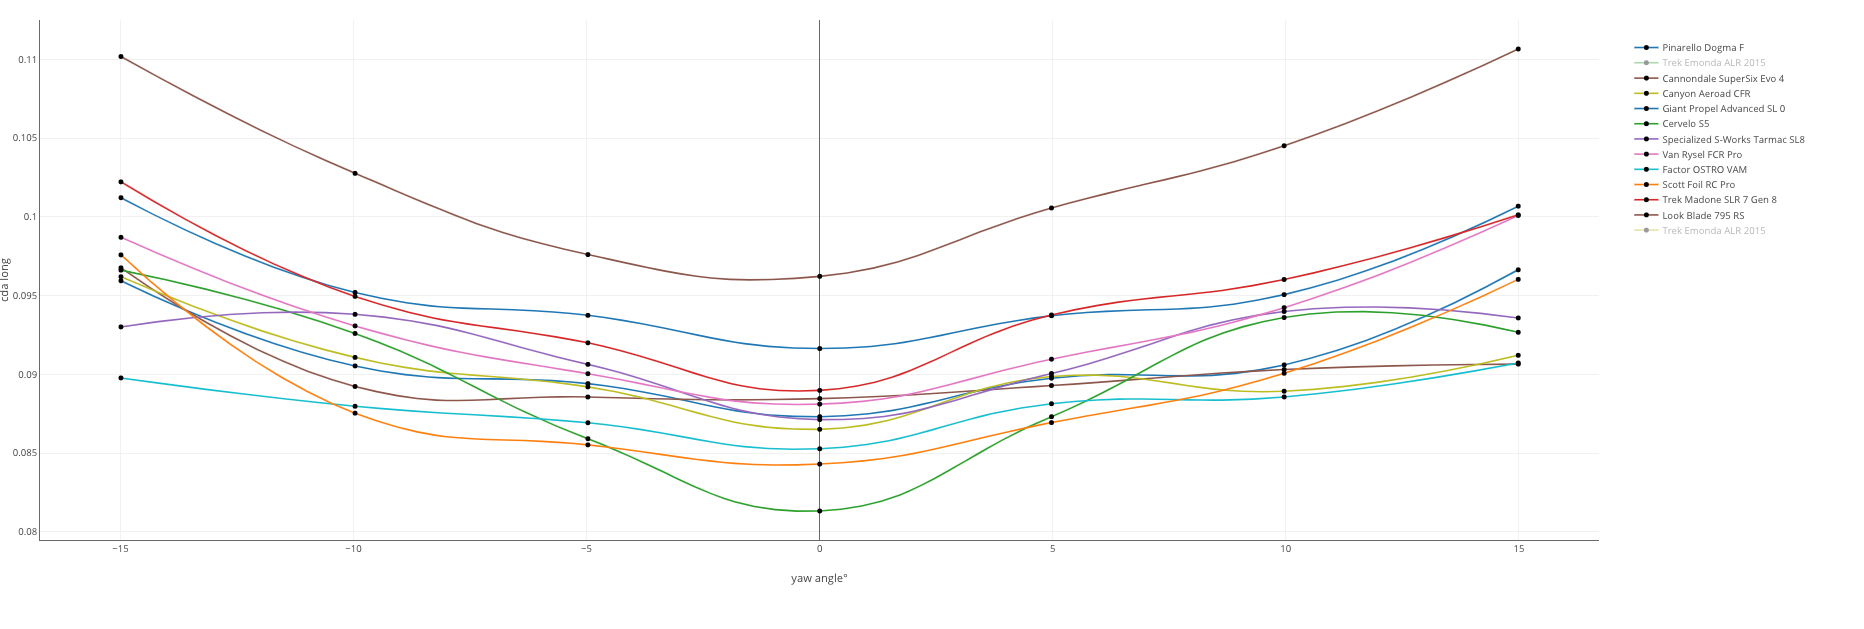
However, with the two baseline runs removed we can see that, unlike the rider-on-bike data, the remaining lines have a bit more consistency. By this, we mean that a bike that is faster at a given yaw is commonly faster at other yaw angles too. There are some instances of lines crossing over, but the data appears cleaner.

And here, with the error margin added in, we can see that although there is still some crossover, we can confidently conclude that some of the bikes are faster than others, and that the Look is markedly slower. We still can't quite tease out an outright winner, but we can be confident in saying the Cervelo S5 is fast at zero yaw, adding more drag in the crosswinds, whereas the Factor OSTRO tends to be less quick at zero yaw, but performs well across the full sweep.

And here with the average CdA across the full sweep for each bike, and showing the error bars again, we can conclude that the Factor OSTRO VAM is fastest, with an average CdA of 0.0882 (+/- 0.0010).
However, the Scott Foil and Cervélo S5 were close enough (at 0.0897 and 0.0900 respectively (+/- 0.0010)) that they fall within our margin of error, so they too can lay claim to victory.
The Canyon Aeroad and Cannondale SuperSix sit close behind, within 0.0004 m^2 of each other, and therefore can both lay claim to 2nd place.
The Pinarello Dogma F and S-Works Tarmac sit a little further back, but can both lay claim to a podium finish when our margin is factored in.
The Van Rysel RCR Pro, Giant Propel and Trek Madone all sit mid table, while the Look Blade 795 RS is further behind. All bikes are significantly faster than our baseline, with its CdA of 0.1370.

We know that bikes cannot pedal themselves, but for comparison, this graph shows the power required at 40km/h for each of their respective CdA figures above.
The Factor OSTRO VAM lands at 72.59 watts (+/- 0.85 watts).
Our slowest superbike, the Look Blade 795 RS, sits at 84.95 watts with that same 0.85-watt margin.
The baseline bike's best result was 112.74 watts, but when you factor in that margin, you stand to save between 38.45 and 41.85 watts.
It's worth remembering, however, that this is a reflection of bike-only data. Given the bike is only a fraction of the total CdA a cyclist will have, the effect will be reduced, hence the smaller difference outlined in the rider-on-bike data above.
The conclusions
Which bike is the fastest?
Although the Specialized Tarmac came out on top in our rider-on-bike test, closely followed by the Trek Madone and the Factor OSTRO VAM, our margin of confidence means that on another day, any of the bikes could have landed on top.
It is therefore difficult to draw any meaningful or confident conclusion as to the fastest bike.
What's more, at each different yaw angle, the order flip-flops quite a lot, further suggesting our variability is greater than the difference between each bike. While our margin is reflective of typical rider-on-bike data, when combined with the other considerations and the tightly packed results, we're unable to confidently say that any one bike is the out-and-out fastest. Therefore, if considering which one to buy, we would look at other factors such as weight and ride quality.
From the bike-only data, the results appear cleaner, with more consistent results across the seven yaw angles. The top of the table is packed with the more dedicated aero bikes such as the Factor, Scott and Cervelo, but the more 'all-rounder' bikes hold their own well at around 2-5 watts behind.
Taking into account an unweighted average CdA at the seven yaw angles, the Factor Ostro was the fastest in this test, but when factoring in our margin of error, it could finish as low as 3rd. That's still a very impressive result given it was also the second-lightest on the day at 7.23kg.
However, you could argue that the Cervélo S5 would actually be the fastest in the real world due to its low-yaw performance. At 40km/h you are more likely to experience lower yaw angles due to the onrushing wind.
The Cannondale SuperSix Evo also performed well for an 'all-rounder', and although it landed in 5th on the day, given our CdA error margin of 0.0010, it could finish as high as 2nd.
The only bike to sit outside of the ballpark is the Look Blade 795 RS at around 12 watts behind.
Our baseline Trek Emonda sits at a further ~28 watts back, or around 40 watts behind the OSTRO VAM.
To answer our earlier question of whether modern bikes are all within such a small margin that you can ignore the aero claims made by manufacturers, the answer is... sort of! We might have been unable to confidently conclude which bike is the fastest, but we were able to find the slowest, and all of our superbikes were a marked step above the baseline.
With that in mind, you cannot ignore aerodynamics entirely when buying your next bike. Given the rider-on difference between the best and worst race bikes here could be as big as 13.90 watts, you still stand to lose speed if you buy the wrong bike.
How many watts can you save vs your old bike?
If we're happy to accept that our baseline Trek Emonda from 2015 is representative of your generic old bike, then the savings can be anywhere between 16.65 and 32.29 watts when compared to the fastest on test.
Even at a more attainable solo ride pace of 30km/h, you stand to save between 7.03 and 13.62 watts.
However, if you extrapolate the data to 50km/h, the saving grows to between 32.54 and 63.05 watts, but it's worth saying you're unlikely to be able to hold this pace fore more than a few minutes without drafting in a group, where the aerodynamic requirement becomes lessened.
It's also worth noting that there are cheaper ways to save this many watts. You could buy an aero helmet, a skinsuit, some new wheels and improve your position for significantly less than even the cheapest bike on this test, but if you're looking for a reason to spend the money, you now have one. You're welcome.
Results and data for each individual bike
We have ordered this section by the average (unweighted) CdA from the seven yaw angles from the more reliable bike-only test data. Starting with our baseline, we will work down from the least aerodynamic to the most, as the results came out of the wind tunnel.
For each bike, we will list the unweighted average CdA from the seven yaw angles in each test individually, along with an accompanying line graph.
We will then use it to calculate the power required to ride at 40km/h (24.85mph) using the following calculation, where velocity = metres per second.
Power (watts) = 0.5 x AirDensity x CdA x Velocity^3
We will also calculate the time taken to ride 40km at a steady 250 watts, using the following calculation:
Speed (km/h) = 3.6 x ((Power / (0.5 x AirDensity x CdA)) ^⅓)
For both, we will use a consistent air density of 1.2kg/m3.
We will report both as a delta (the difference) against our baseline bike.
Baseline: Trek Emonda ALR 2015
Average CdA
0.3702
Power at 40km/h
304.67
Time to cover 40km at 250w
01:04:05
Average CdA
0.1370
Power at 40km/h
112.74
Time to cover 40km at 250w
00:46:01
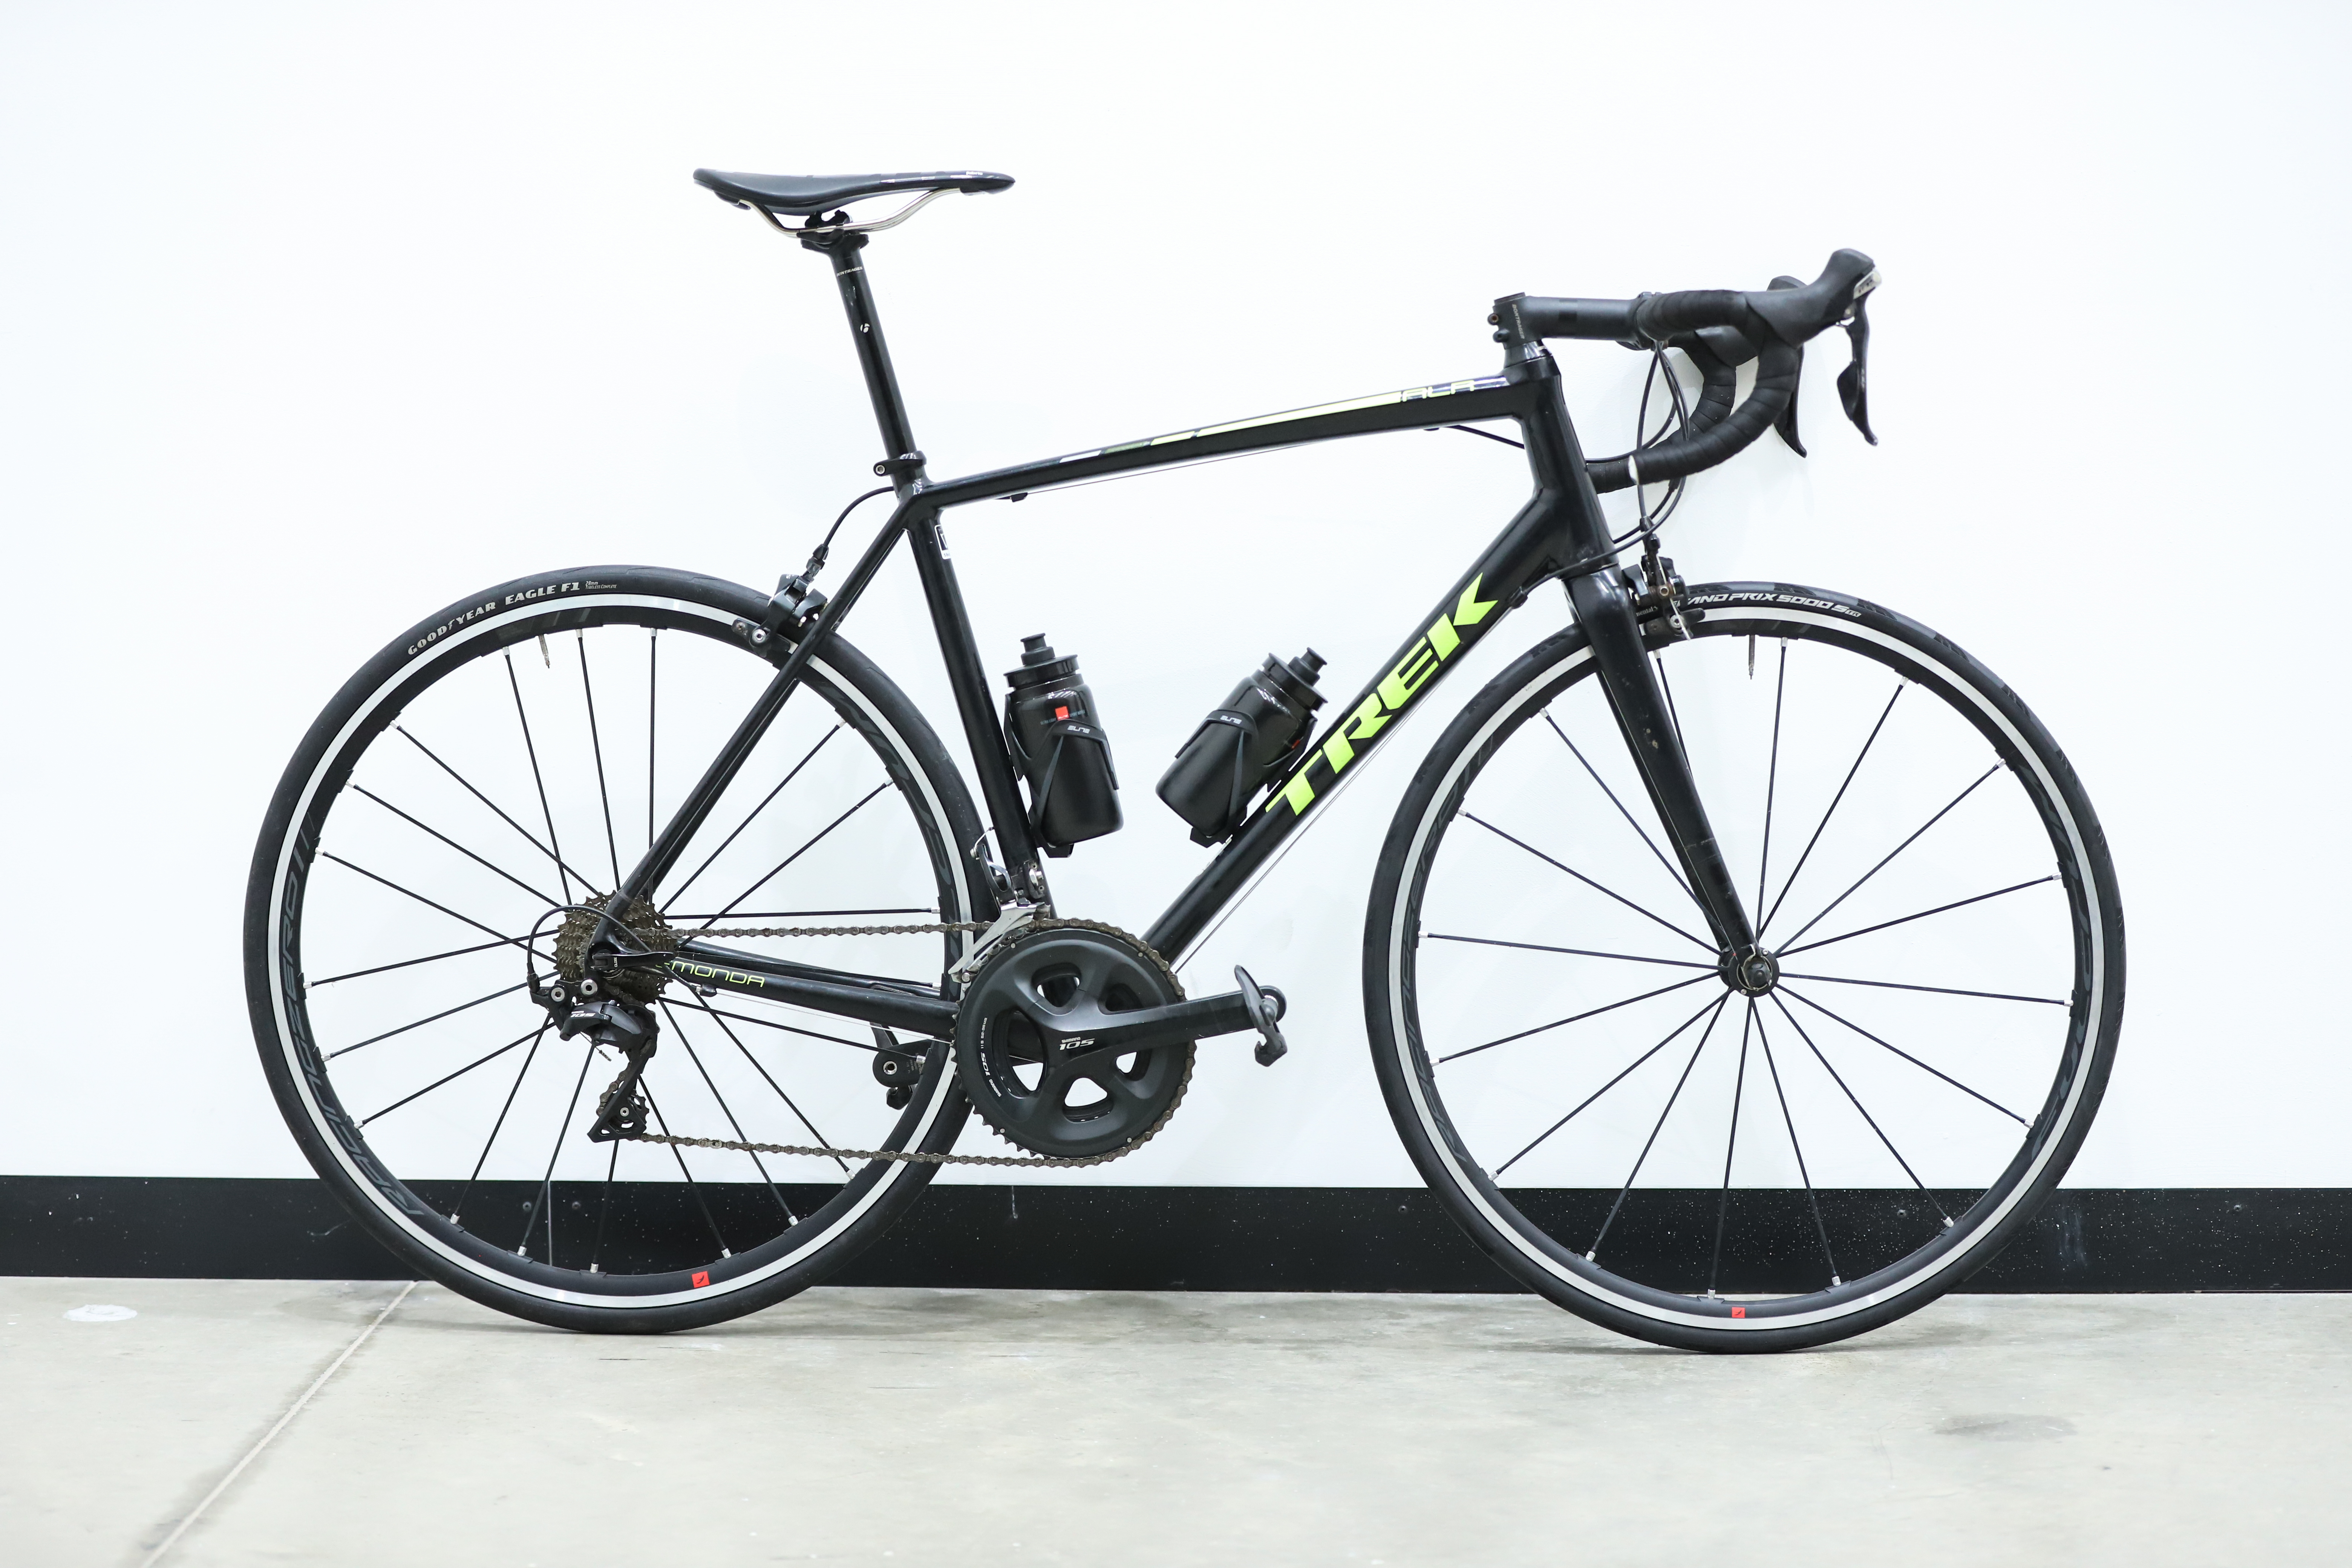
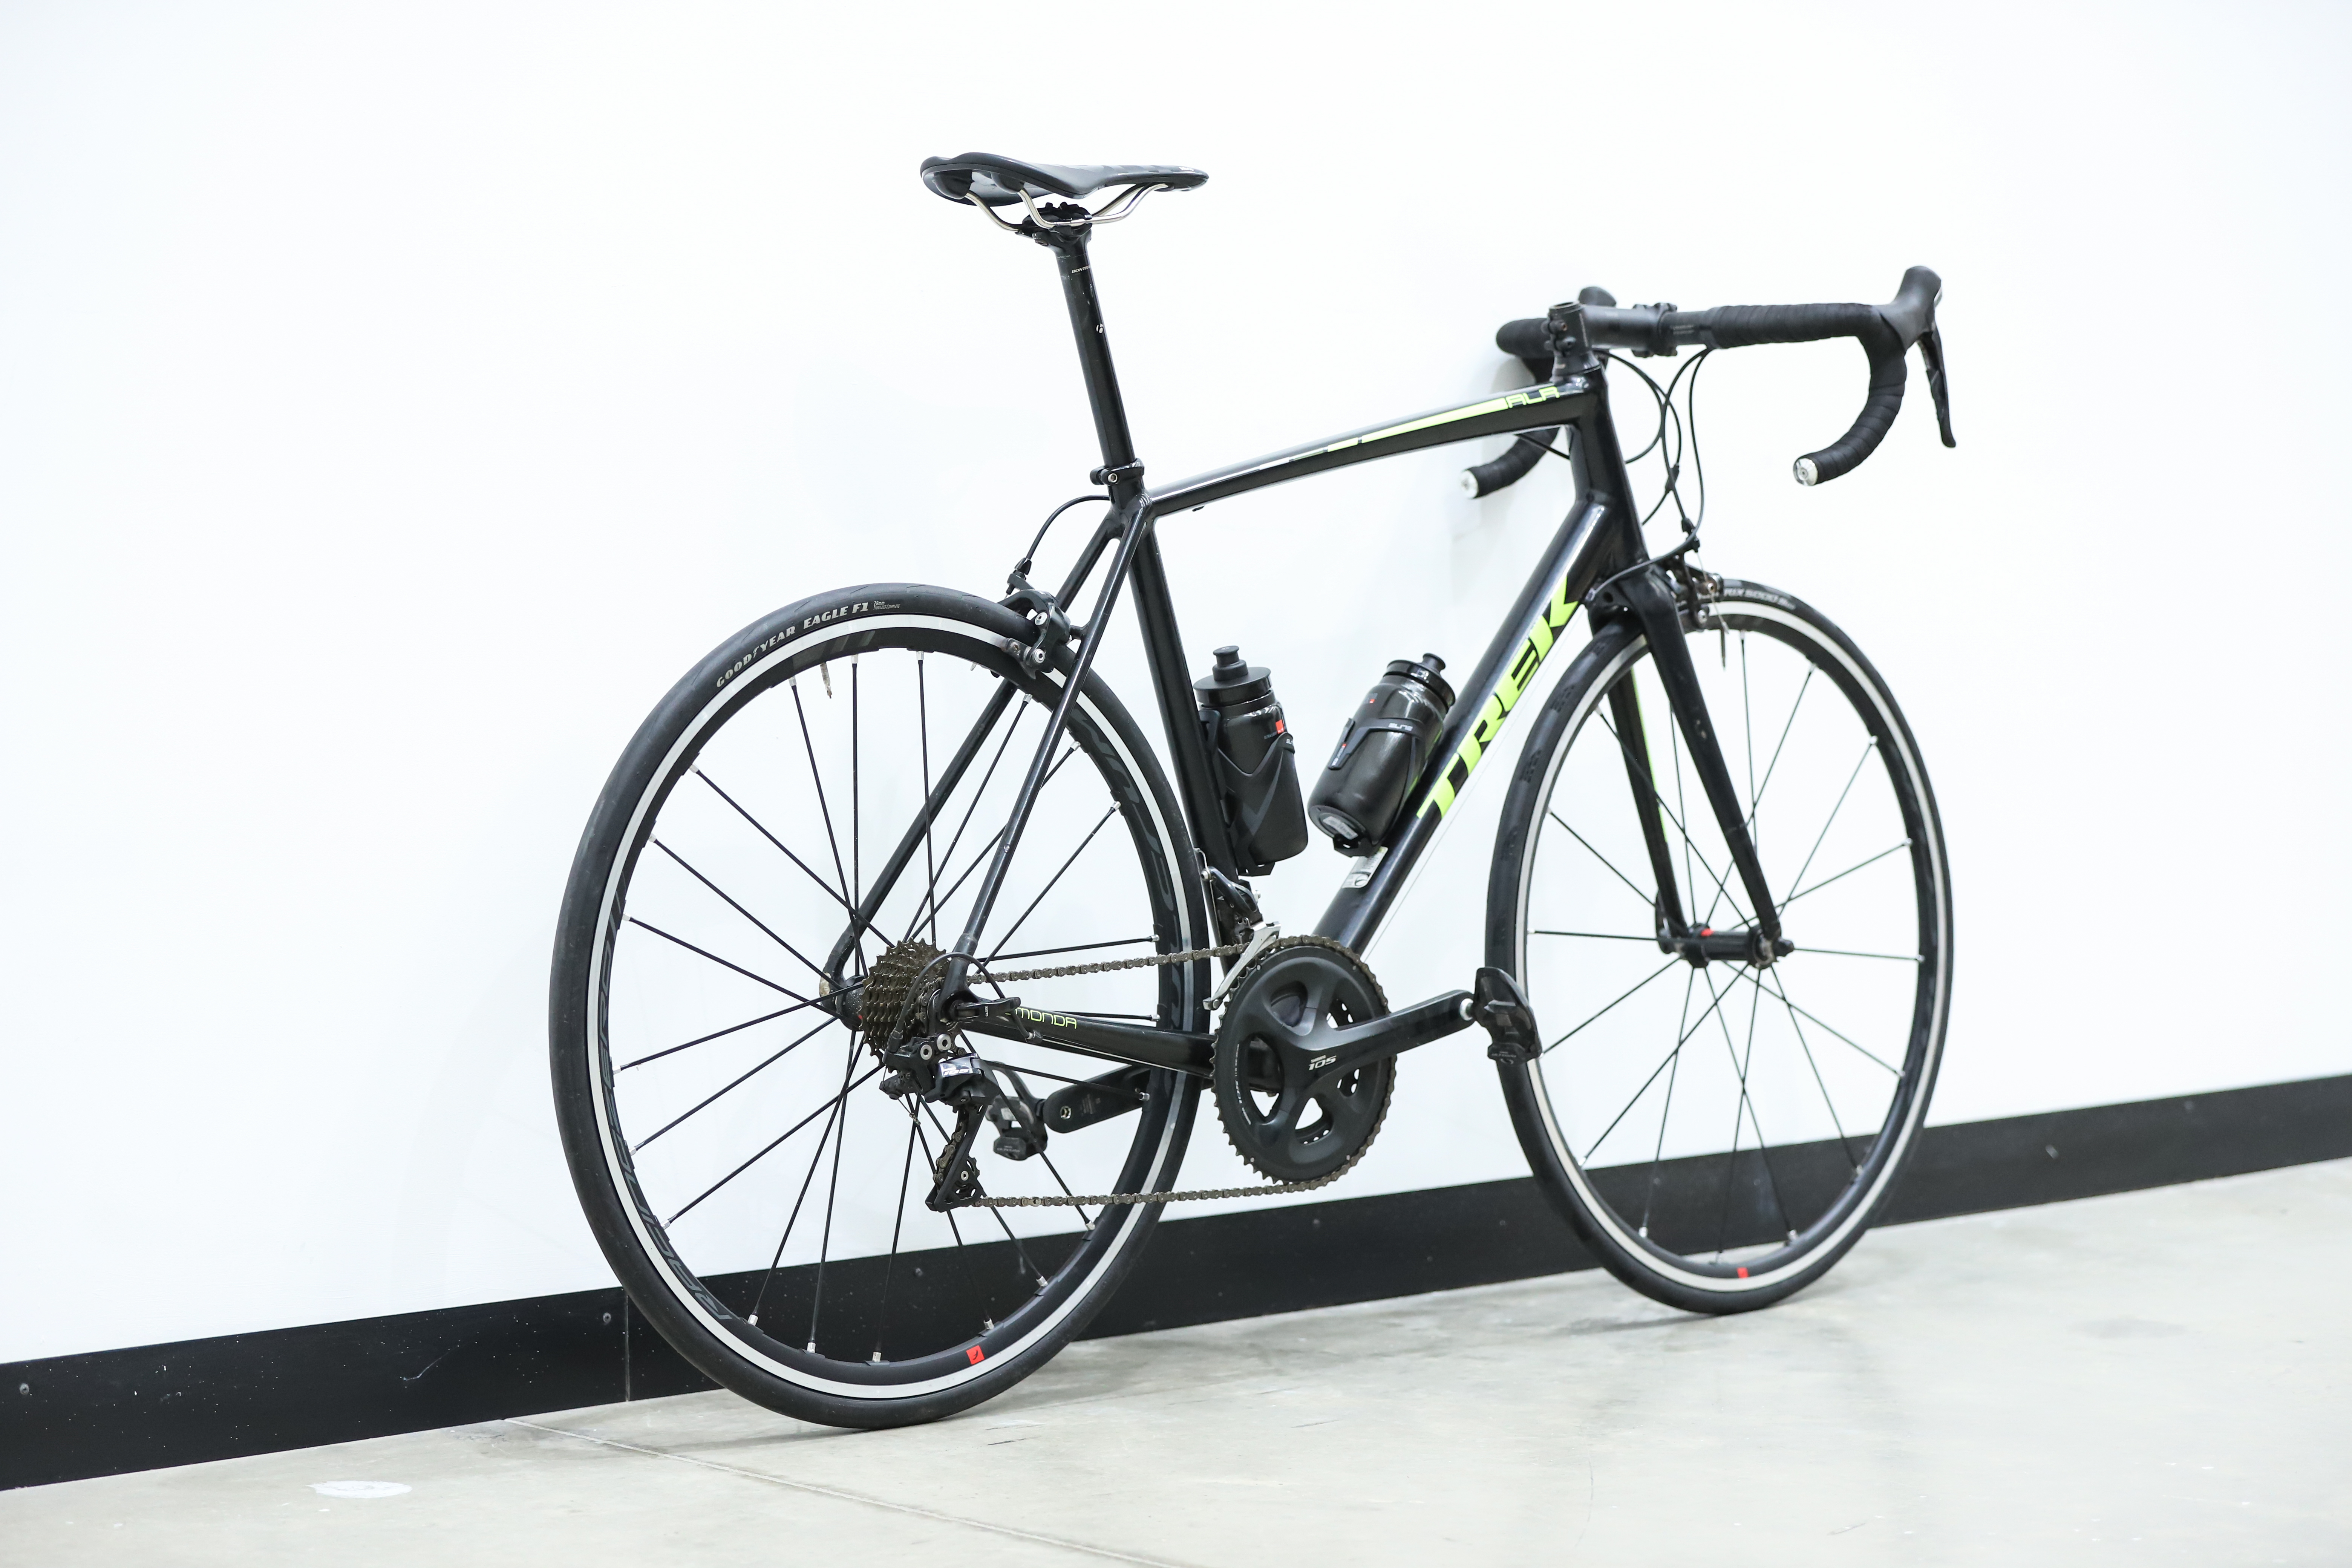
The baseline bike for our test is my very own bike. I bought it in around 2017 as a winter training bike. It served me well for around three years, but ever since I started at Cyclingnews, it has been in retirement as other test bikes took precedence.
The reason for using this bike is twofold. First, it's ours - we can keep it in this exact state and bring it back to the wind tunnel in future tests and hopefully be able to compare future test data to the data featured here.
What's more, we think it loosely represents Your Generic Basic Bike. So you can get a feel for how many watts you're likely to save by upgrading from a basic bike to an aero-optimised race bike.
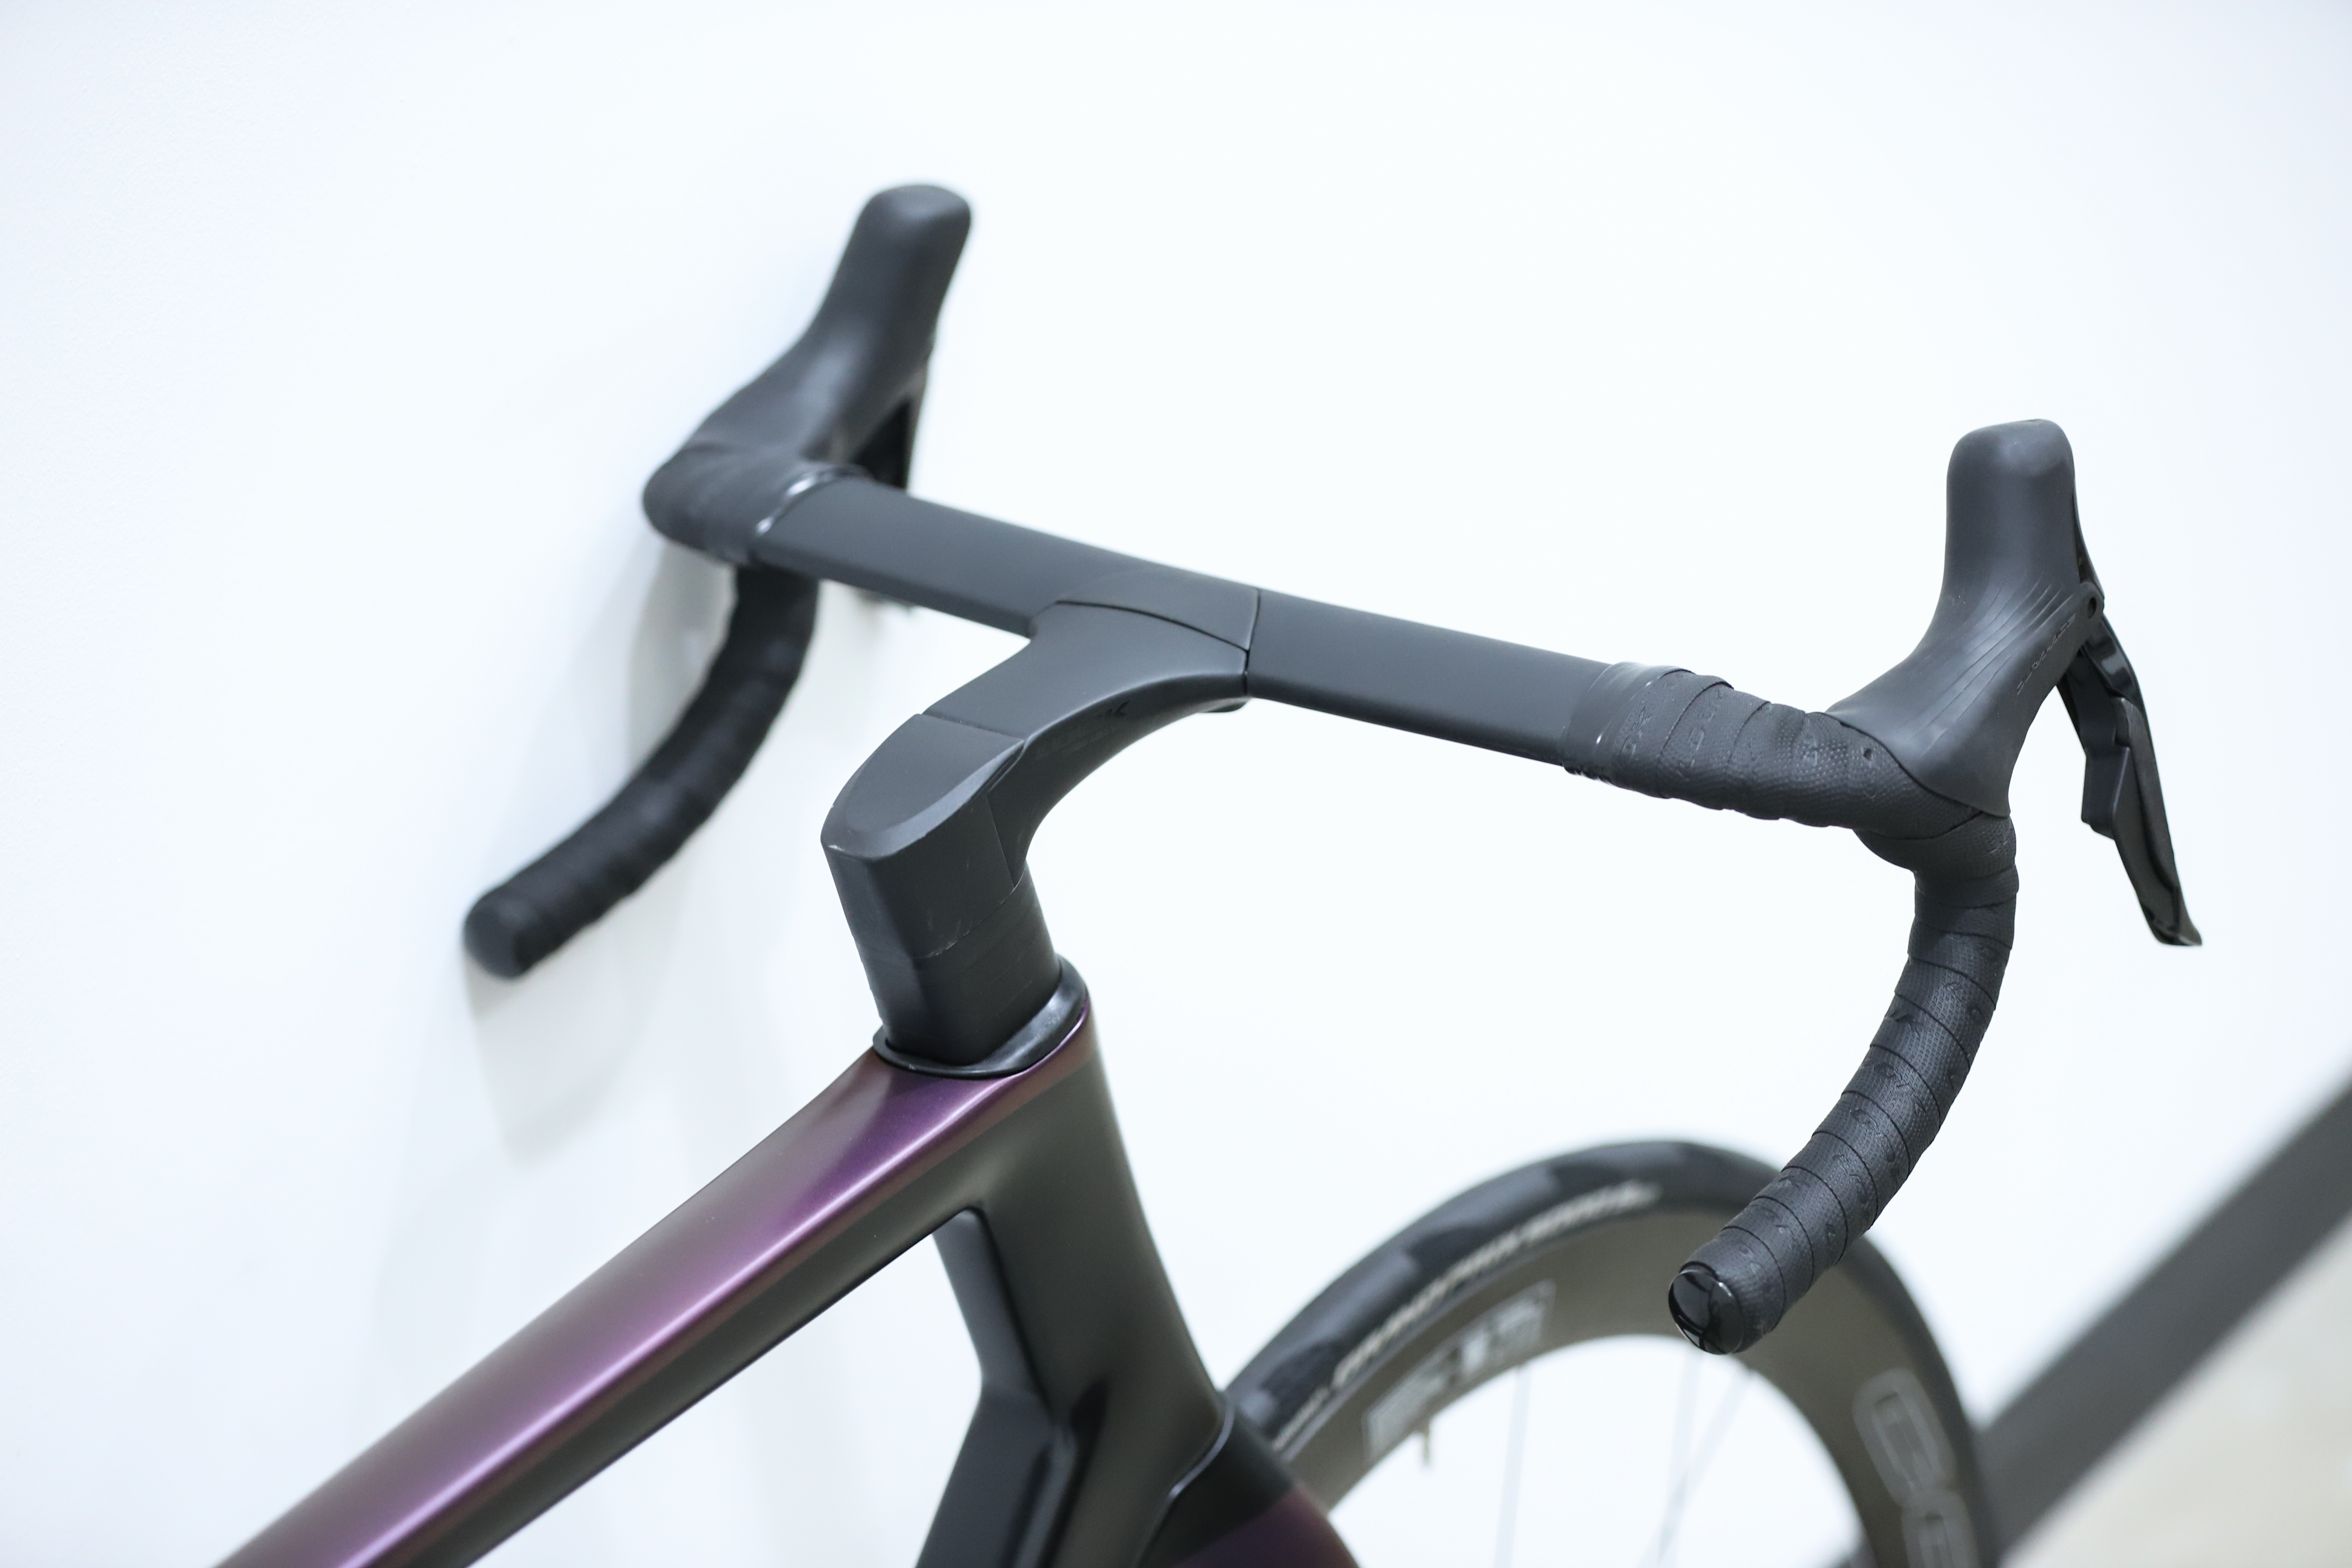
Look Blade 795 RS


Average CdA
0.3478
Watts saved at 40km/h
18.38
Time saved over 40km at 250w
00:01:19
Average CdA
0.1032
Watts saved at 40km/h
27.79
Time saved over 40km at 250w
00:04:09
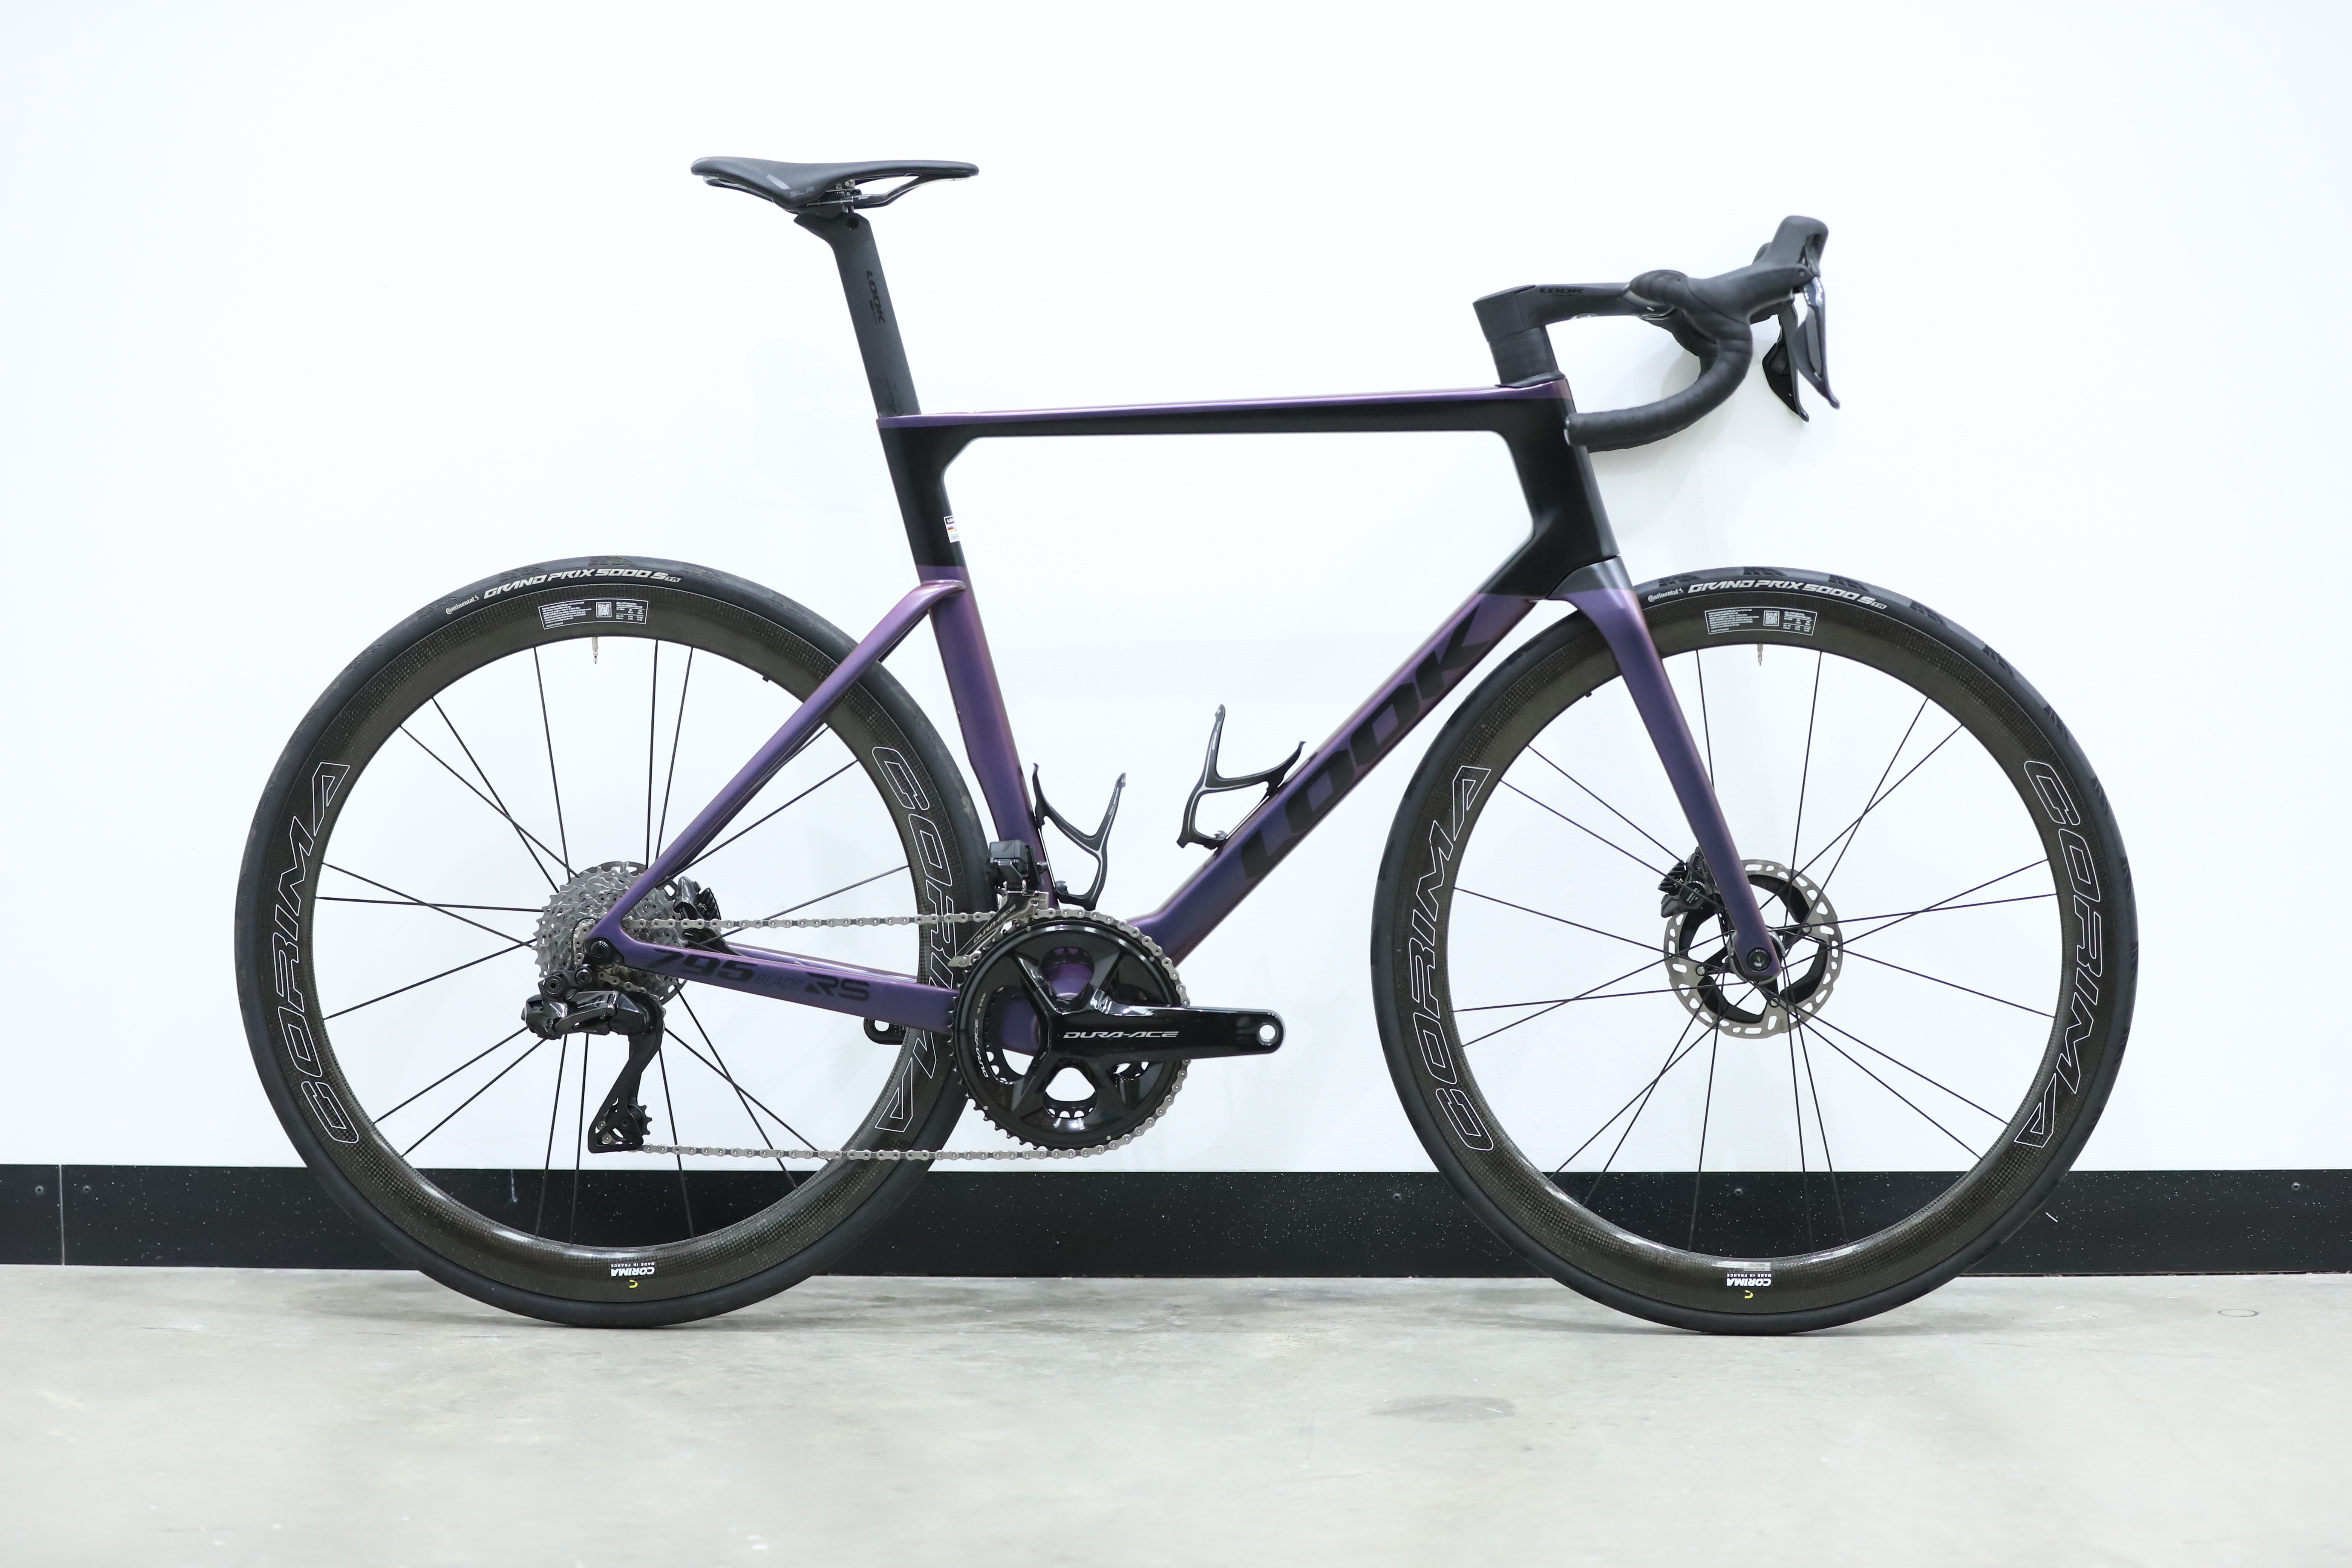
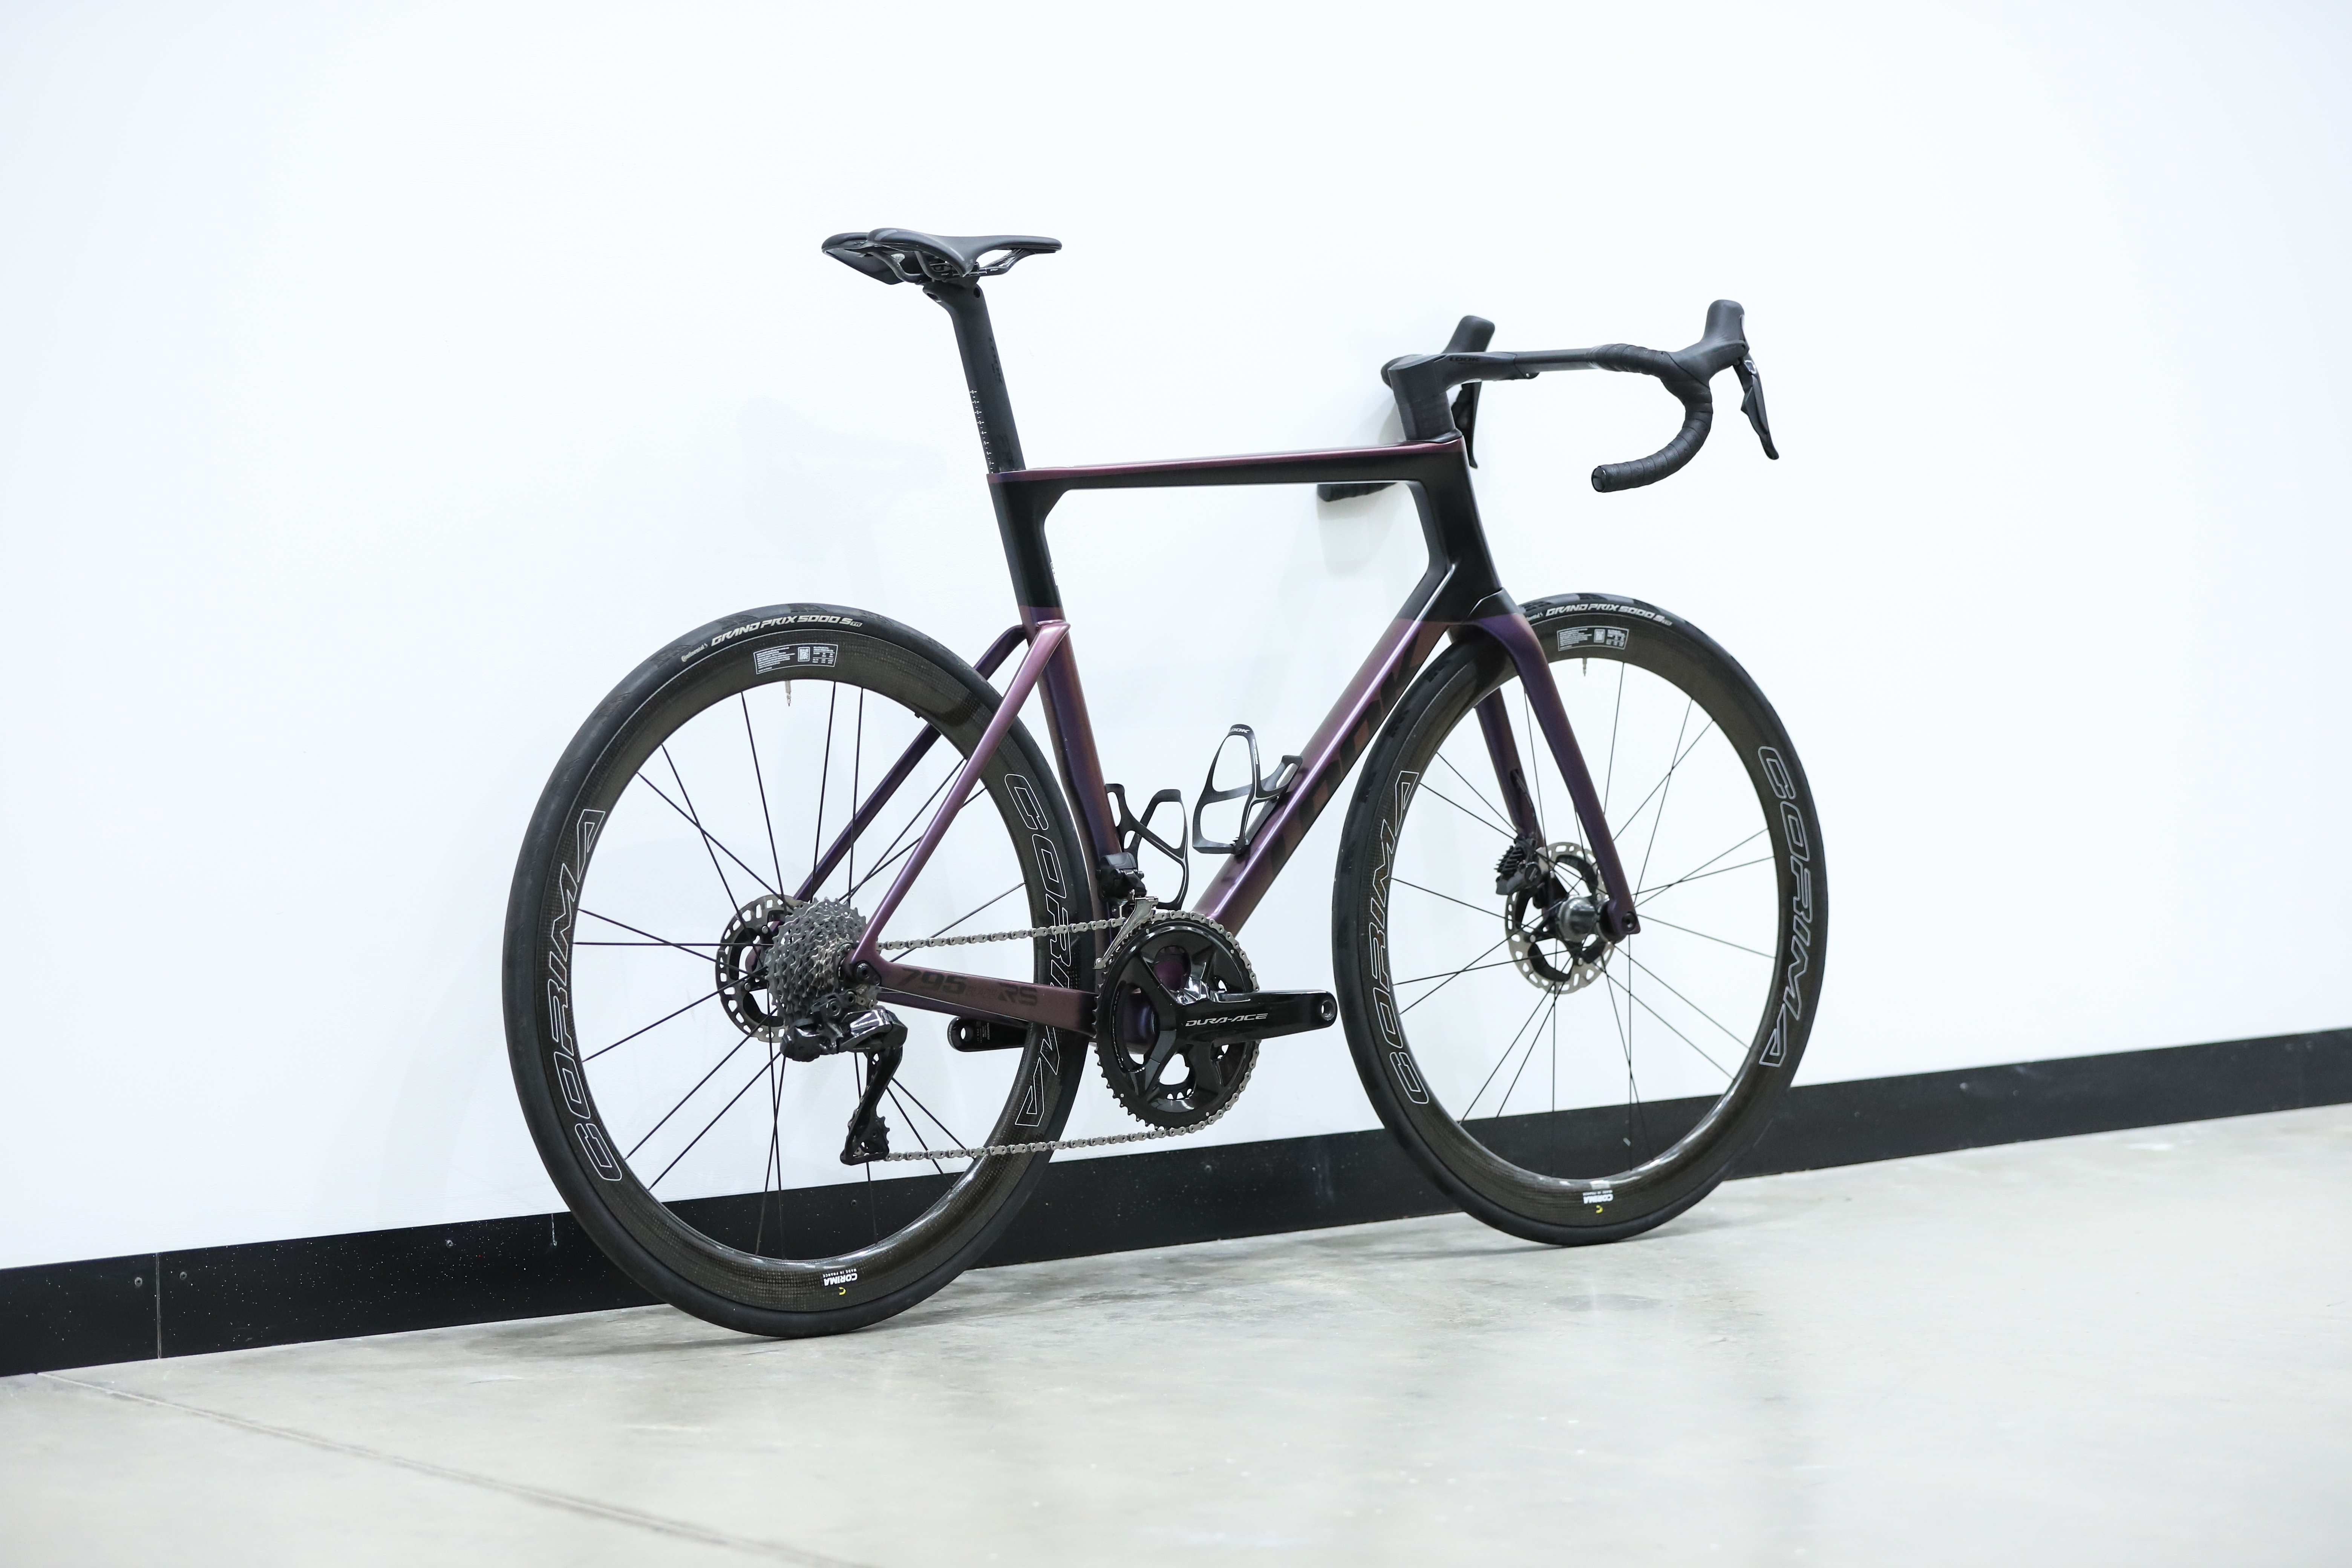
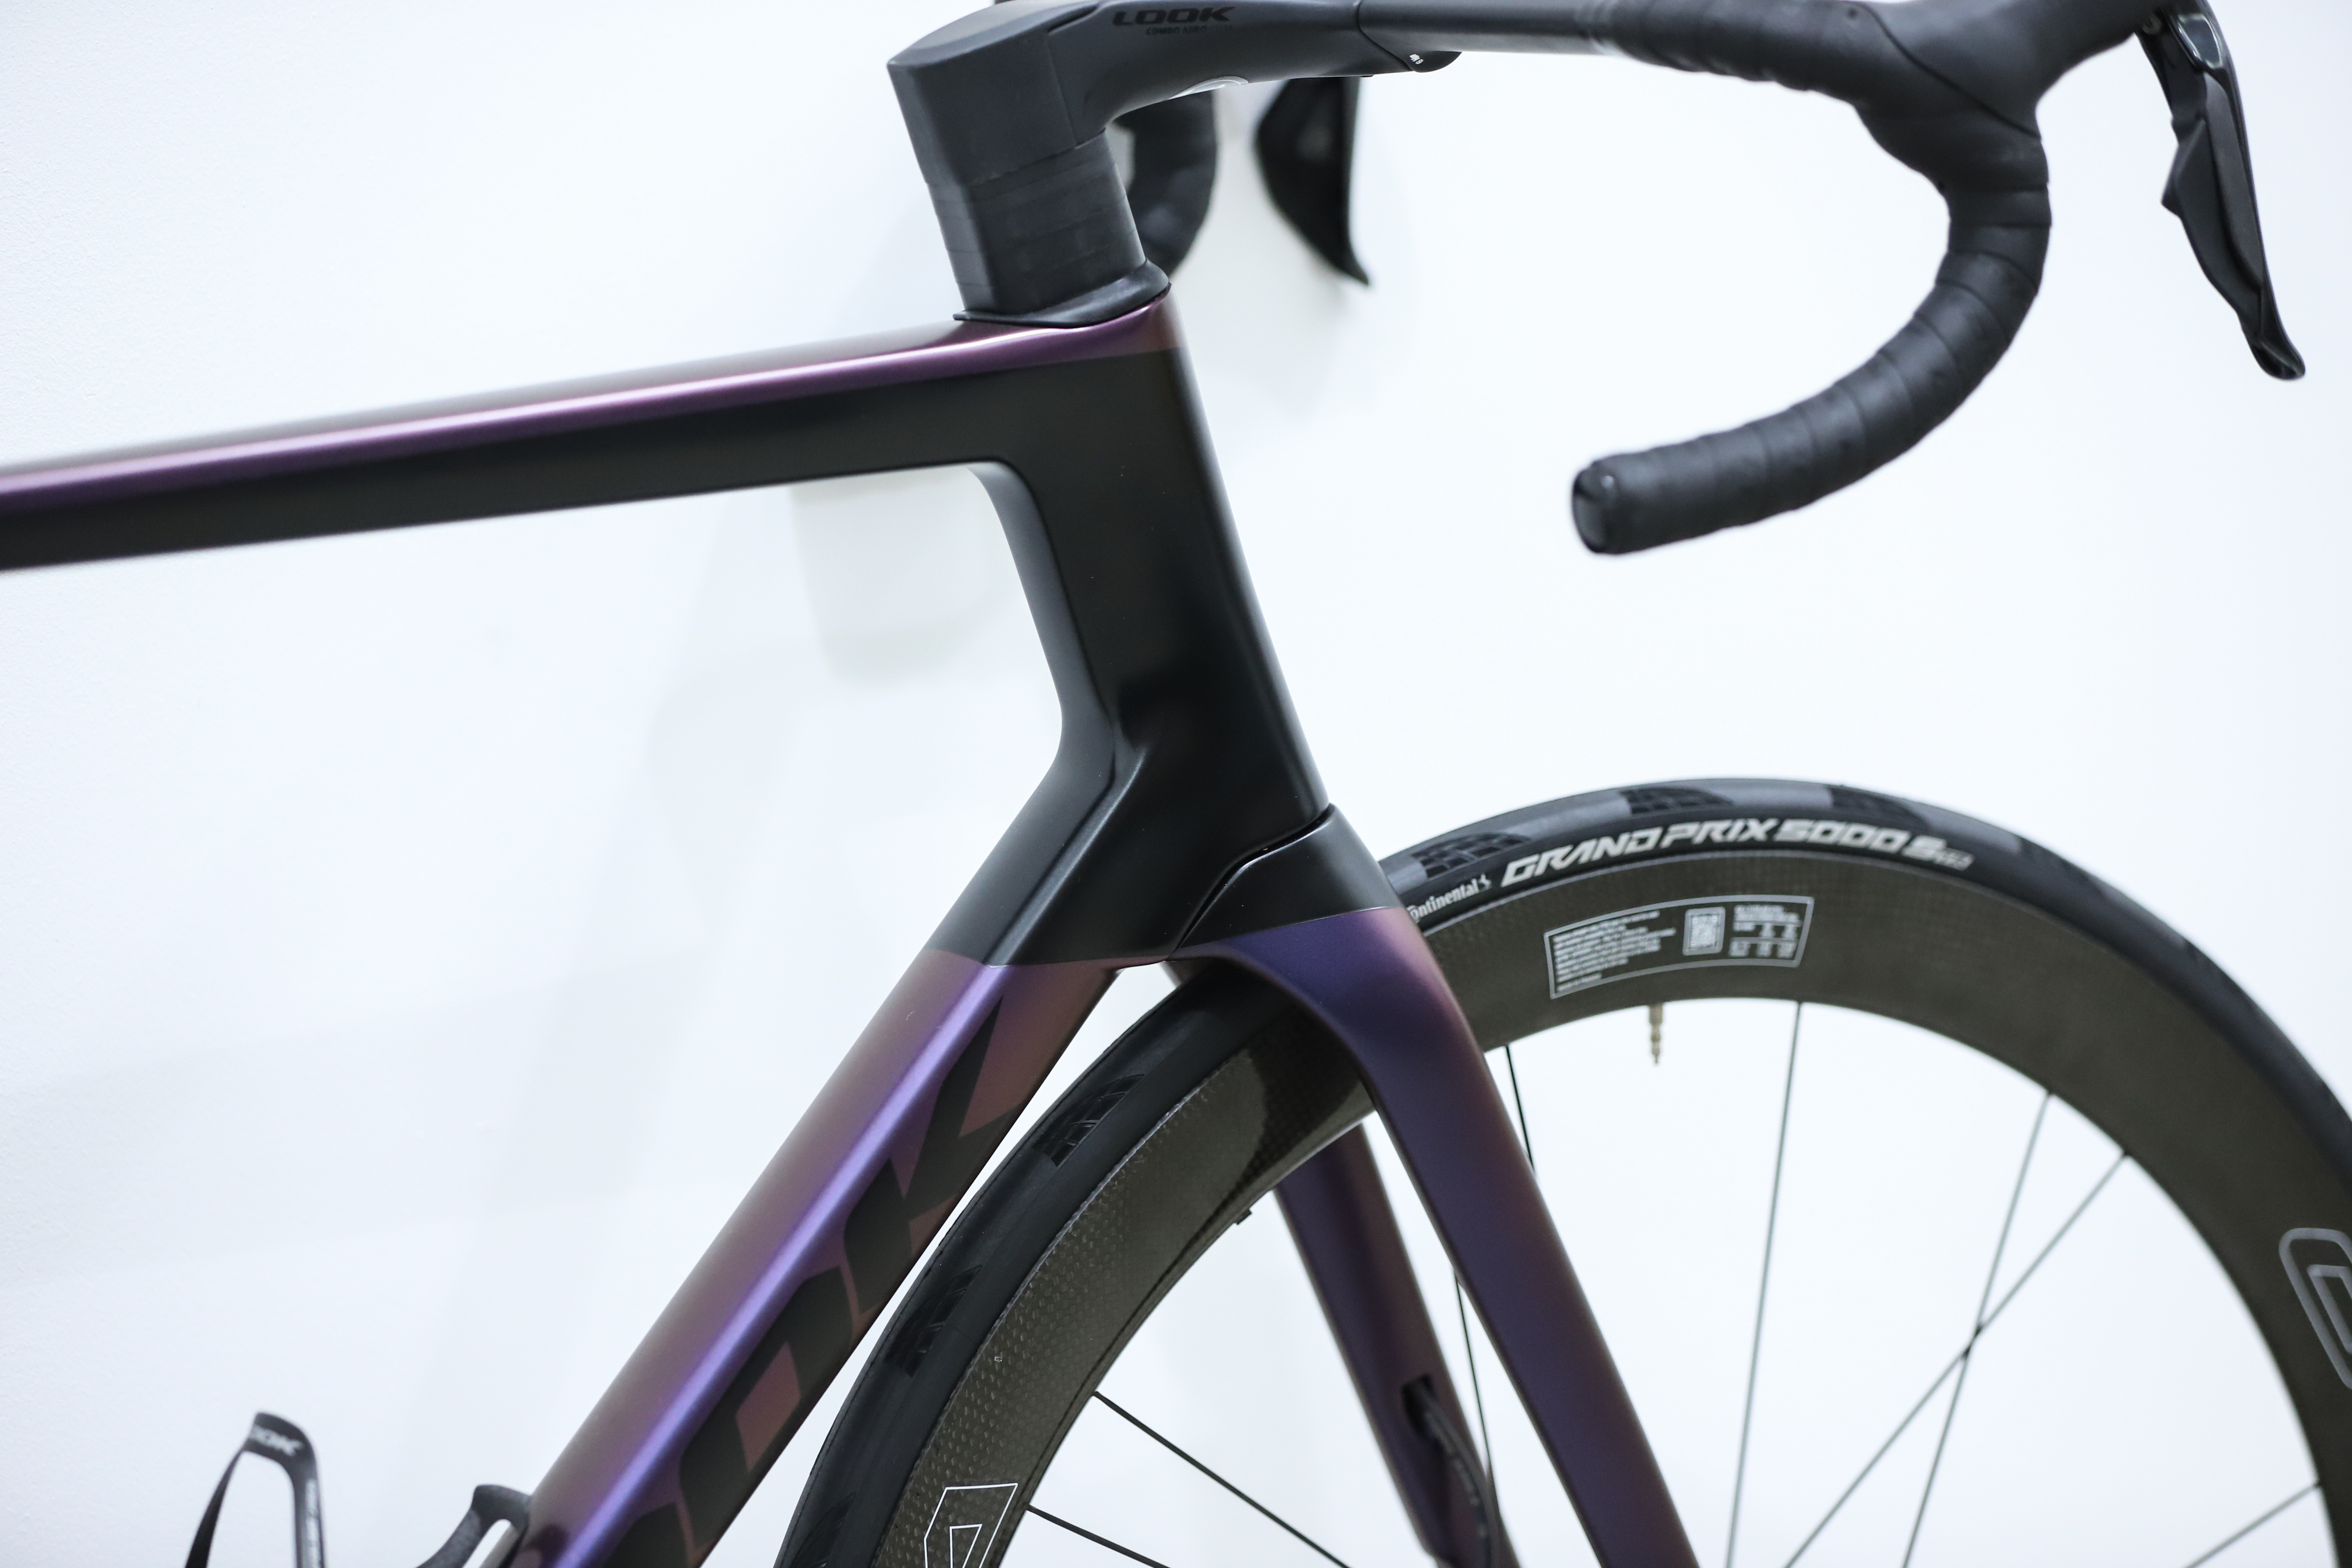
At 7.75kg, it's not the lightest here - the S-Works Tarmac is over 500g lighter - but it certainly isn't the heaviest. However, it is the slowest of our superbikes in terms of drag, coming in last place in both tests.
That isn't conclusive in the rider-on test with our margin of error taken into account, but in the bike-only test, it was slower than every other bike at each of the seven yaw angles tested.
With that said, it was still significantly faster than our baseline bike, and our Look 795 Blade RS review shows there's more to a bike than just aero stats. With a rider on, you'd still stand to save between 10.57 and 26.19 watts by upgrading. It is also perhaps worth noting that Look itself states 'efficiency' was the goal for this machine rather than simply aerodynamics, and a few watts were willing to be spared in the name of useability.
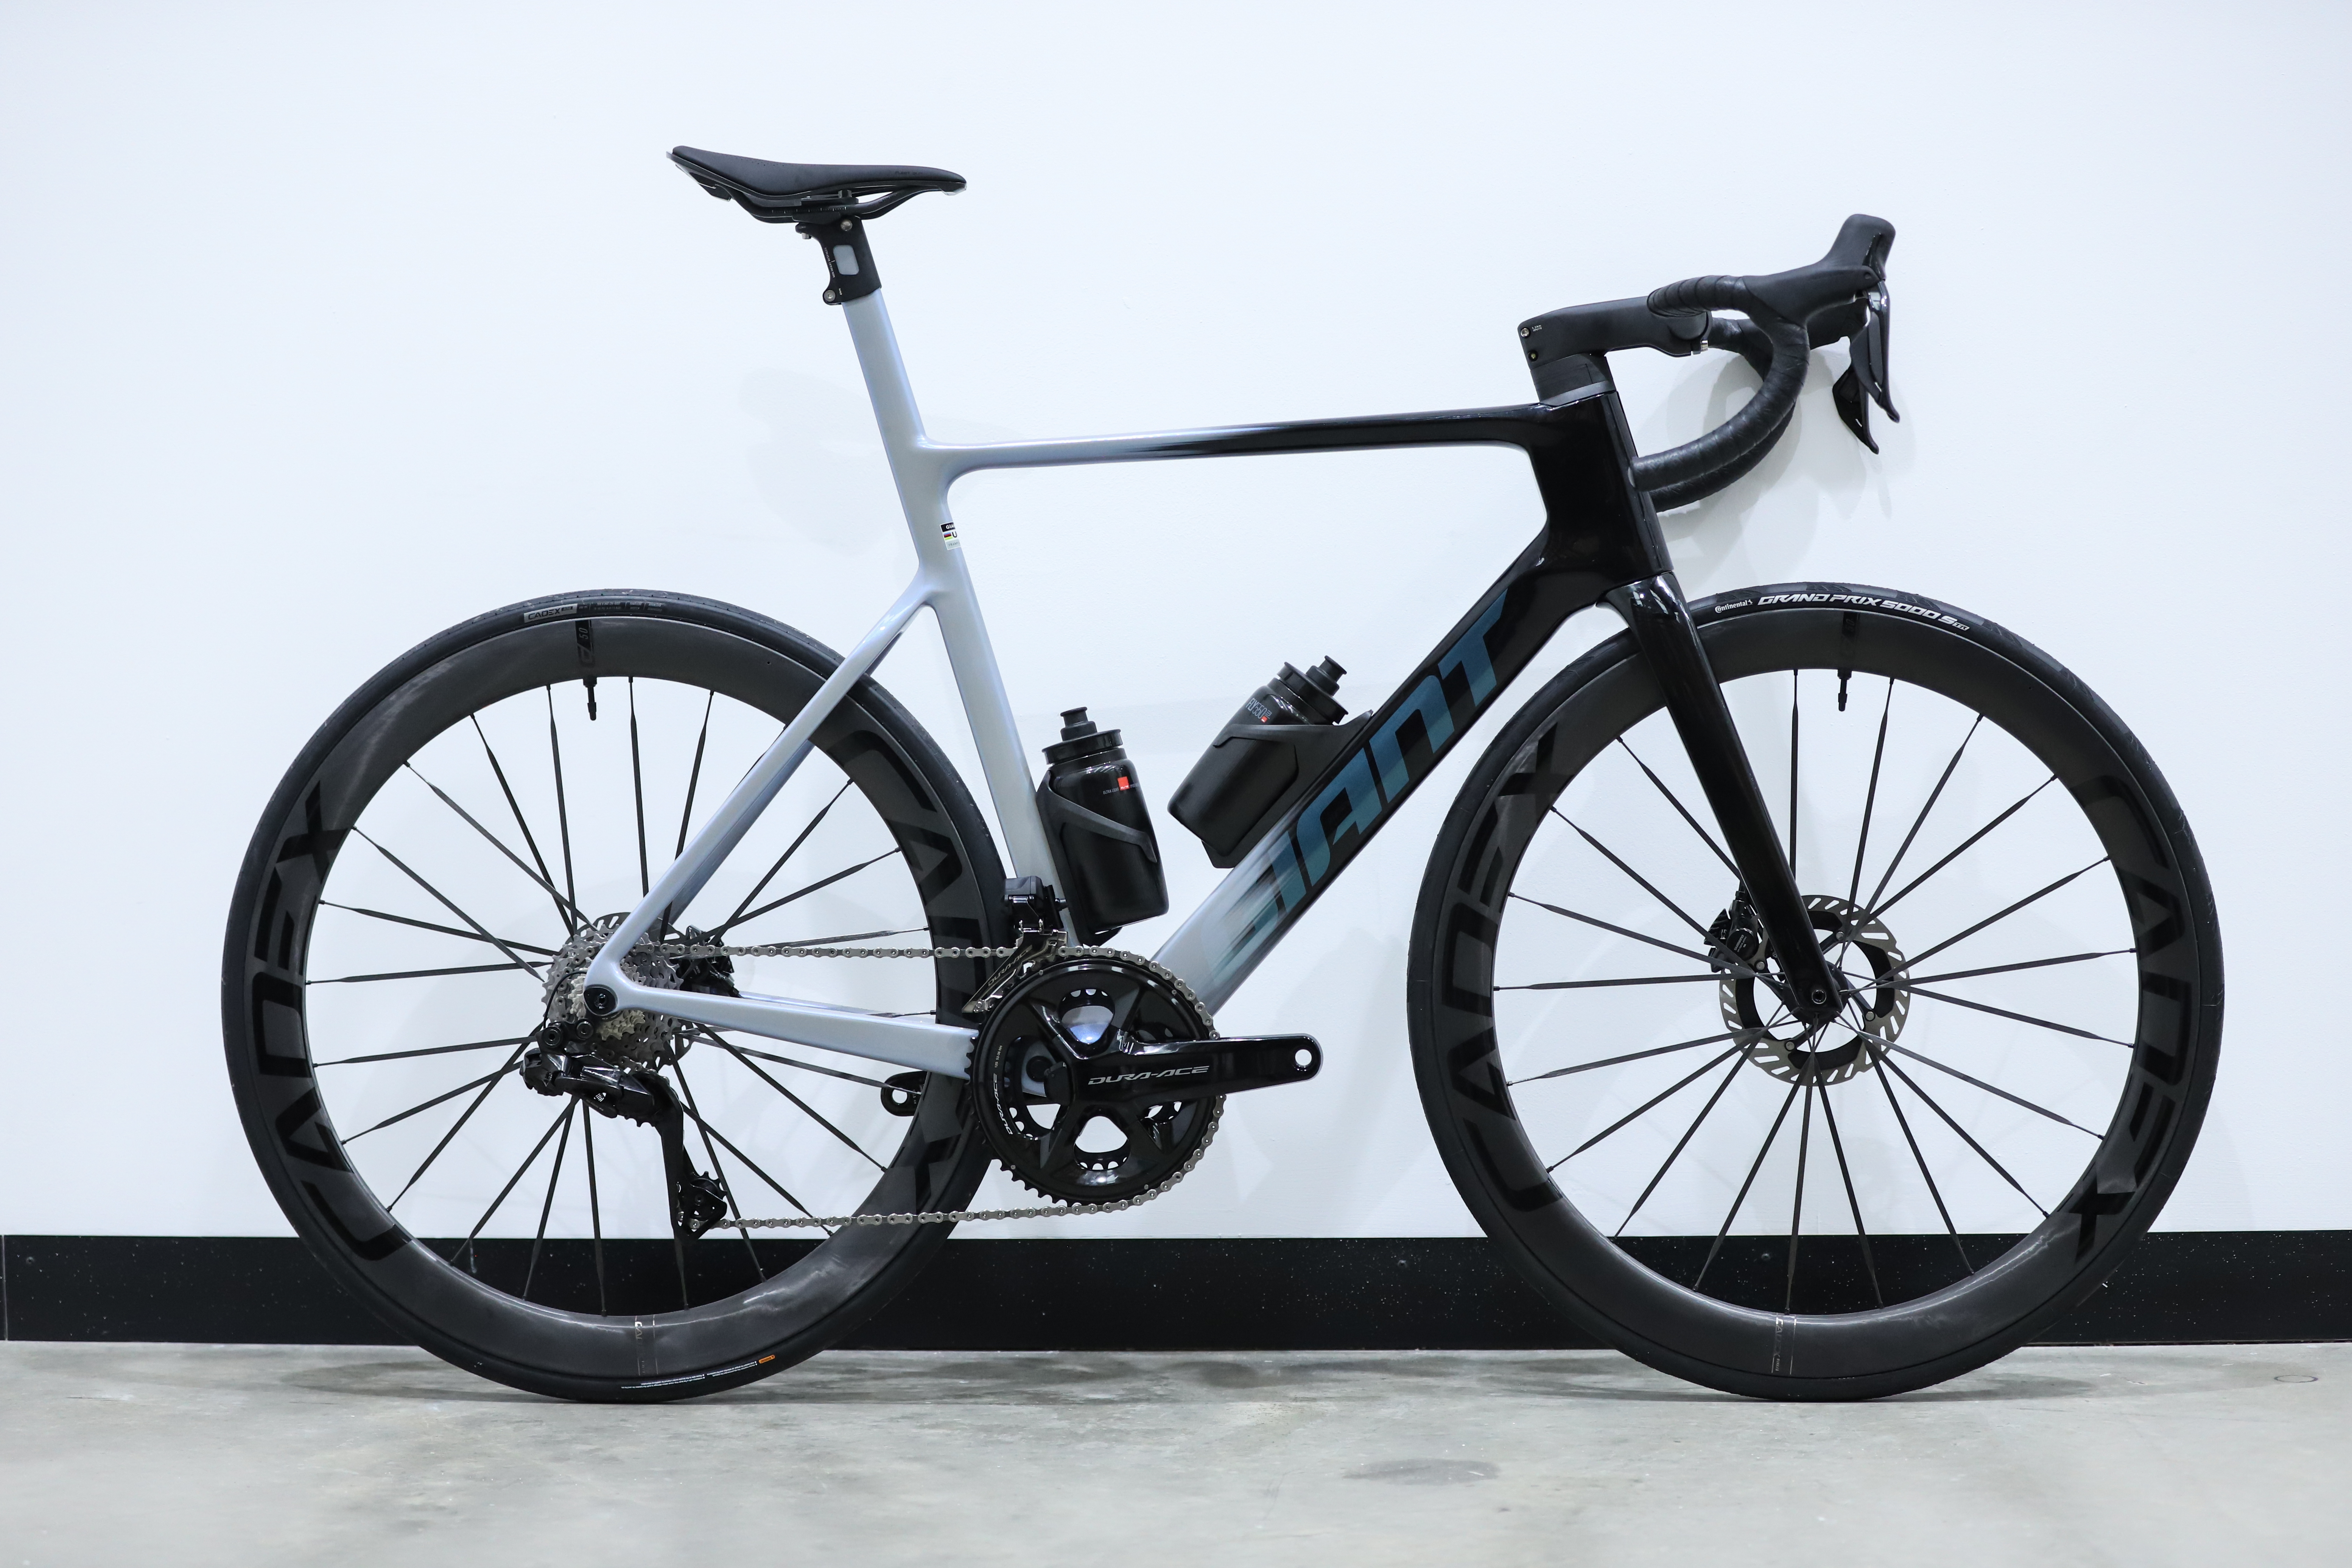
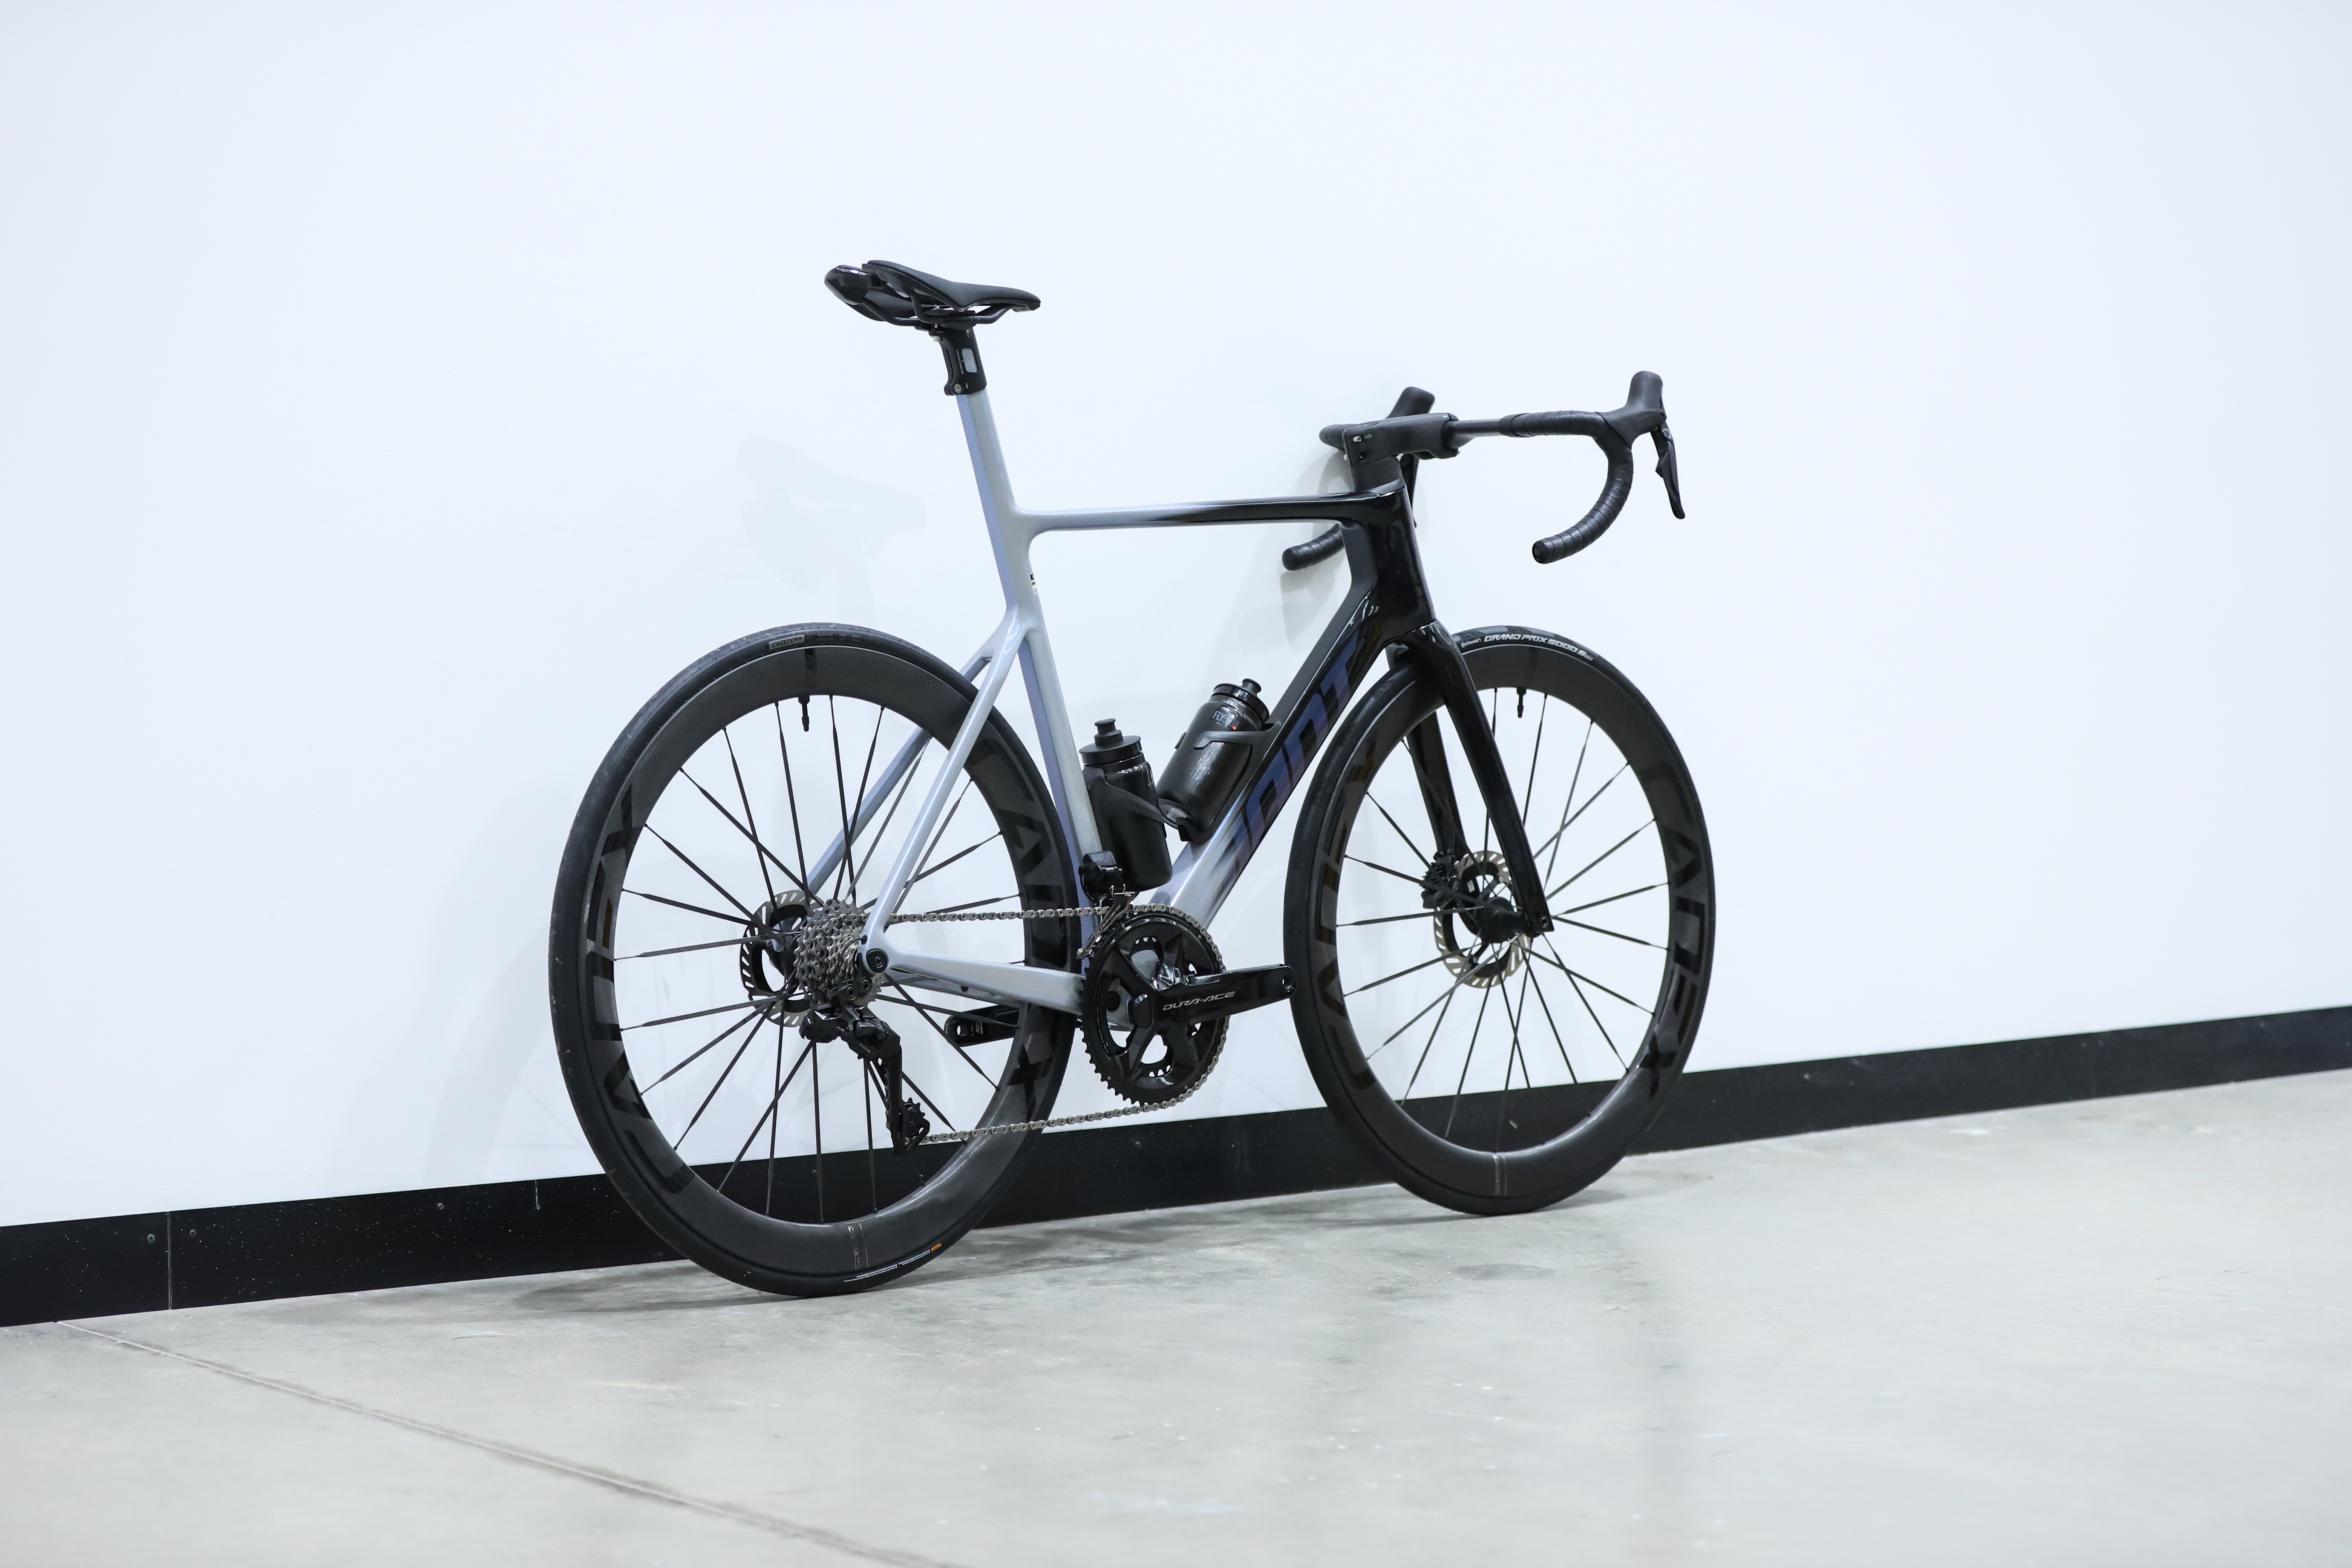
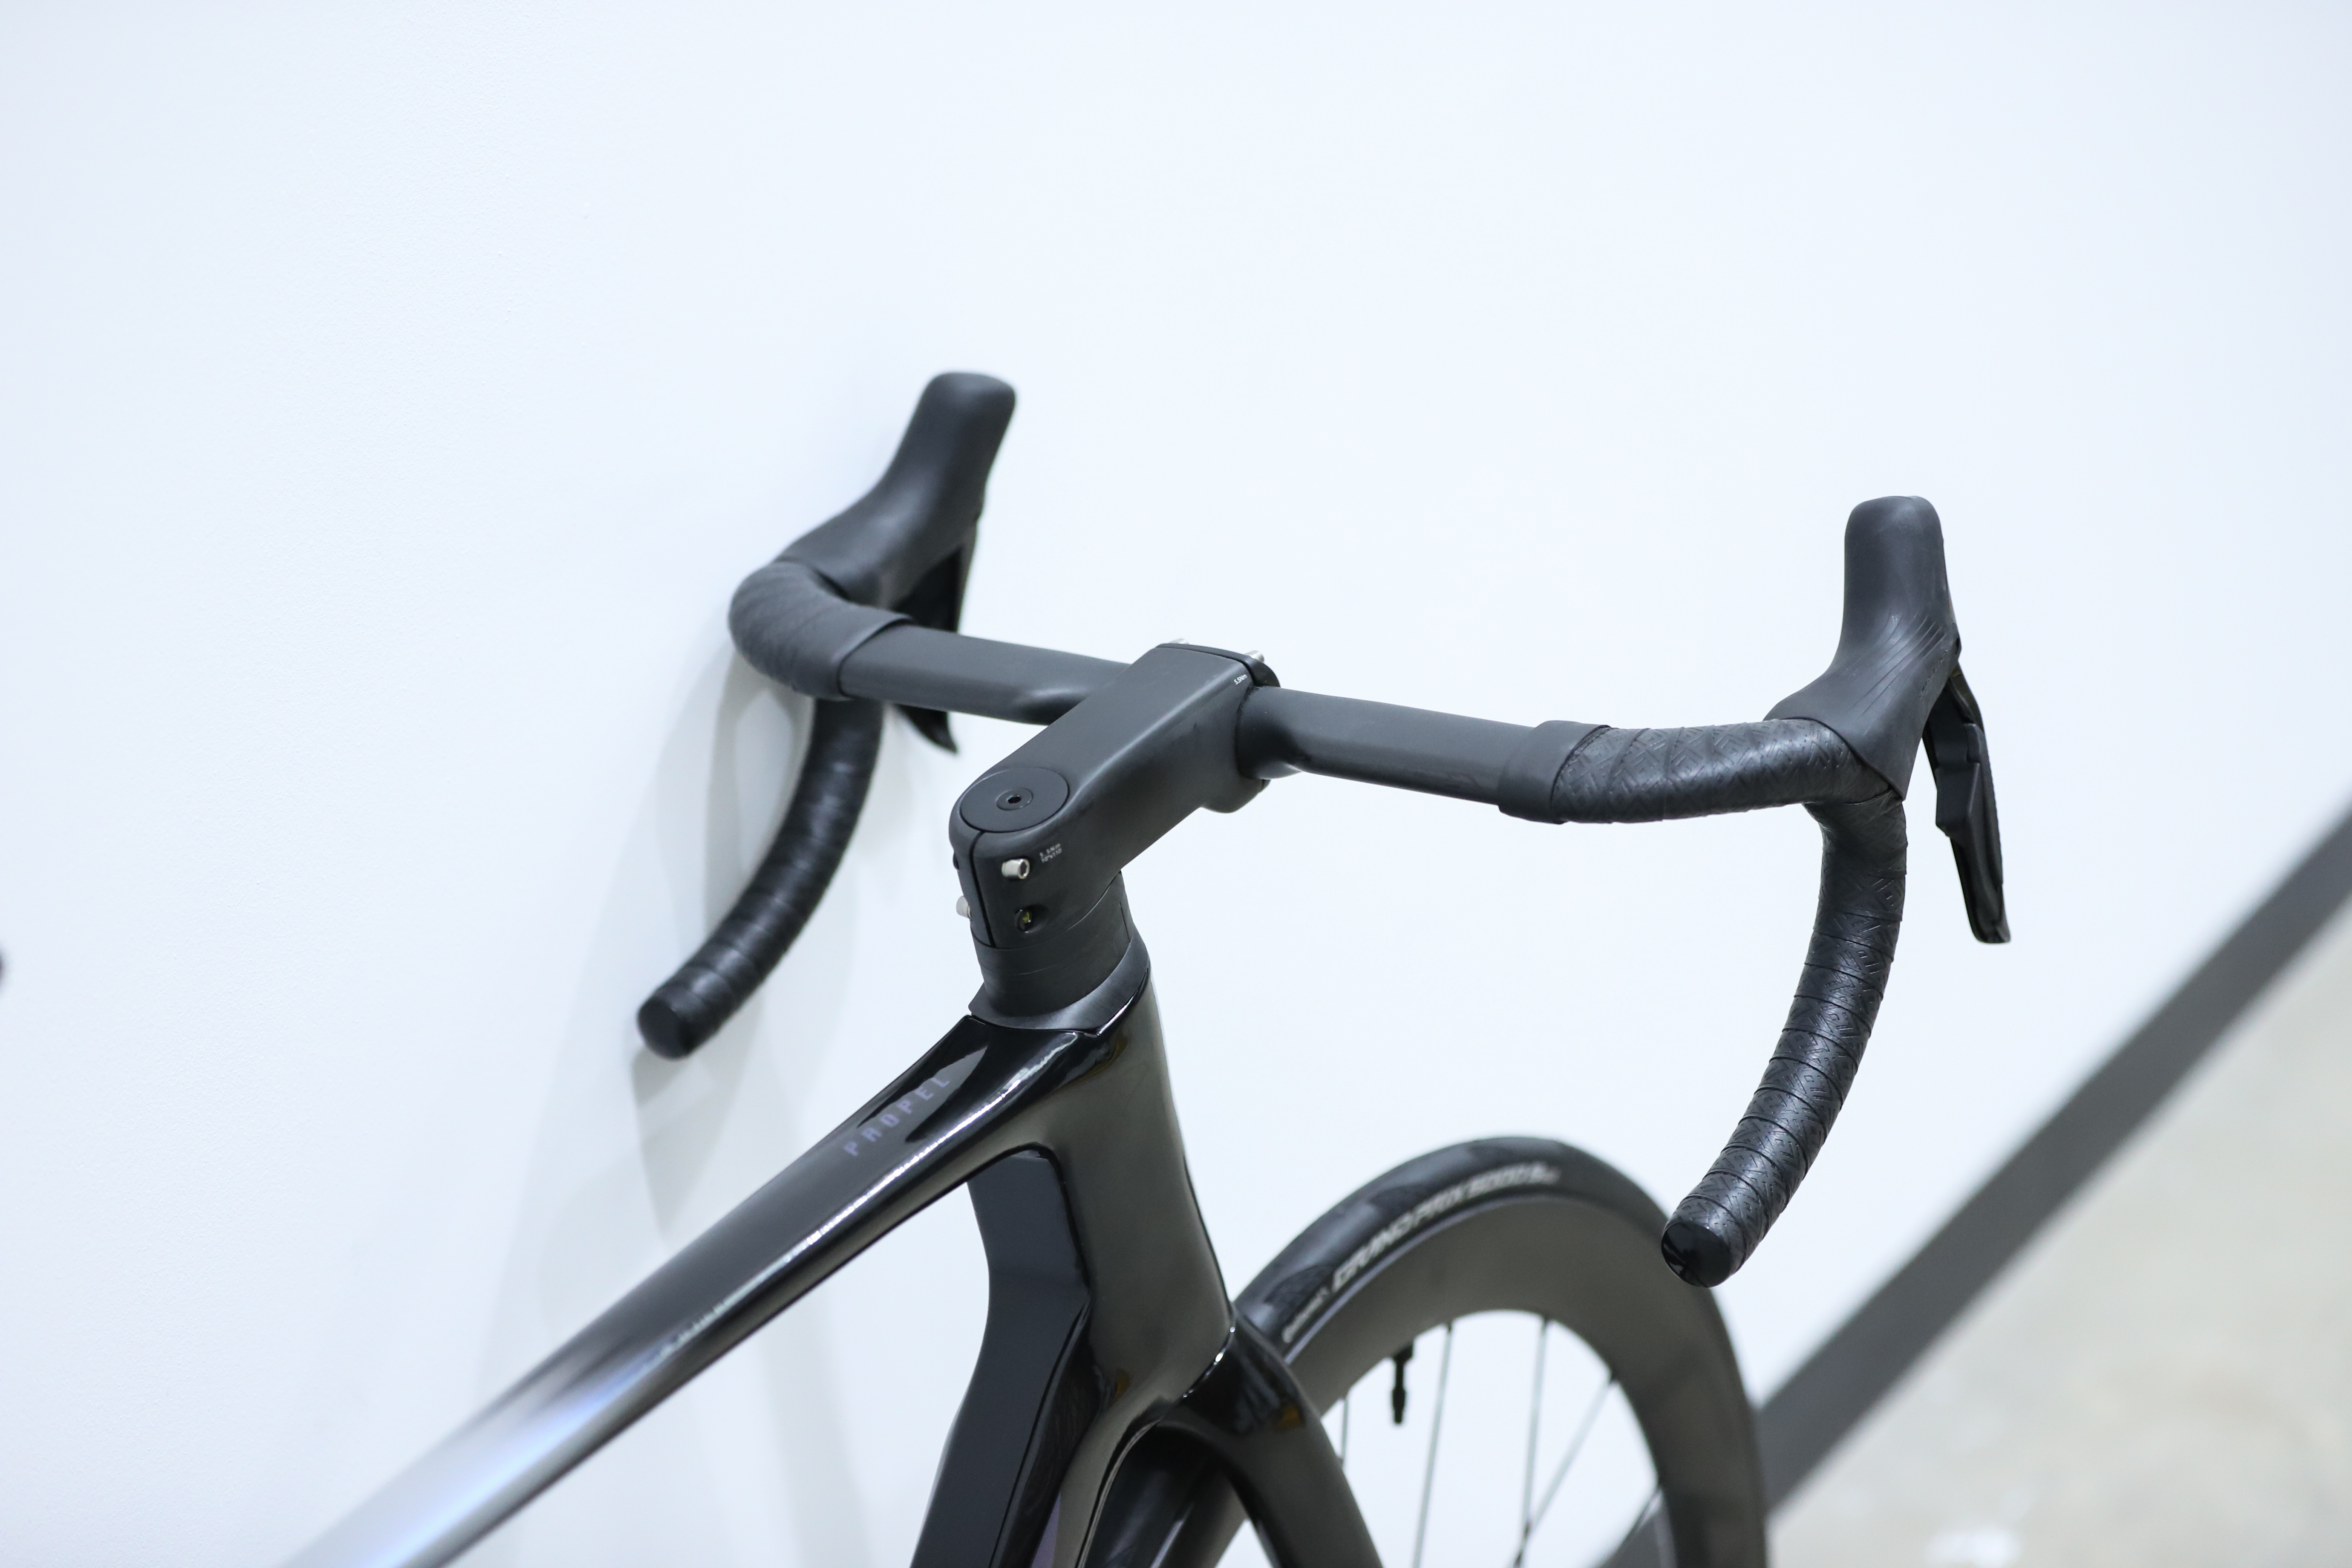
Giant Propel Advanced SL 0


Average CdA
0.3438
Watts saved at 40km/h
21.67
Time saved over 40km at 250w
00:01:33
Average CdA
0.0959
Watts saved at 40km/h
33.81
Time saved over 40km at 250w
00:05:09
By definition, the Propel is Giant's dedicated aero race bike, sitting alongside the pure featherweight TCR.
Hampered somewhat by the UCI's 6.8kg rule, the TCR was launched this year with a primary focus on better construction and improved aerodynamics, while the Propel launched last year aiming to be more of a one-bike solution, shedding weight in the process. They seem destined to merge in the coming years.
With that said, Giant designs its bikes with a pedalling mannequin, (rightly) arguing that bikes don't pedal themselves, so you should bear that in mind when reading the bike-only results shown here.
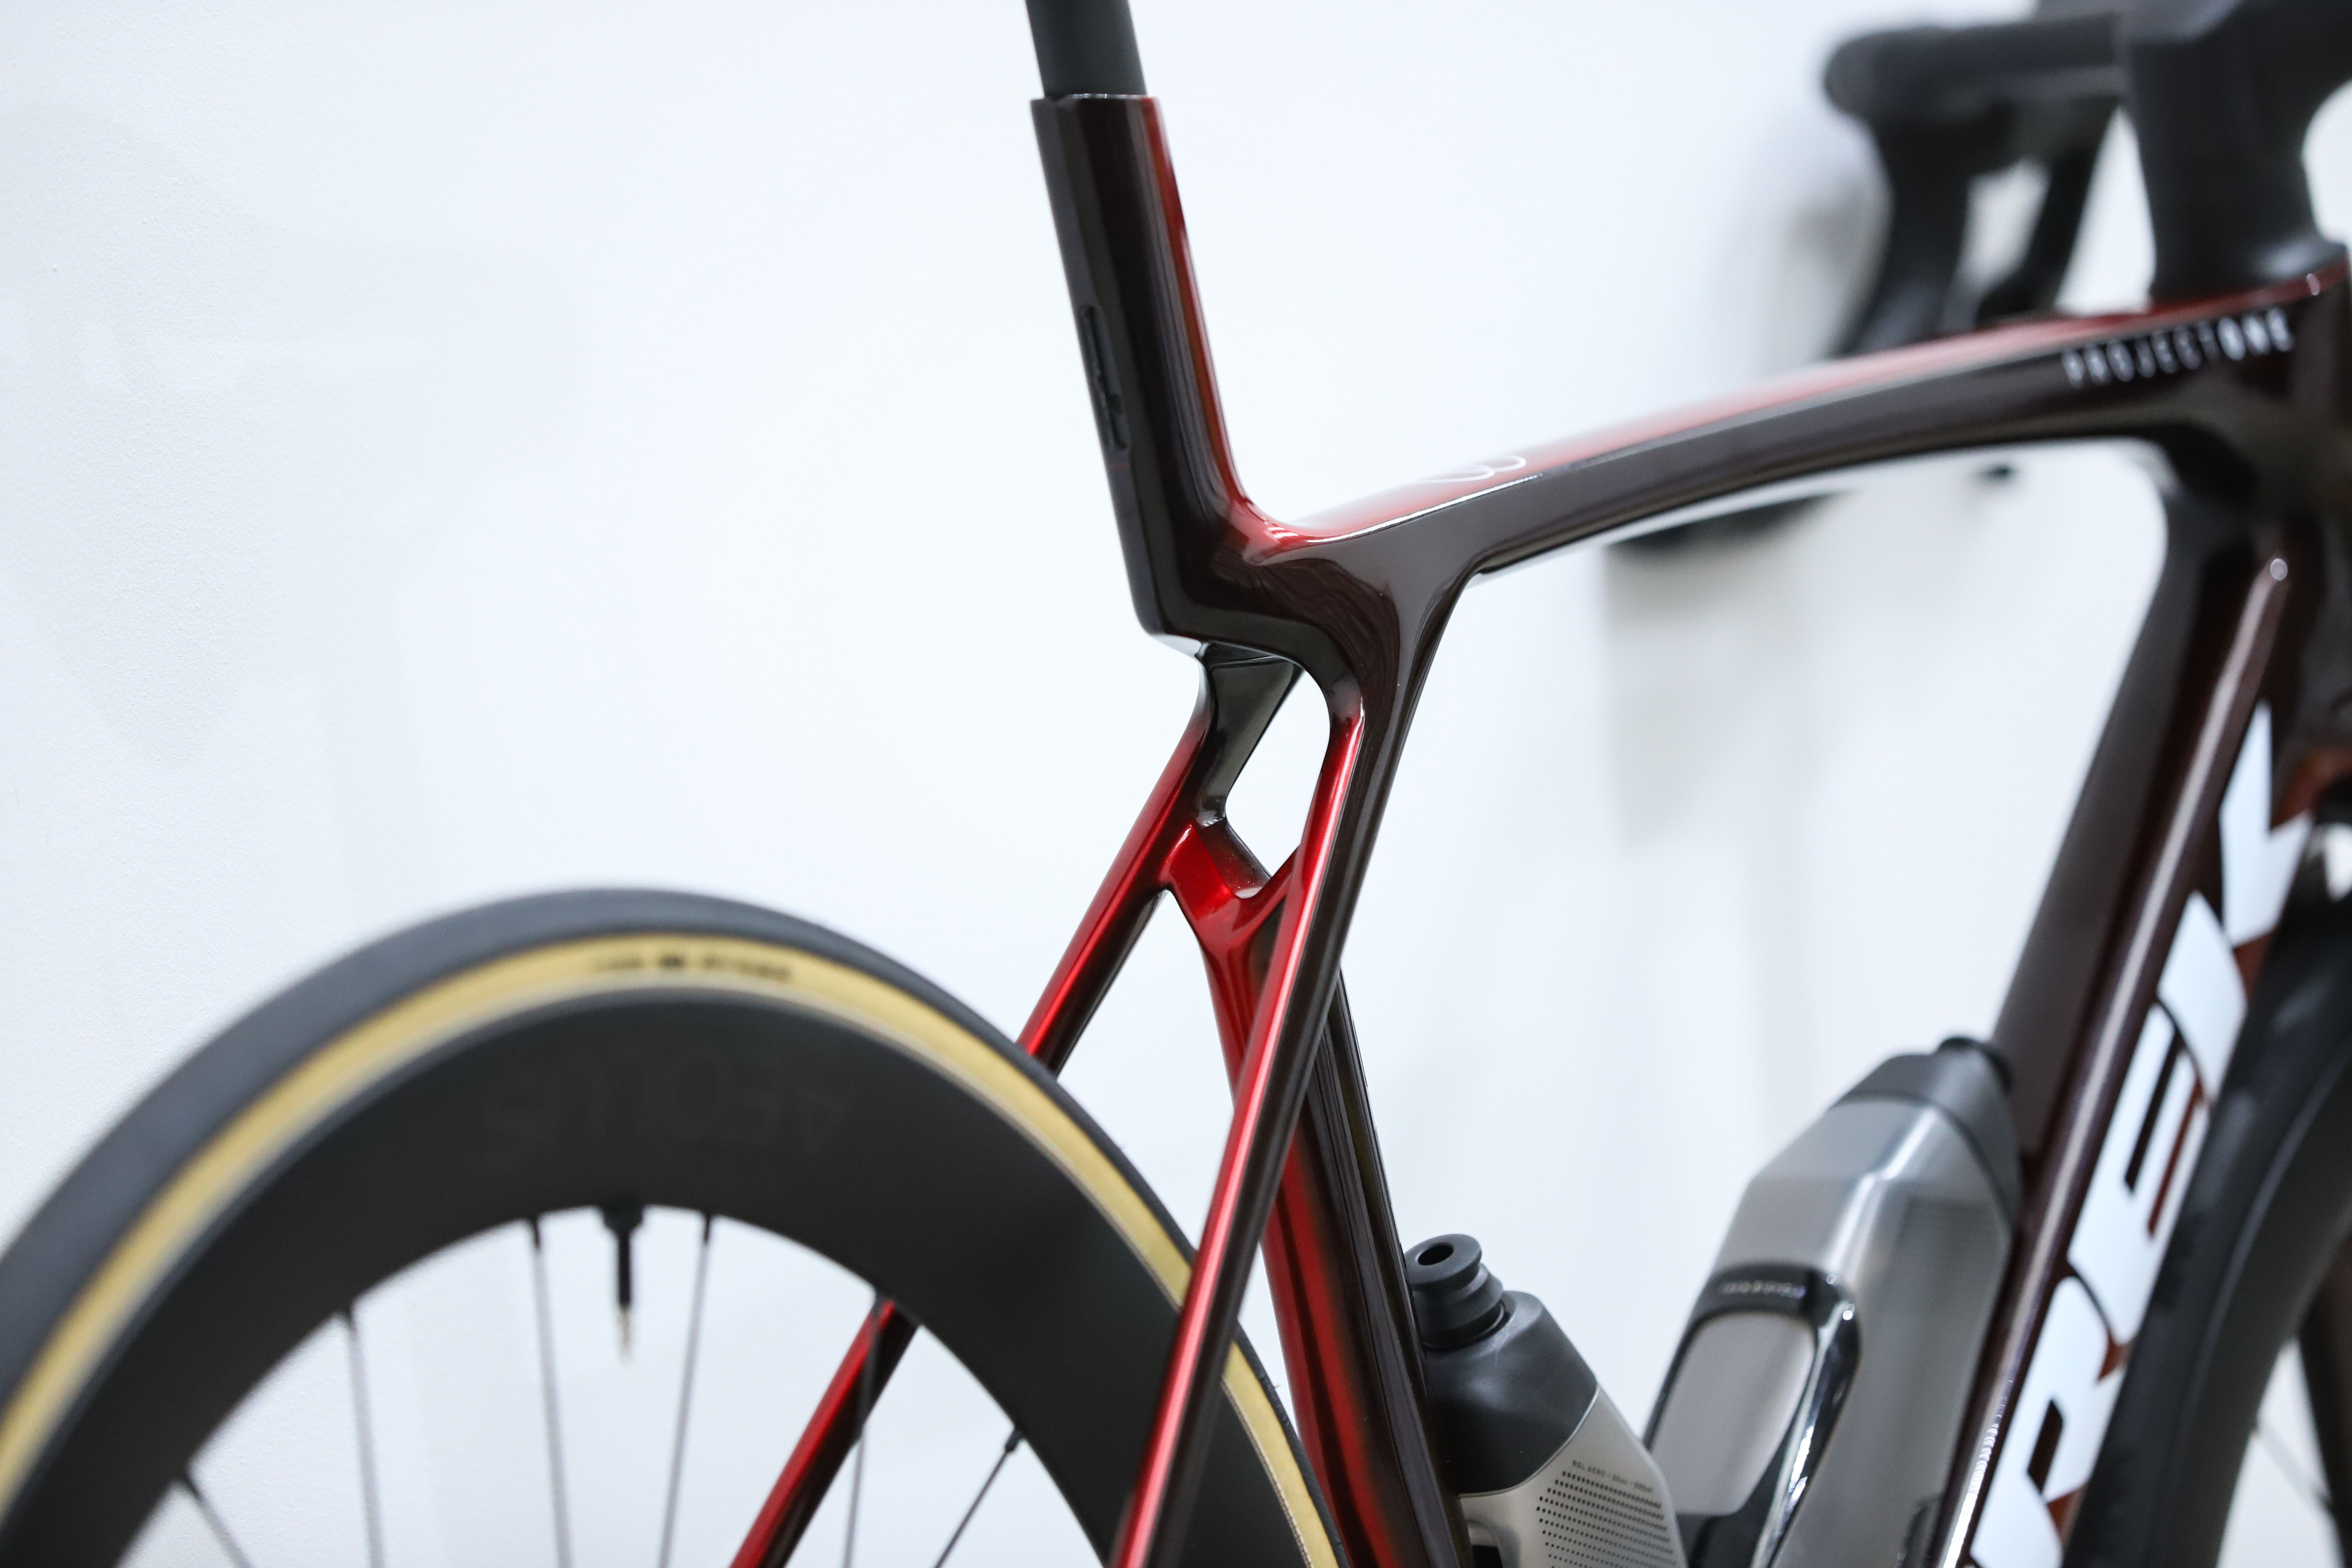
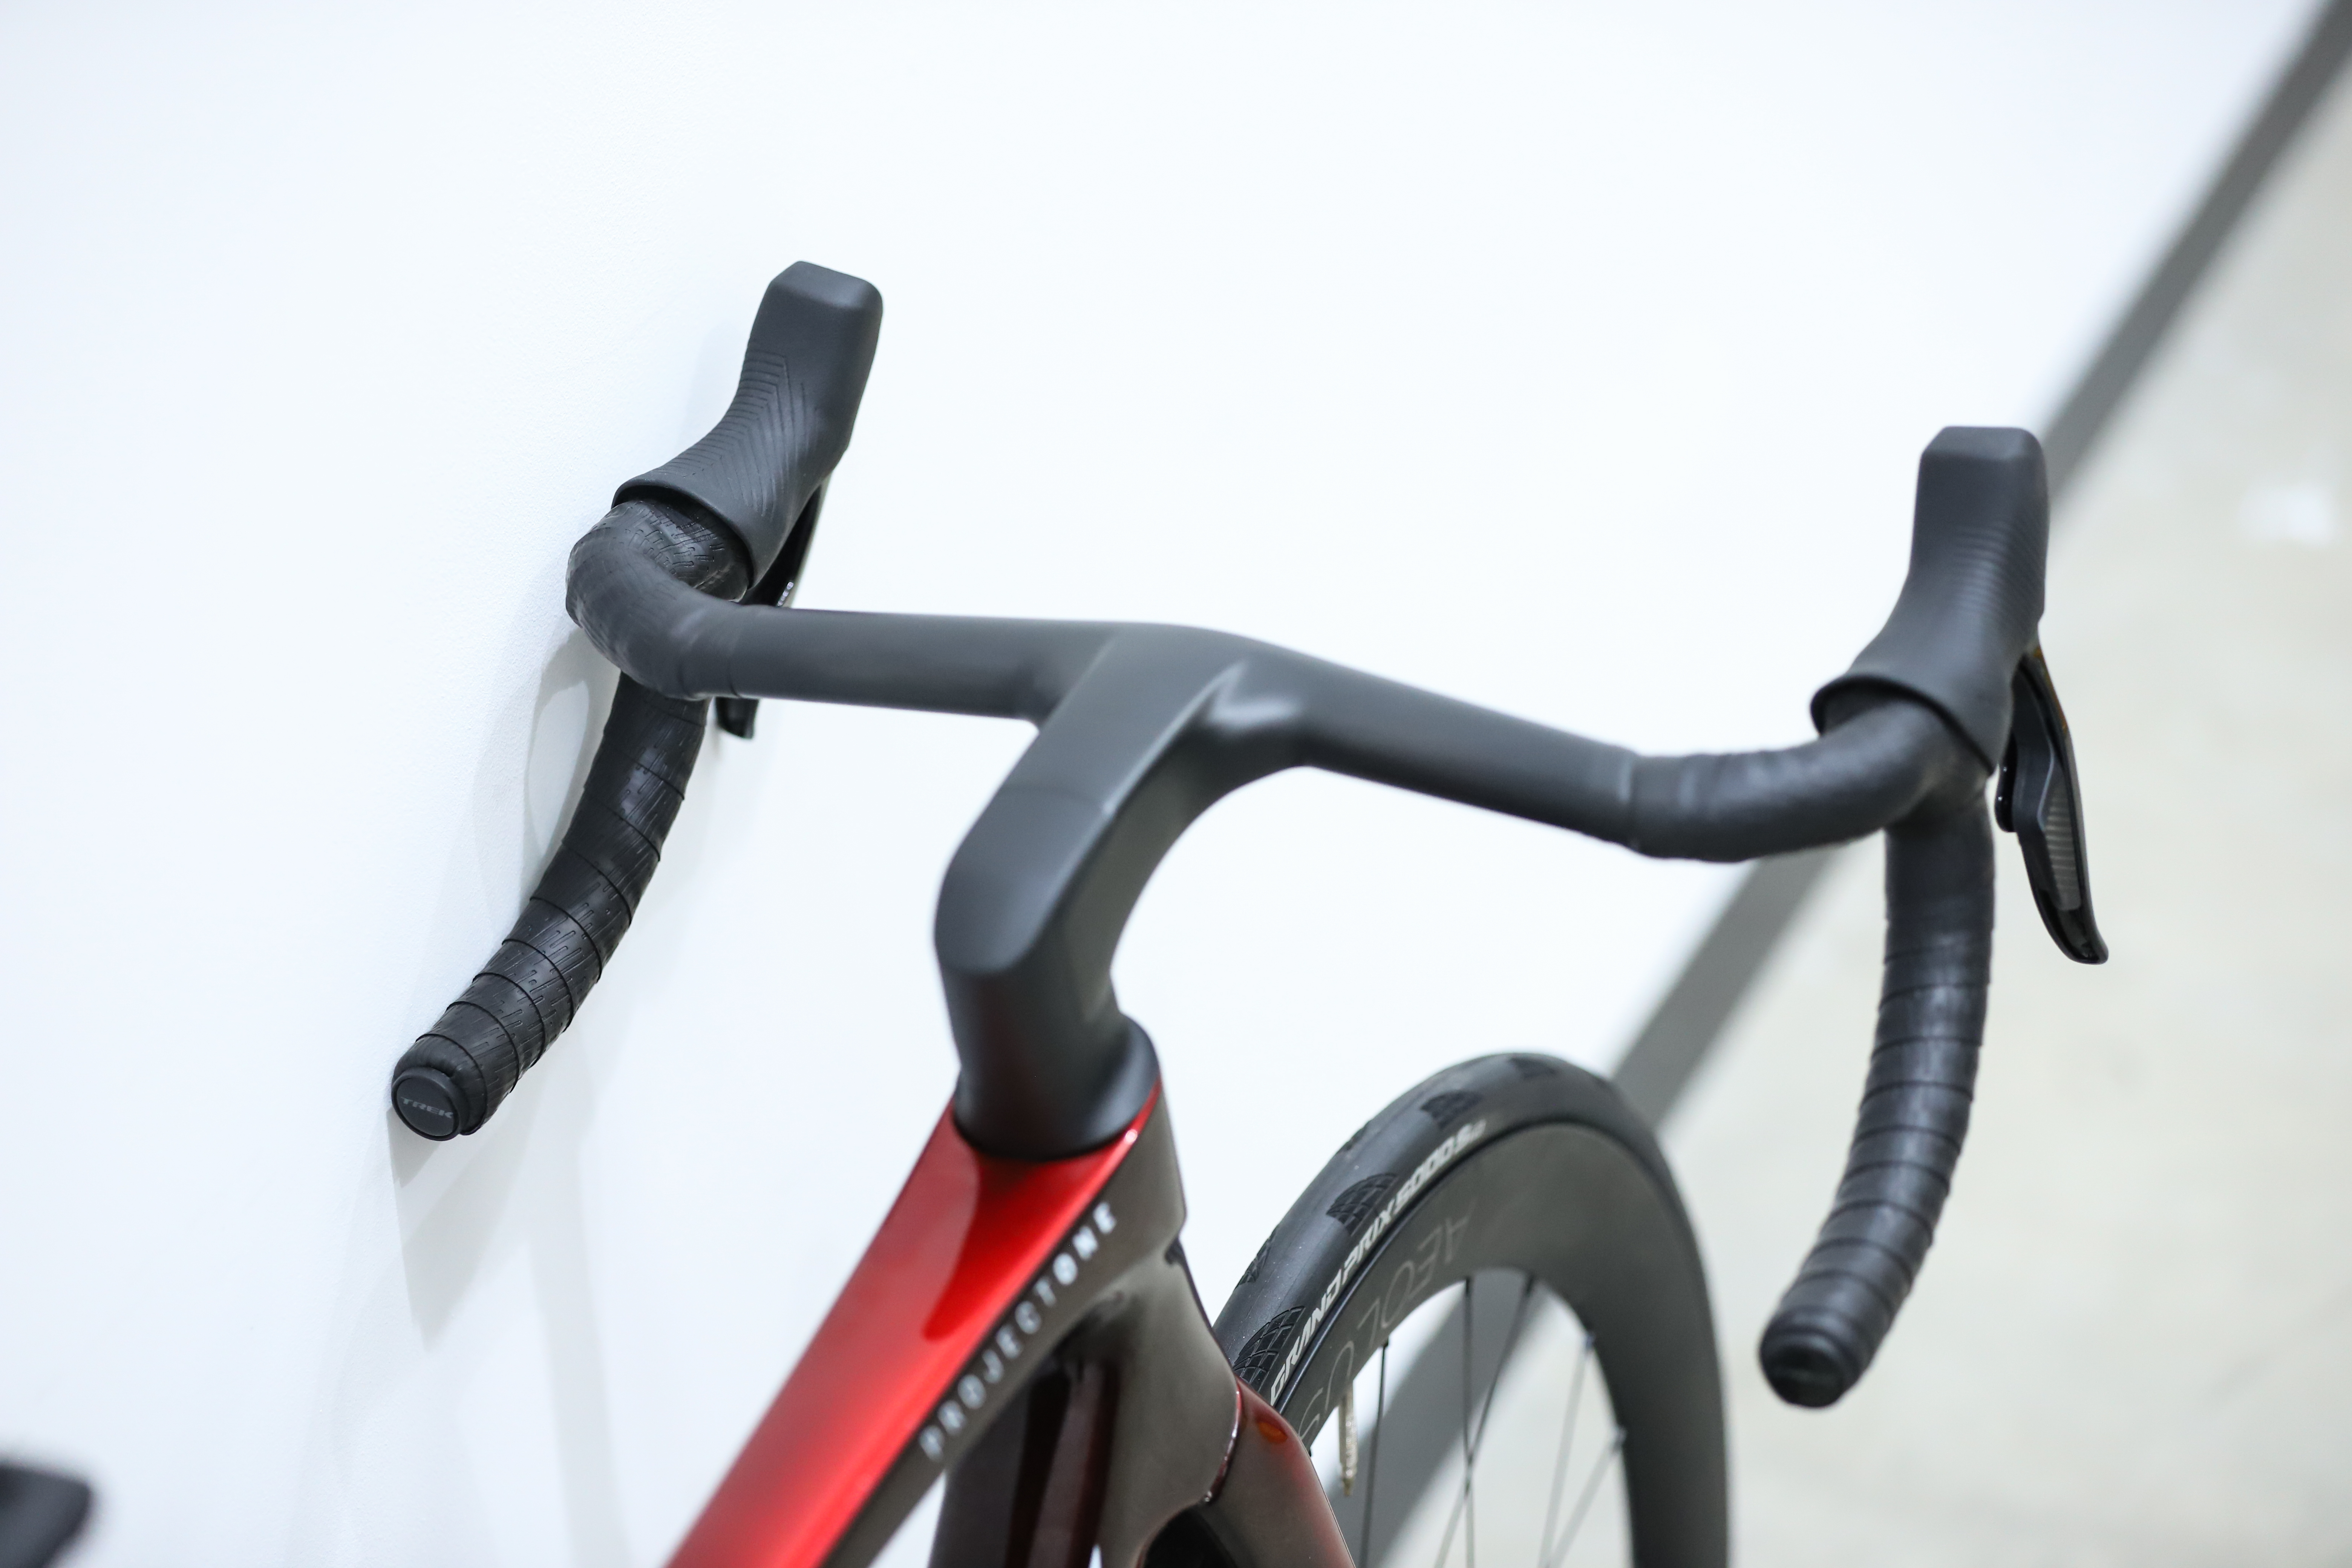
Trek Madone SLR 7 Gen 8


Average CdA
0.3406
Watts saved at 40km/h
24.31
Time saved over 40km at 250w
00:01:45
Average CdA
0.0954
Watts saved at 40km/h
34.19
Time saved over 40km at 250w
00:05:13
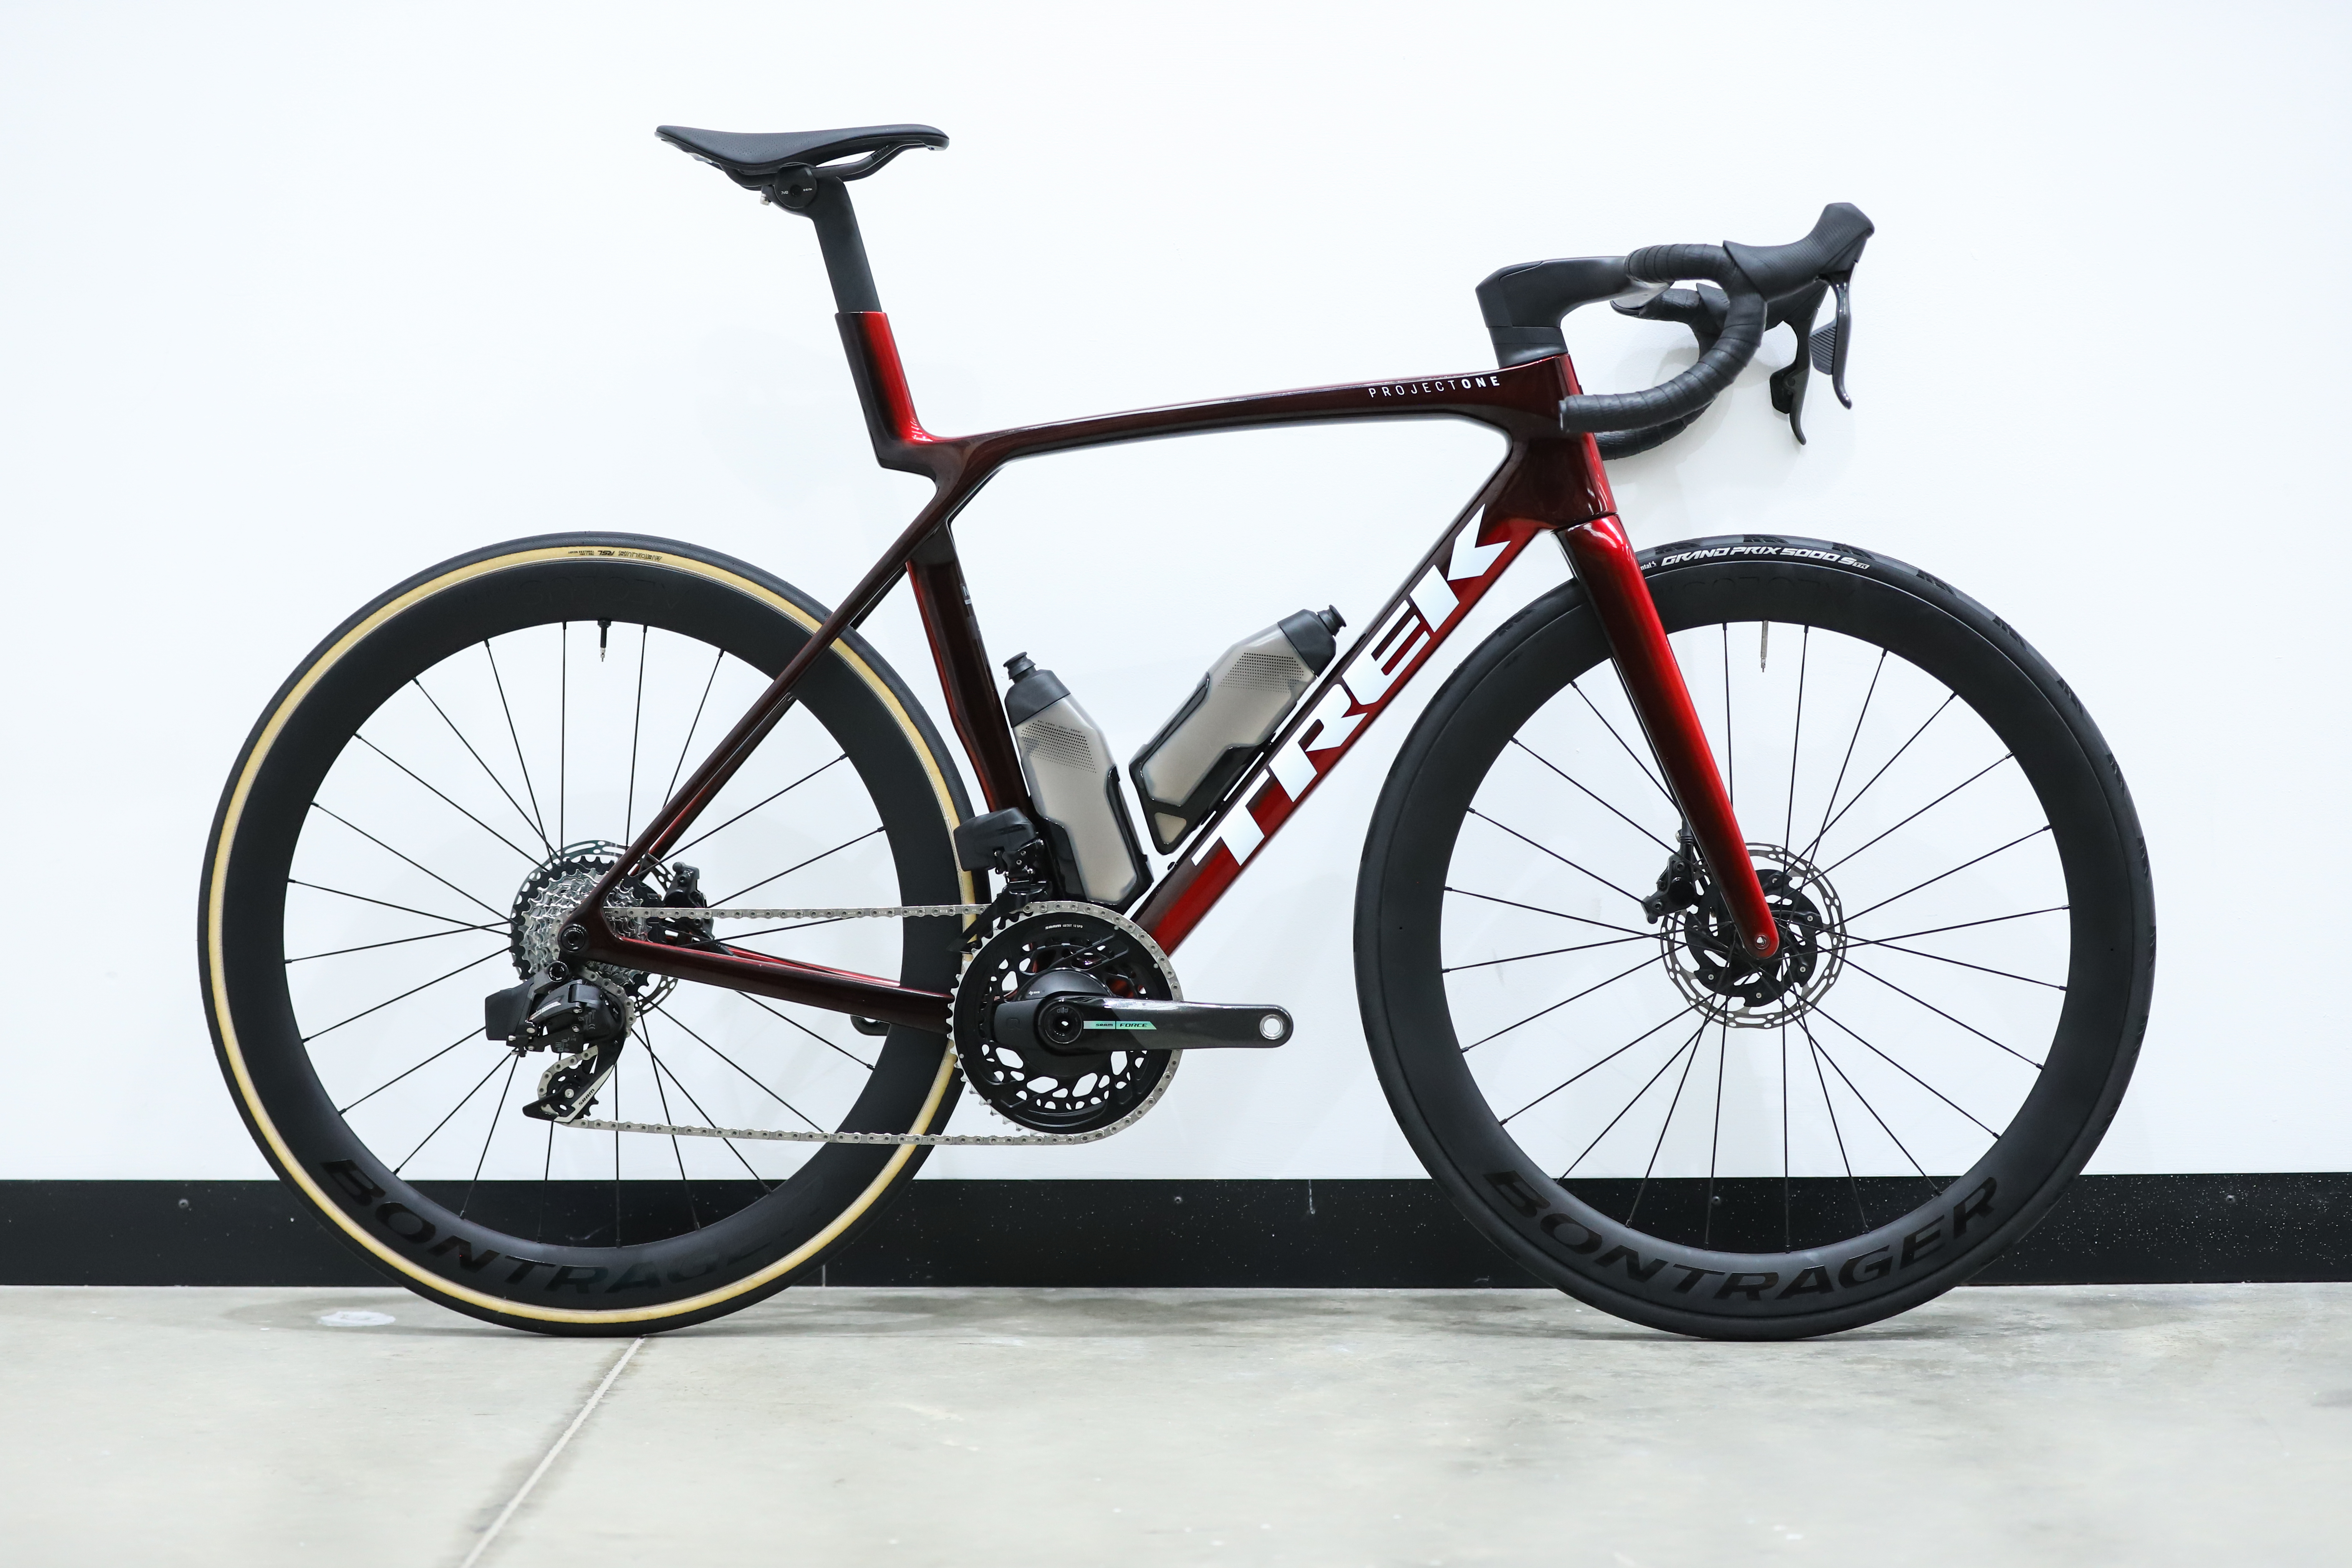
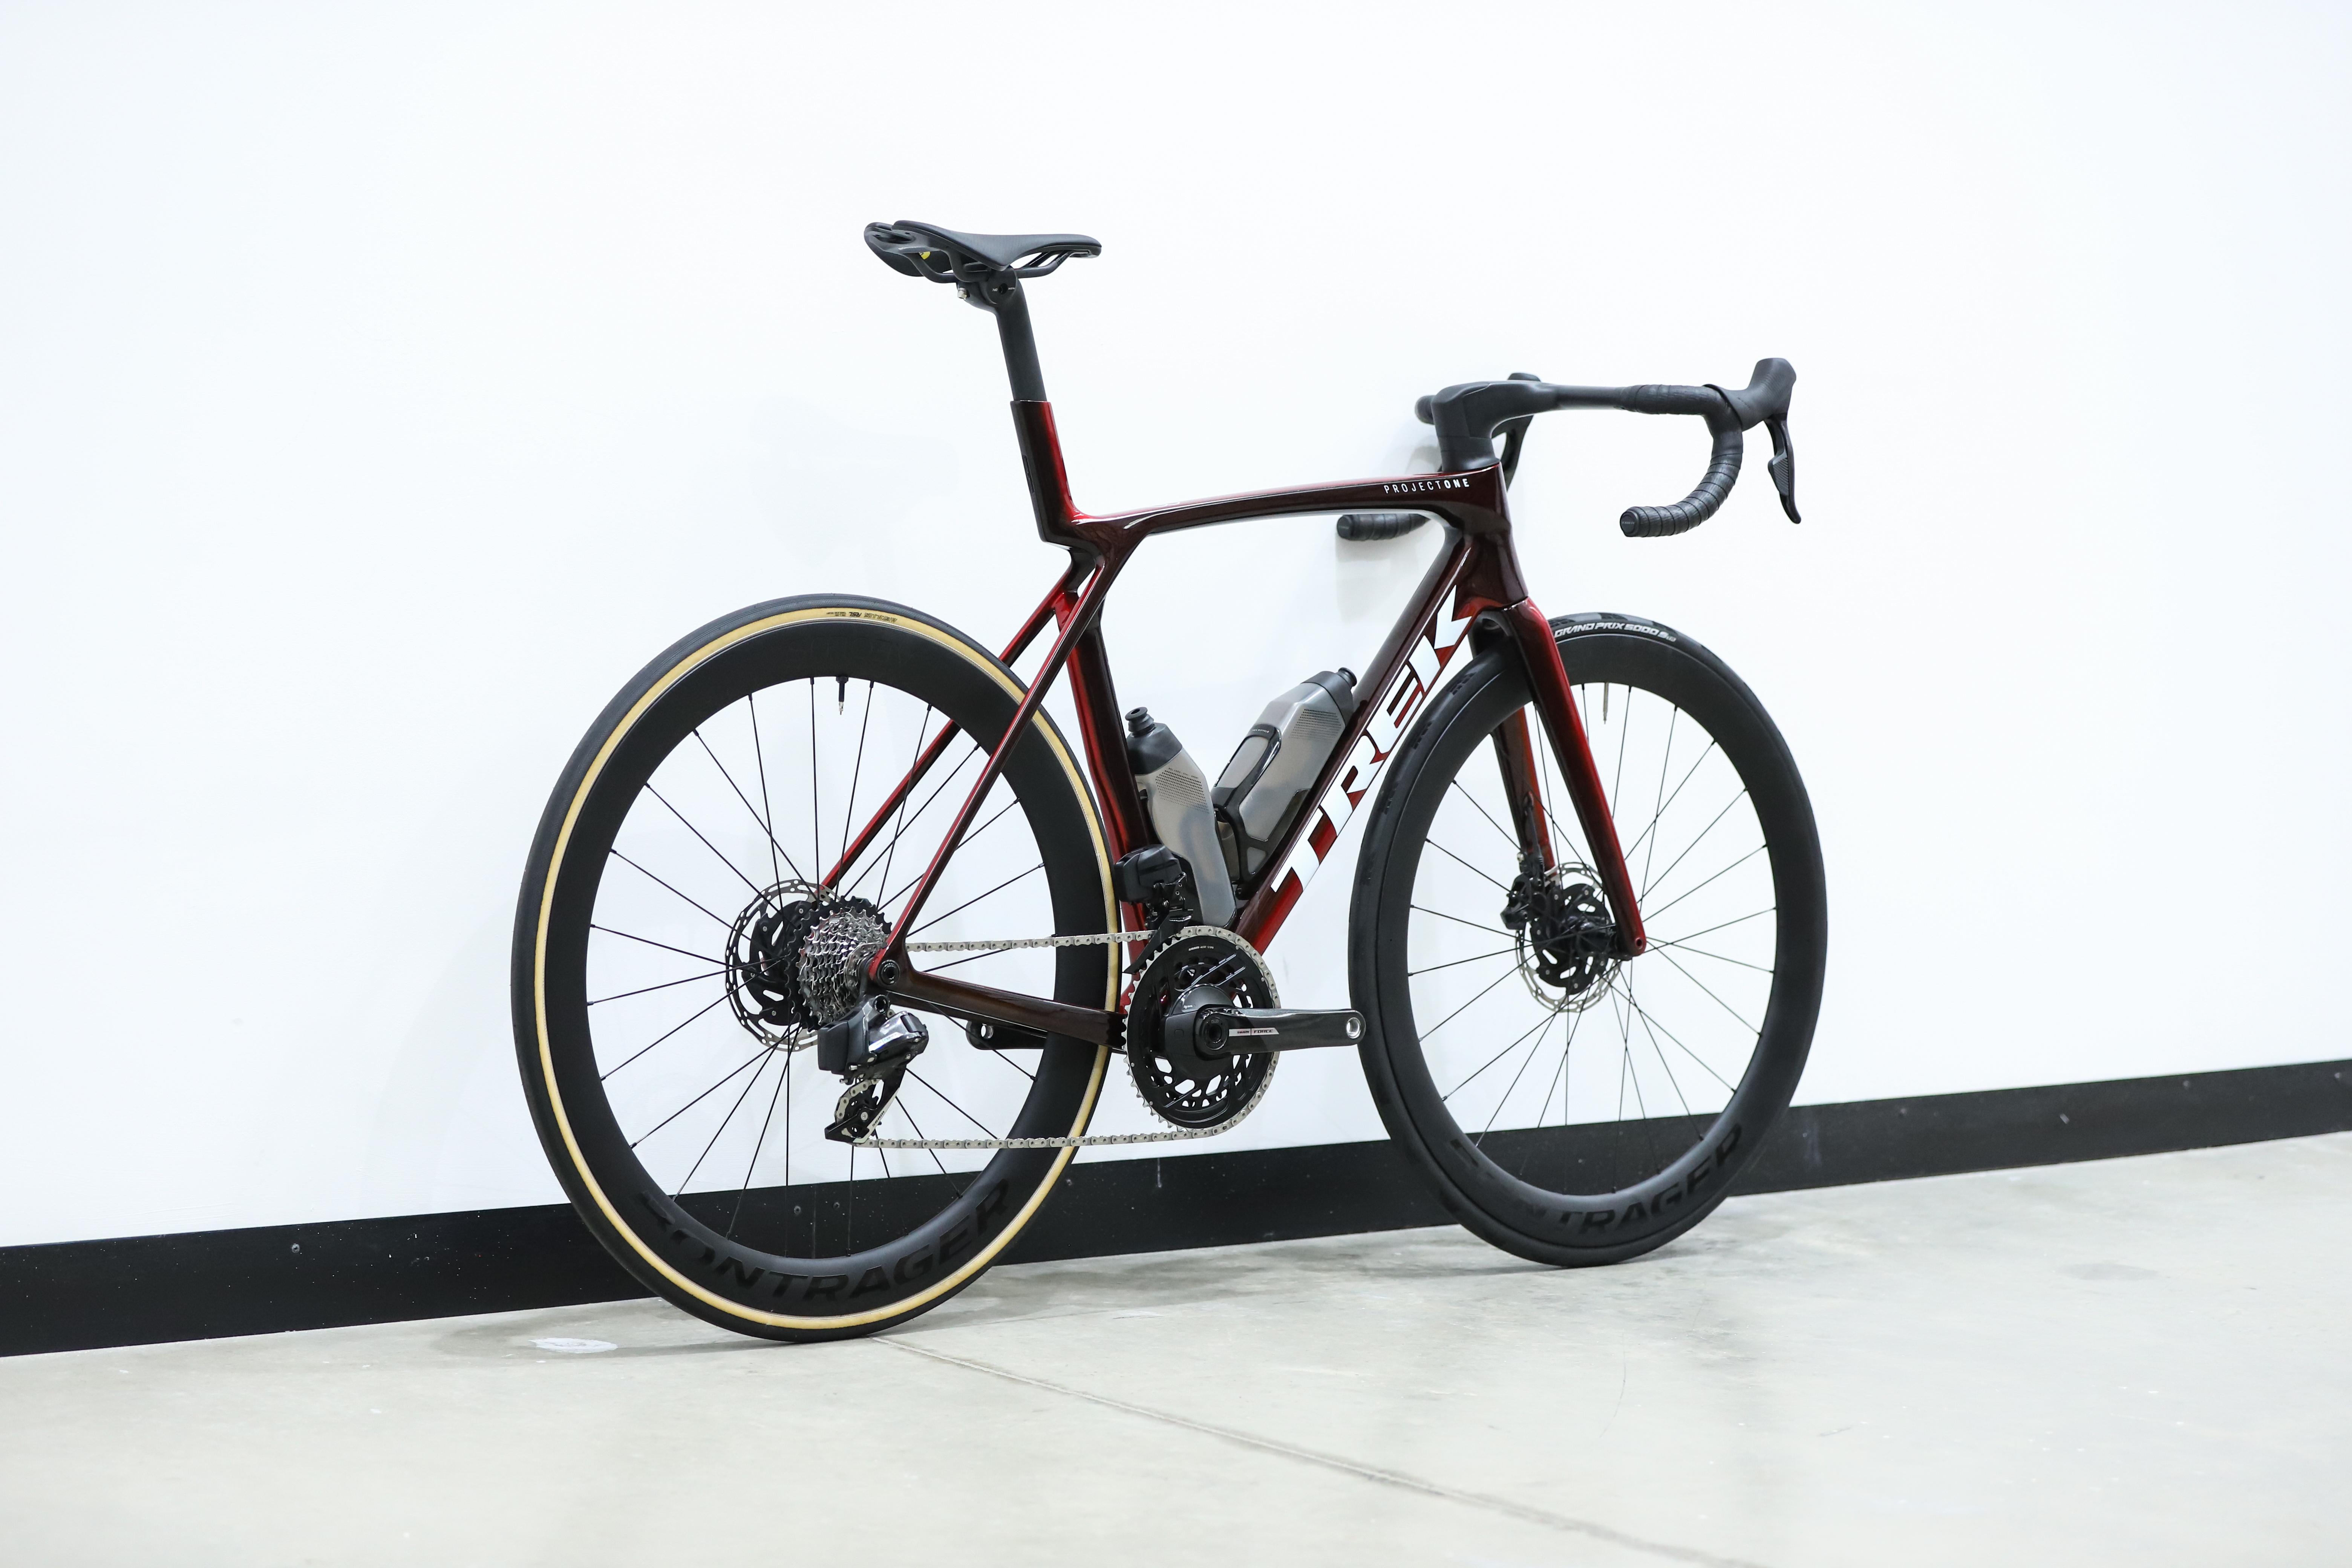
The latest Madone is the result of Trek's decision to merge its lightweight Emonda and aero Madone models into one bike, and although it uses slimmed down tubes, Trek says it actually outperforms the outgoing aero-first Madone in the wind tunnel.
Trek admits that this is thanks in large part to the aero bottle cages, but we can't dispute the argument that if you have them, you'll use them. That's why we ran them for this test.
Like the Propel above, the Madone is another that fared better with a rider on than without.
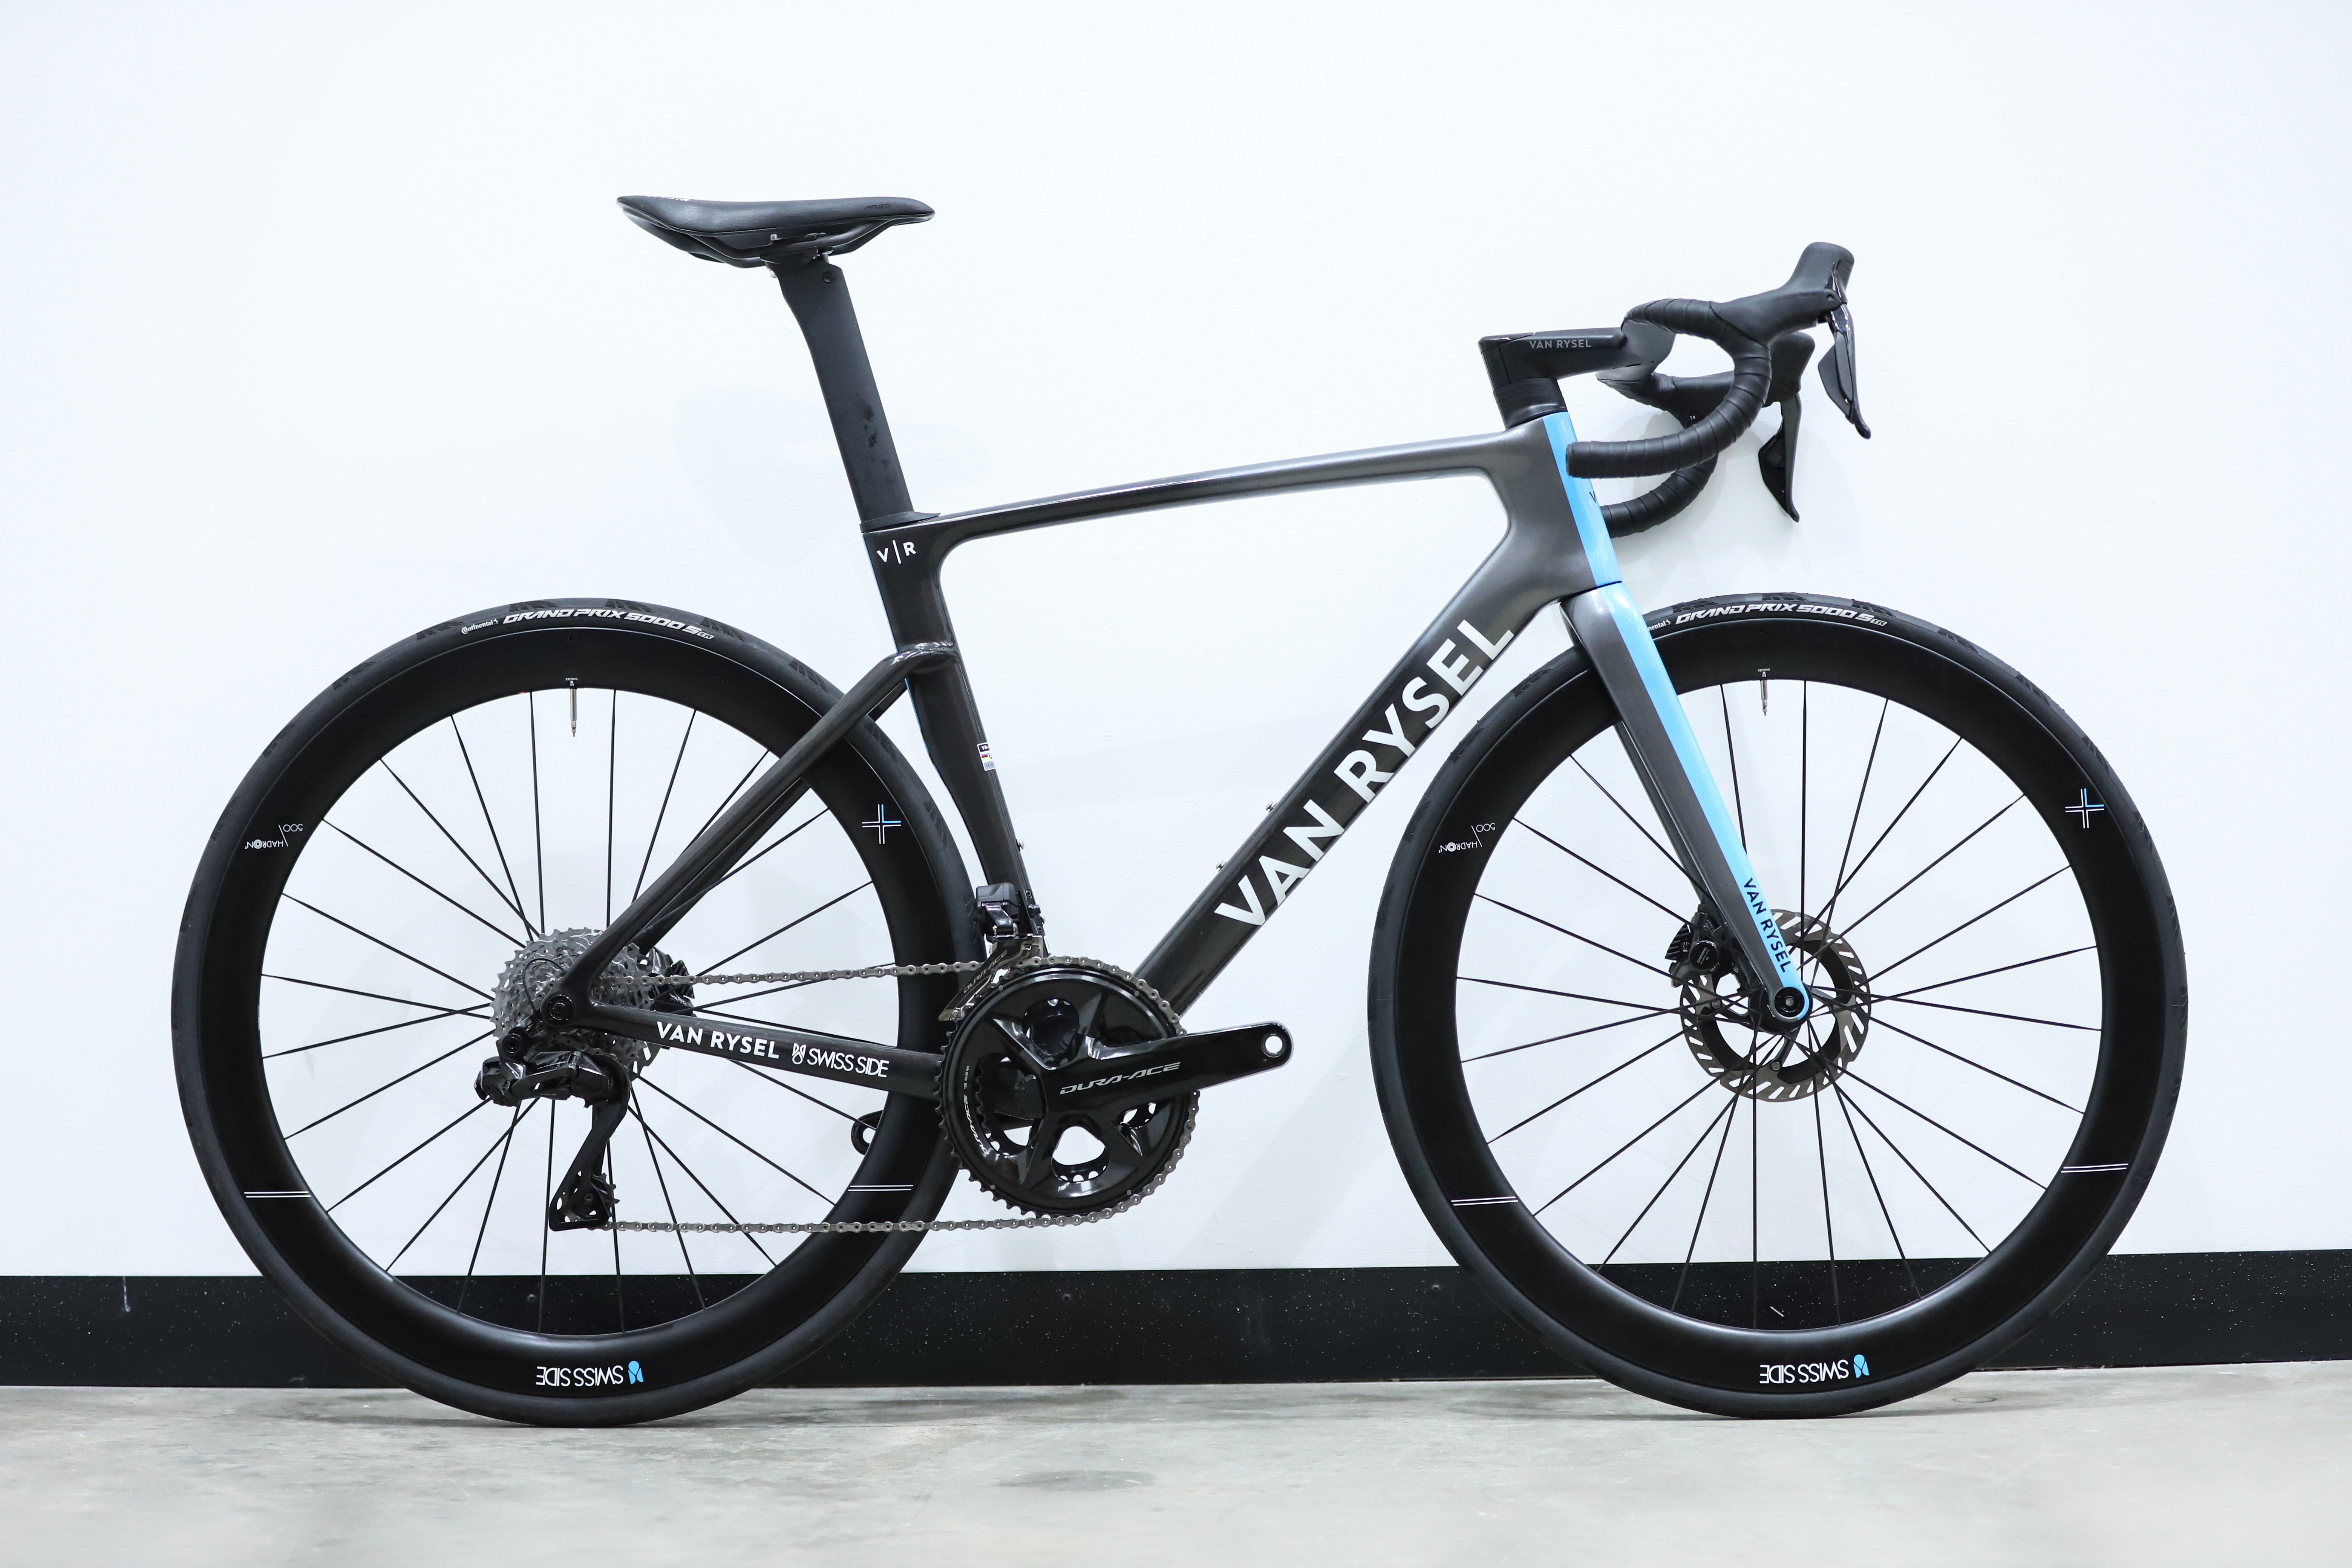
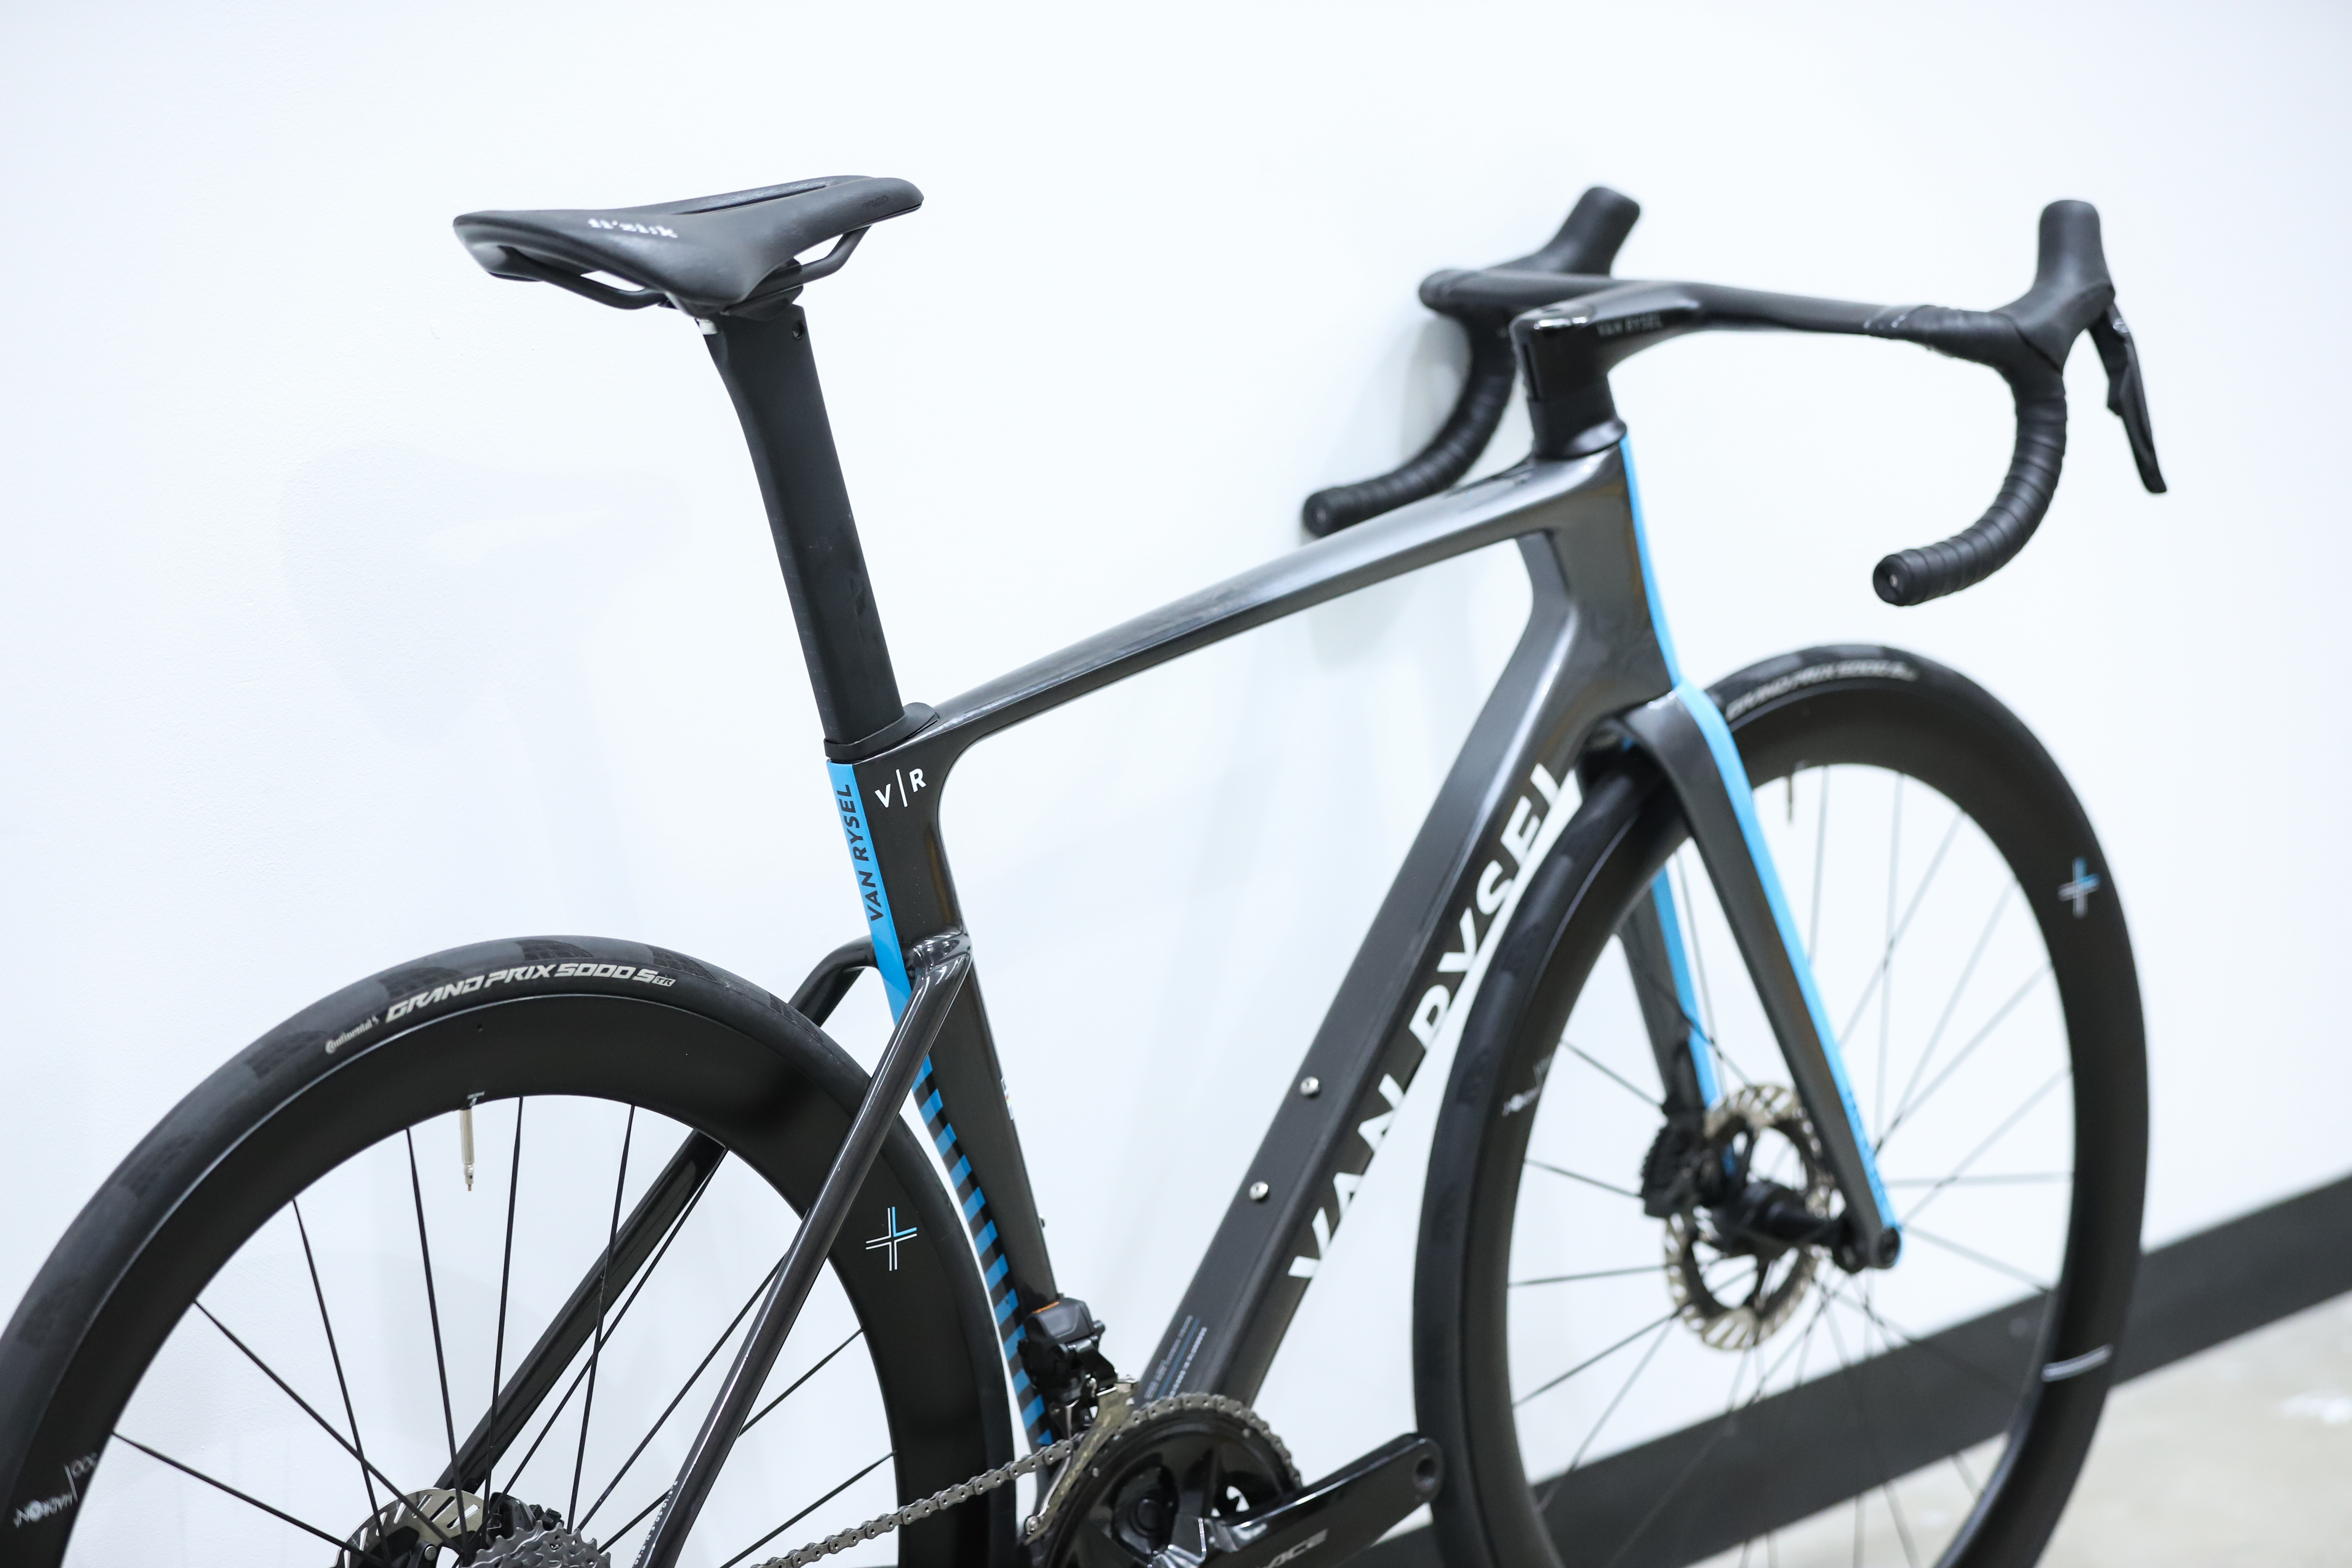
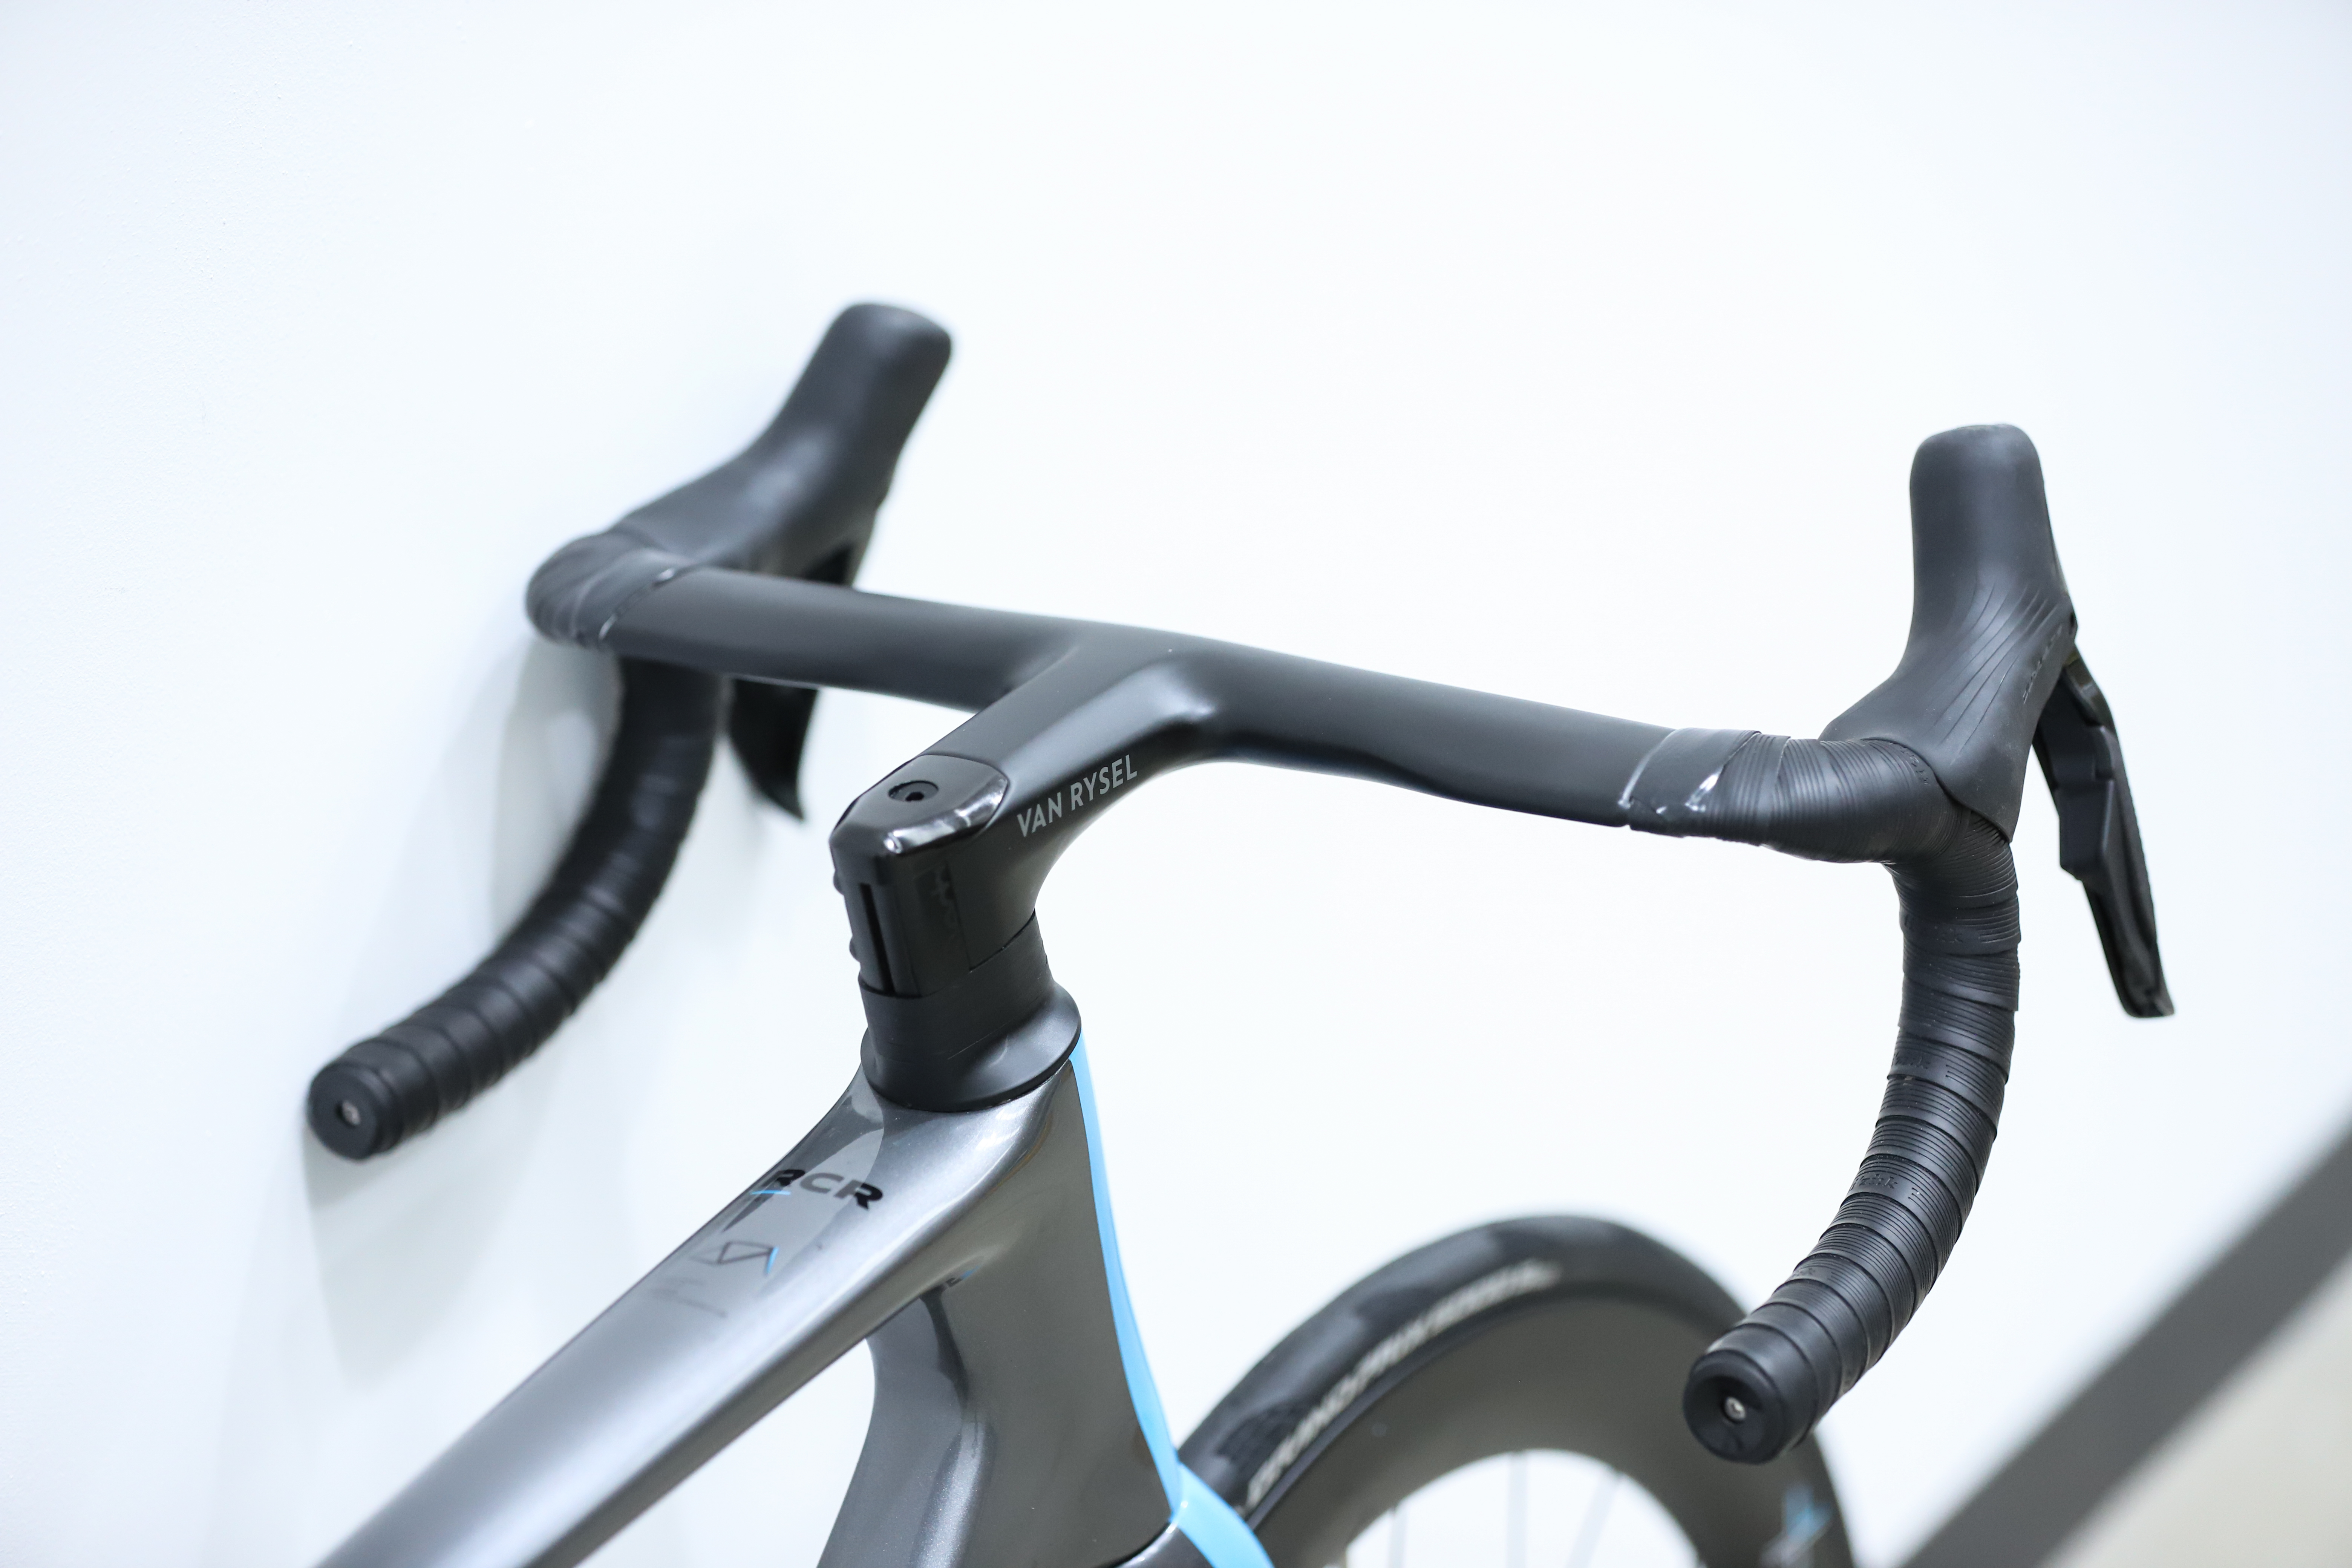
Van Rysel RCR Pro


Average CdA
0.3438
Watts saved at 40km/h
21.69
Time saved over 40km at 250w
00:01:33
Average CdA
0.0936
Watts saved at 40km/h
35.70
Time saved over 40km at 250w
00:05:29
First up, I must apologise for claiming that a £9000 bike is anywhere near a budget-friendly. I appreciate that's still an inordinate amount of money for a bicycle, but as a brand, Van Rysel is building its reputation on price.
The brand was sprung into the spotlight when its parent company, Decathlon, became the title sponsor of French WorldTour team, Decathlon AG2R La Mondiale.
And compared to the competitors here, it is the value option. With a top-tier Dura-Ace groupset, the Van Rysel is £299 cheaper than the next-cheapest equivalent-spec bike, the Aeroad CFR from direct-to-consumer brand Canyon.
The Trek Madone does actually come in cheaper, but the bike we managed to source was the Force AXS equipped, rather than the top-tier Red AXS.
Despite that price difference, it's well within the aero and weight ballpark. It is in the bottom half of a tightly-packed aero table, and weighs just 7.54kg.
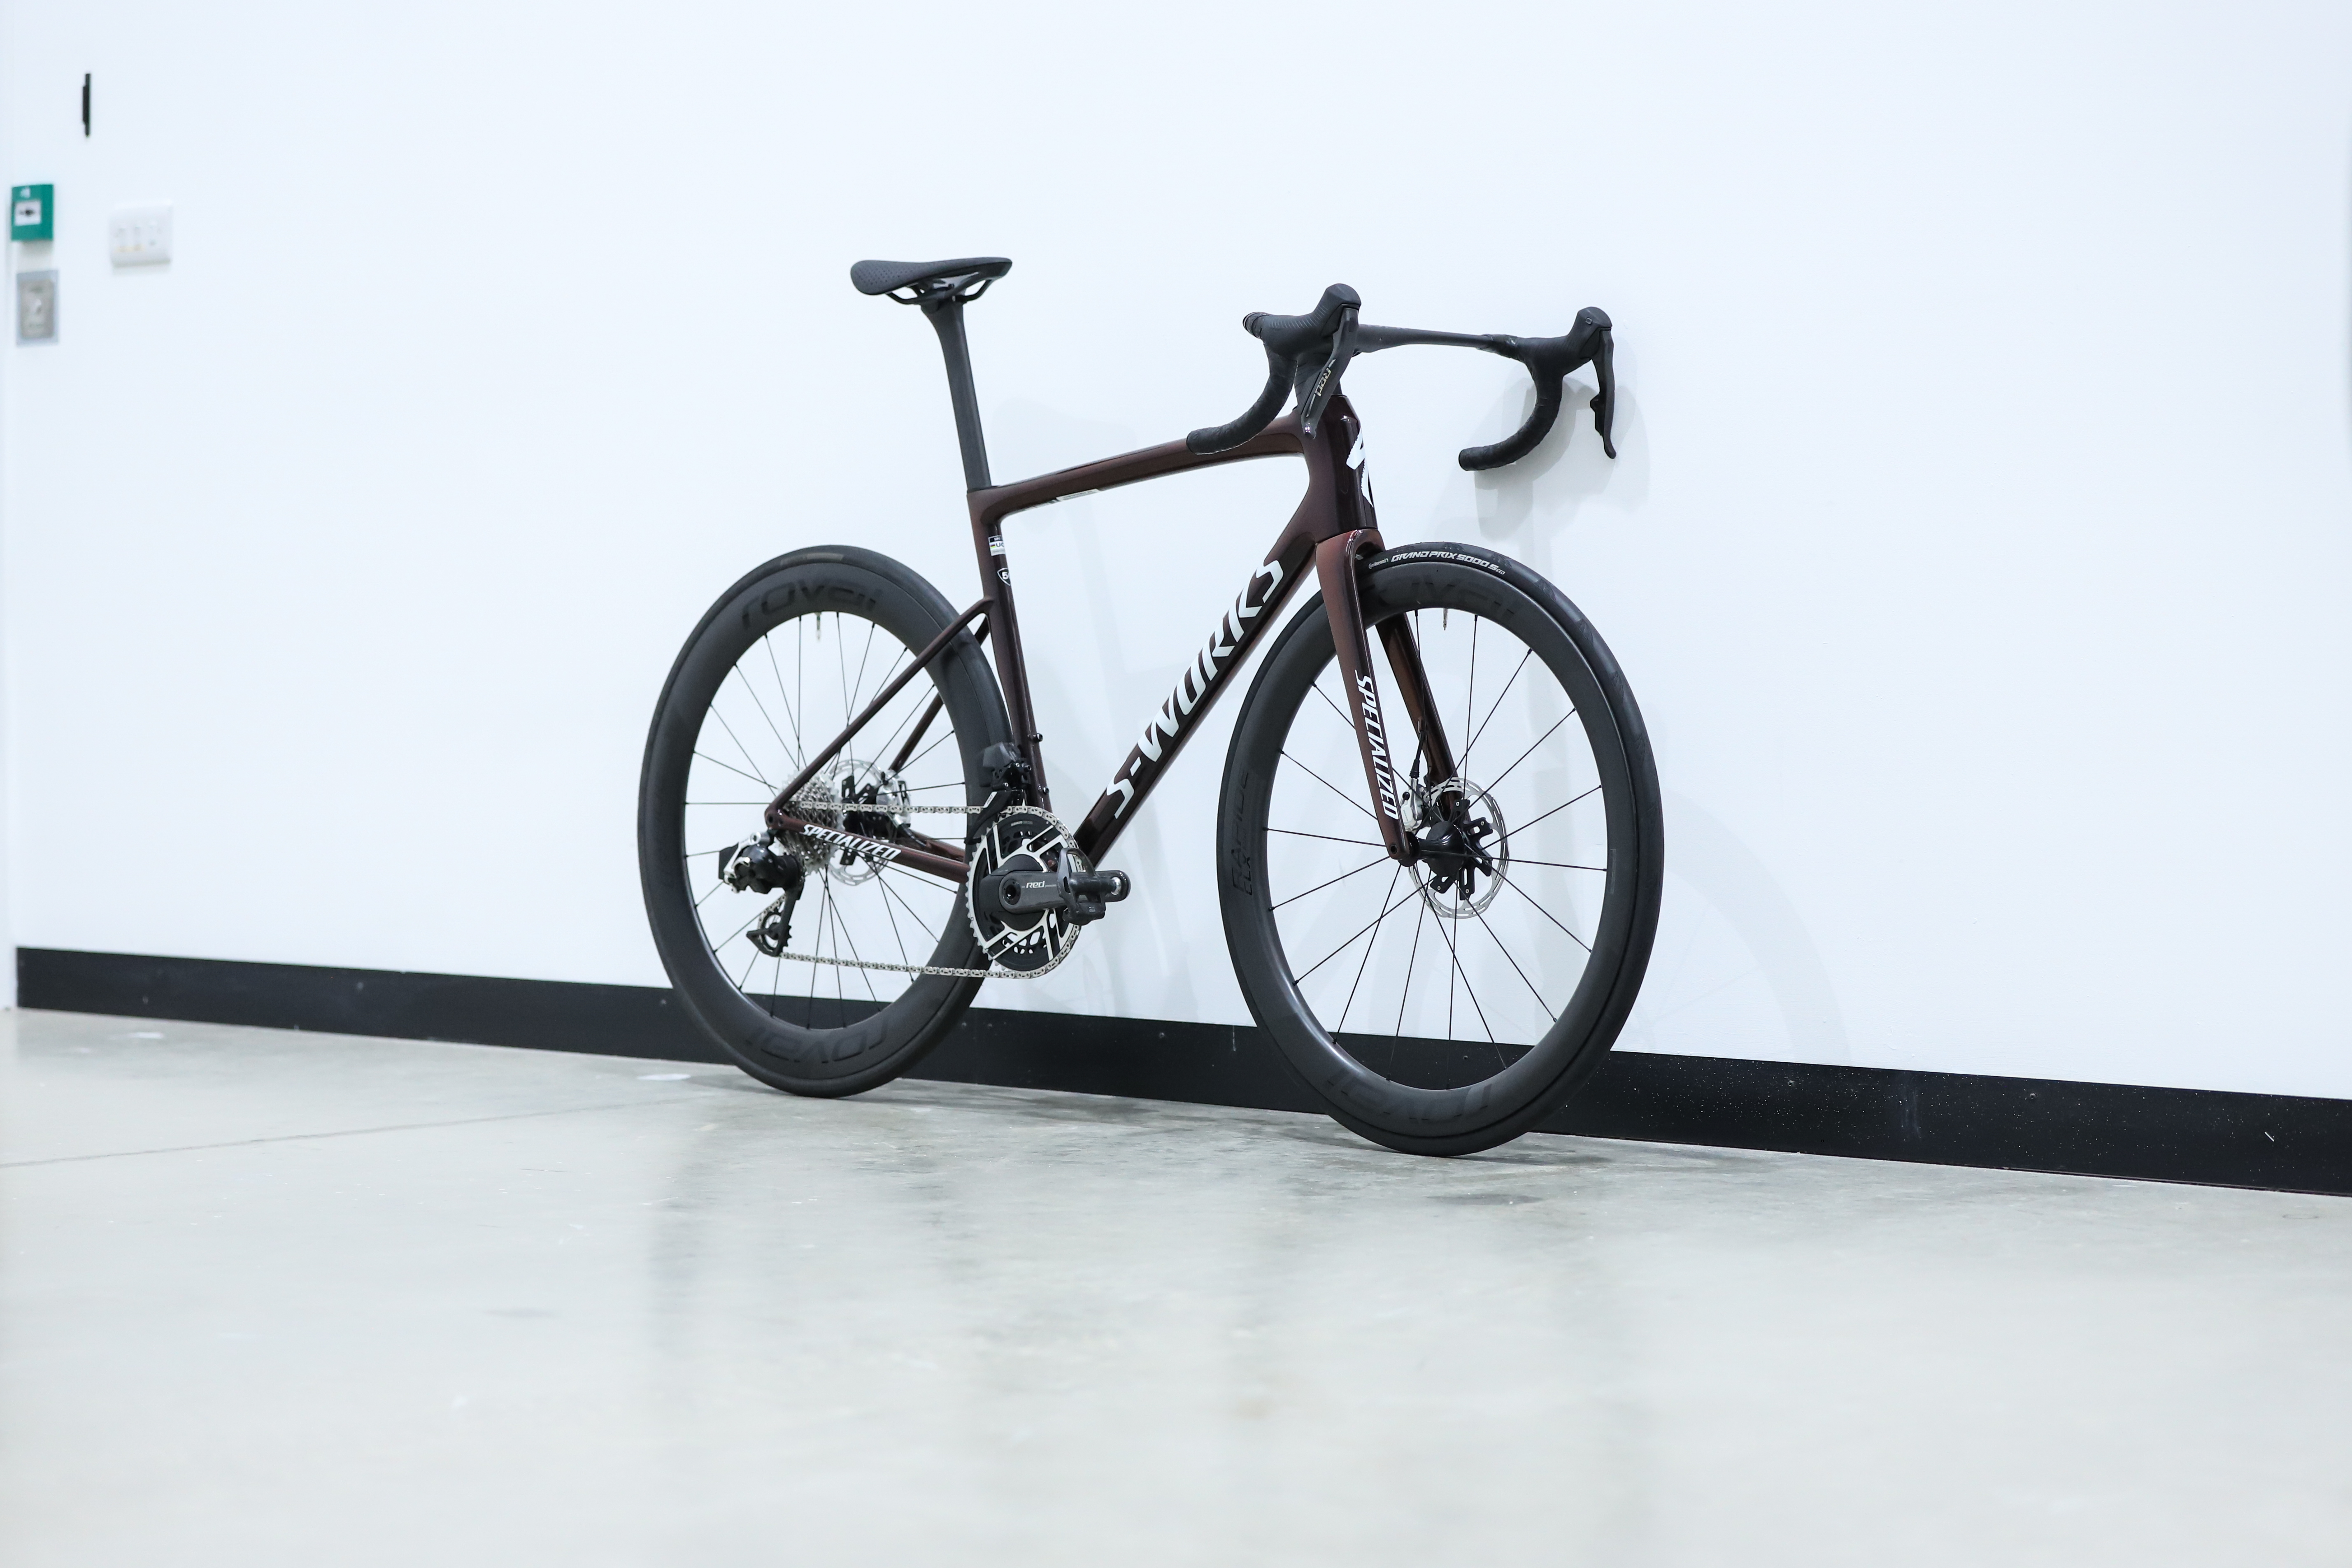
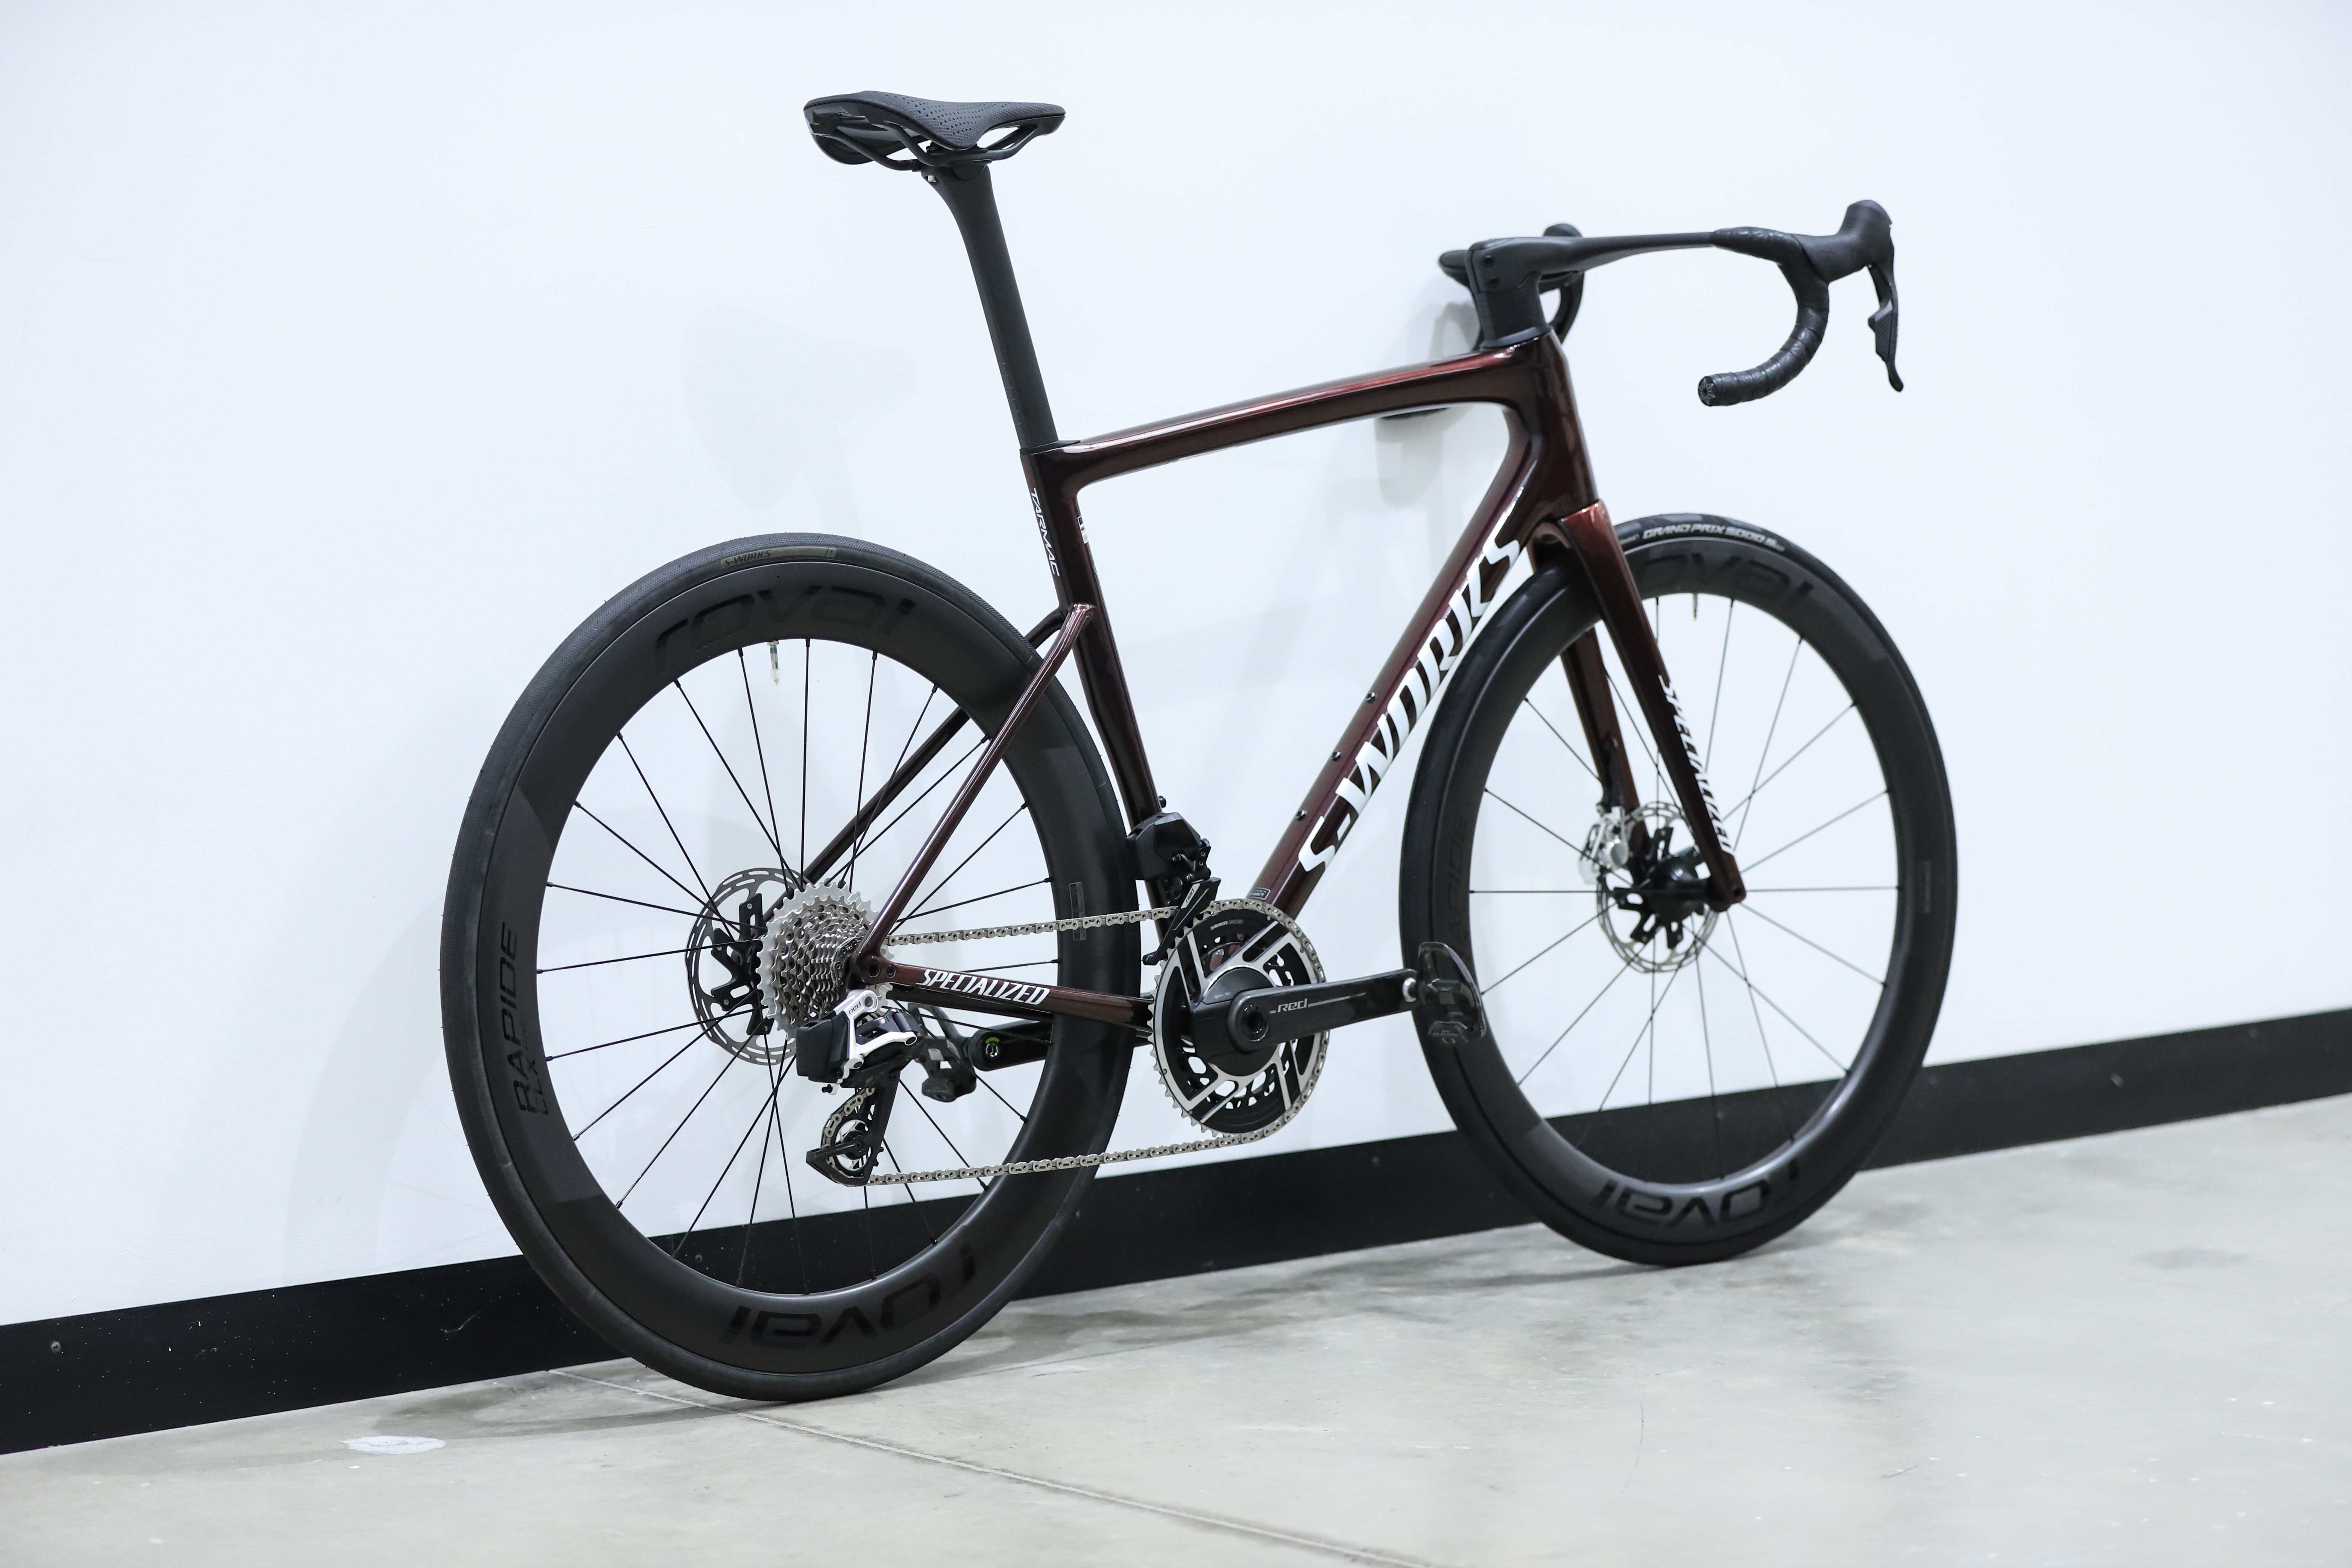
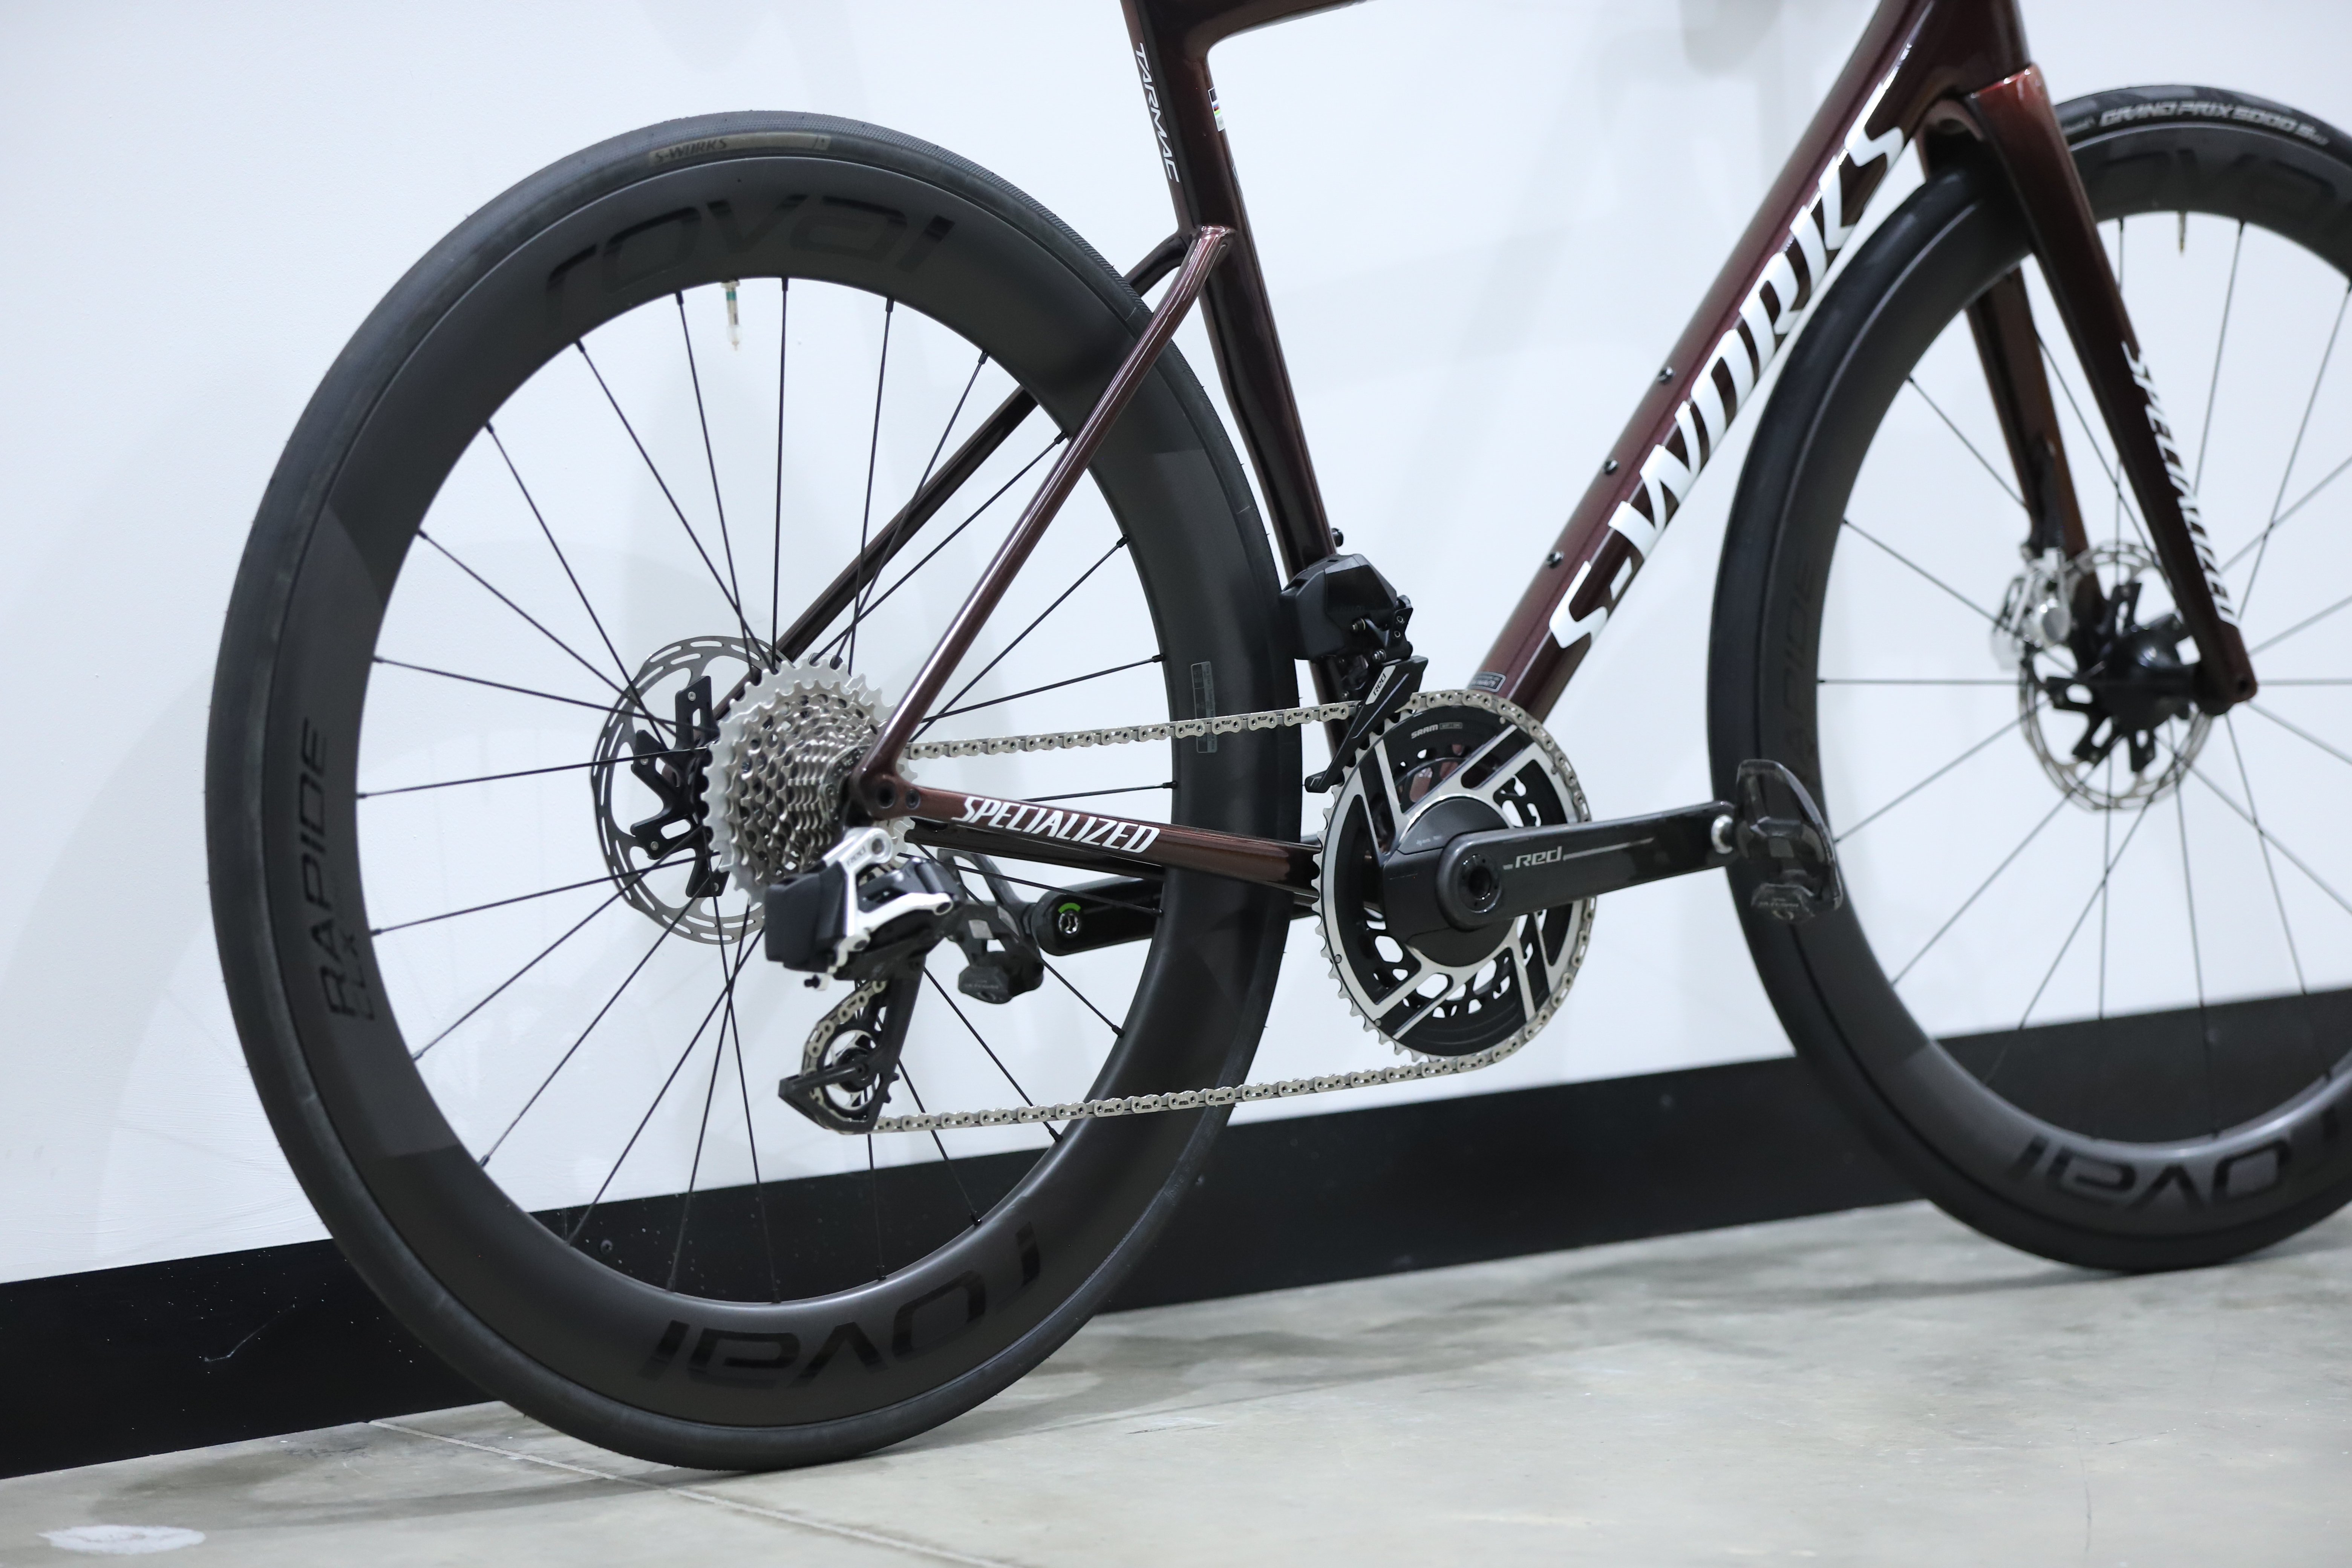
Specialized S-Works Tarmac SL8


Average CdA
0.3404
Watts saved at 40km/h
24.47
Time saved over 40km at 250w
00:01:46
Average CdA
0.0917
Watts saved at 40km/h
37.23
Time saved over 40km at 250w
00:05:45
The Specialized S-Works Tarmac SL8, complete with new SRAM Red AXS groupset here, made headlines at its launch in 2023 when the protruding head tube was dubbed the 'speed sniffer'.
The Tarmac is arguably the bike with the biggest fan base in this list, perhaps even the world. Evidence of that came a week prior to its launch, when, such was the appetite to know about the impending new bike, that almost of all of Specialized's marketing material was hacked and leaked.
It is the lightest bike on this list at 7.18kg with pedals and bottle cages, but it was outperformed in the aerodynamics stakes. It landed in at 7th in our bike-only test, but with the error margin taken into account, it can lay claim to as high as 3rd place.
Pinarello Dogma F


Average CdA
0.3444
Watts saved at 40km/h
21.24
Time saved over 40km at 250w
00:01:32
Average CdA
0.0915
Watts saved at 40km/h
37.47
Time saved over 40km at 250w
00:05:48
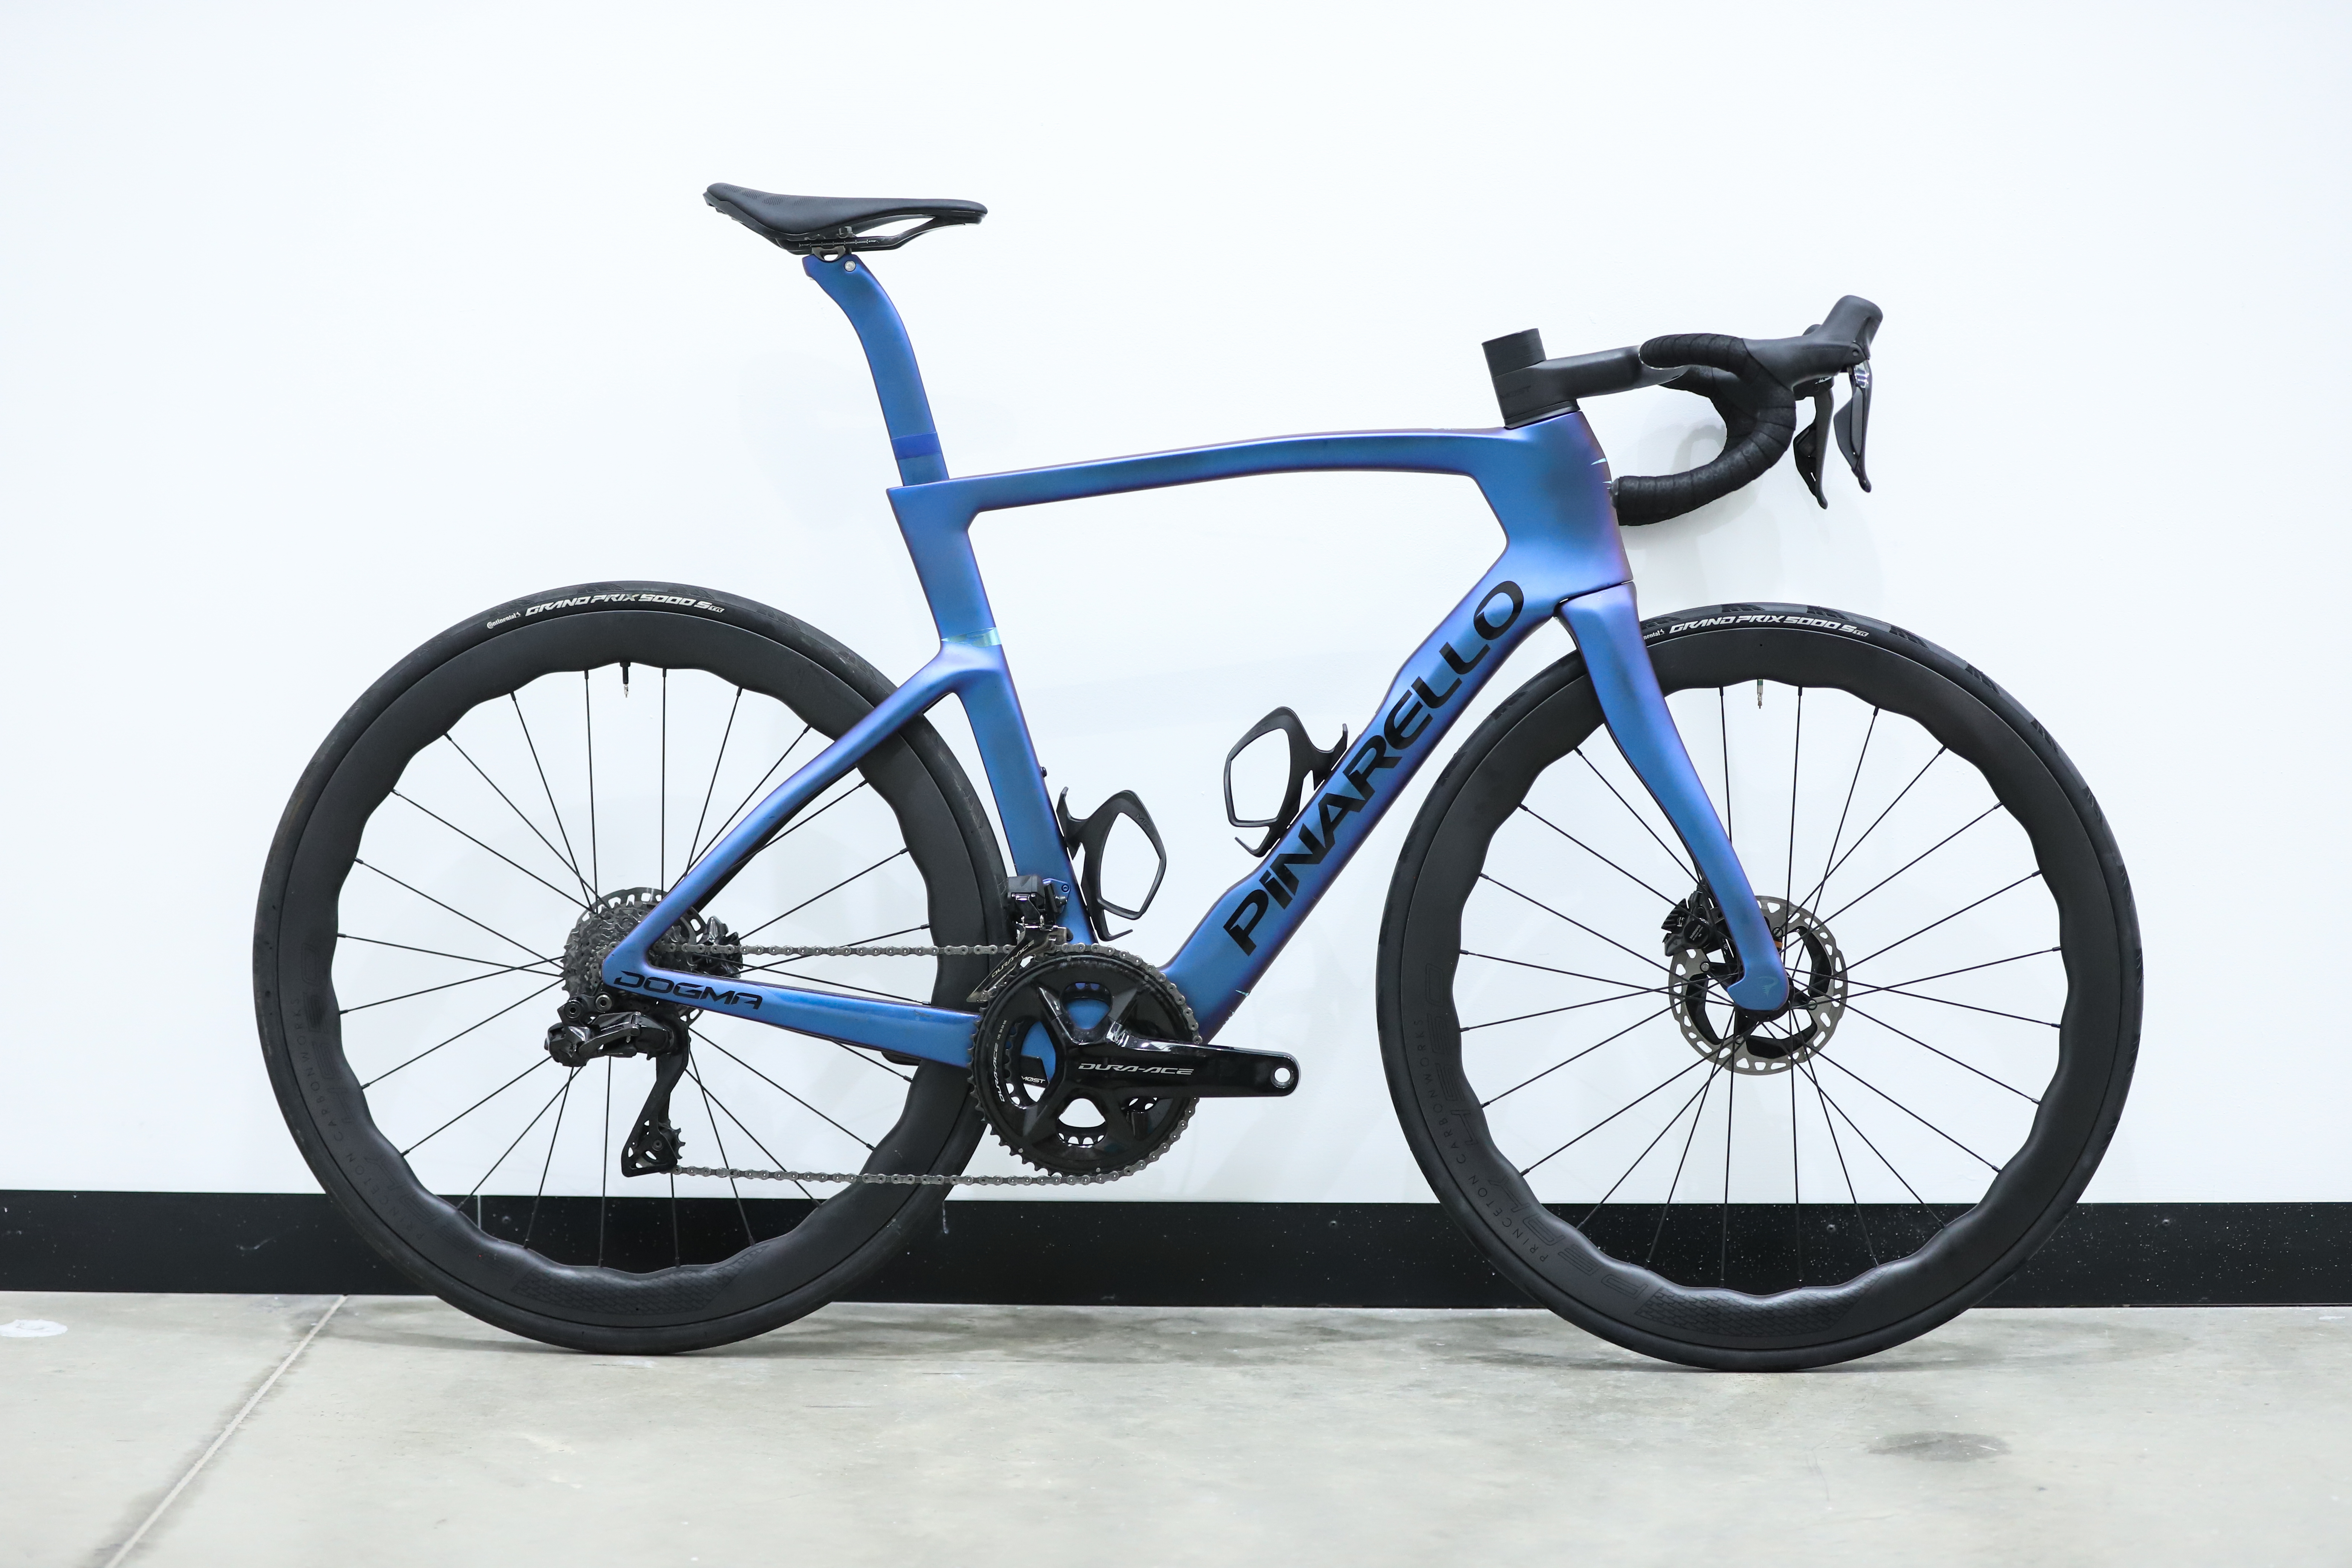
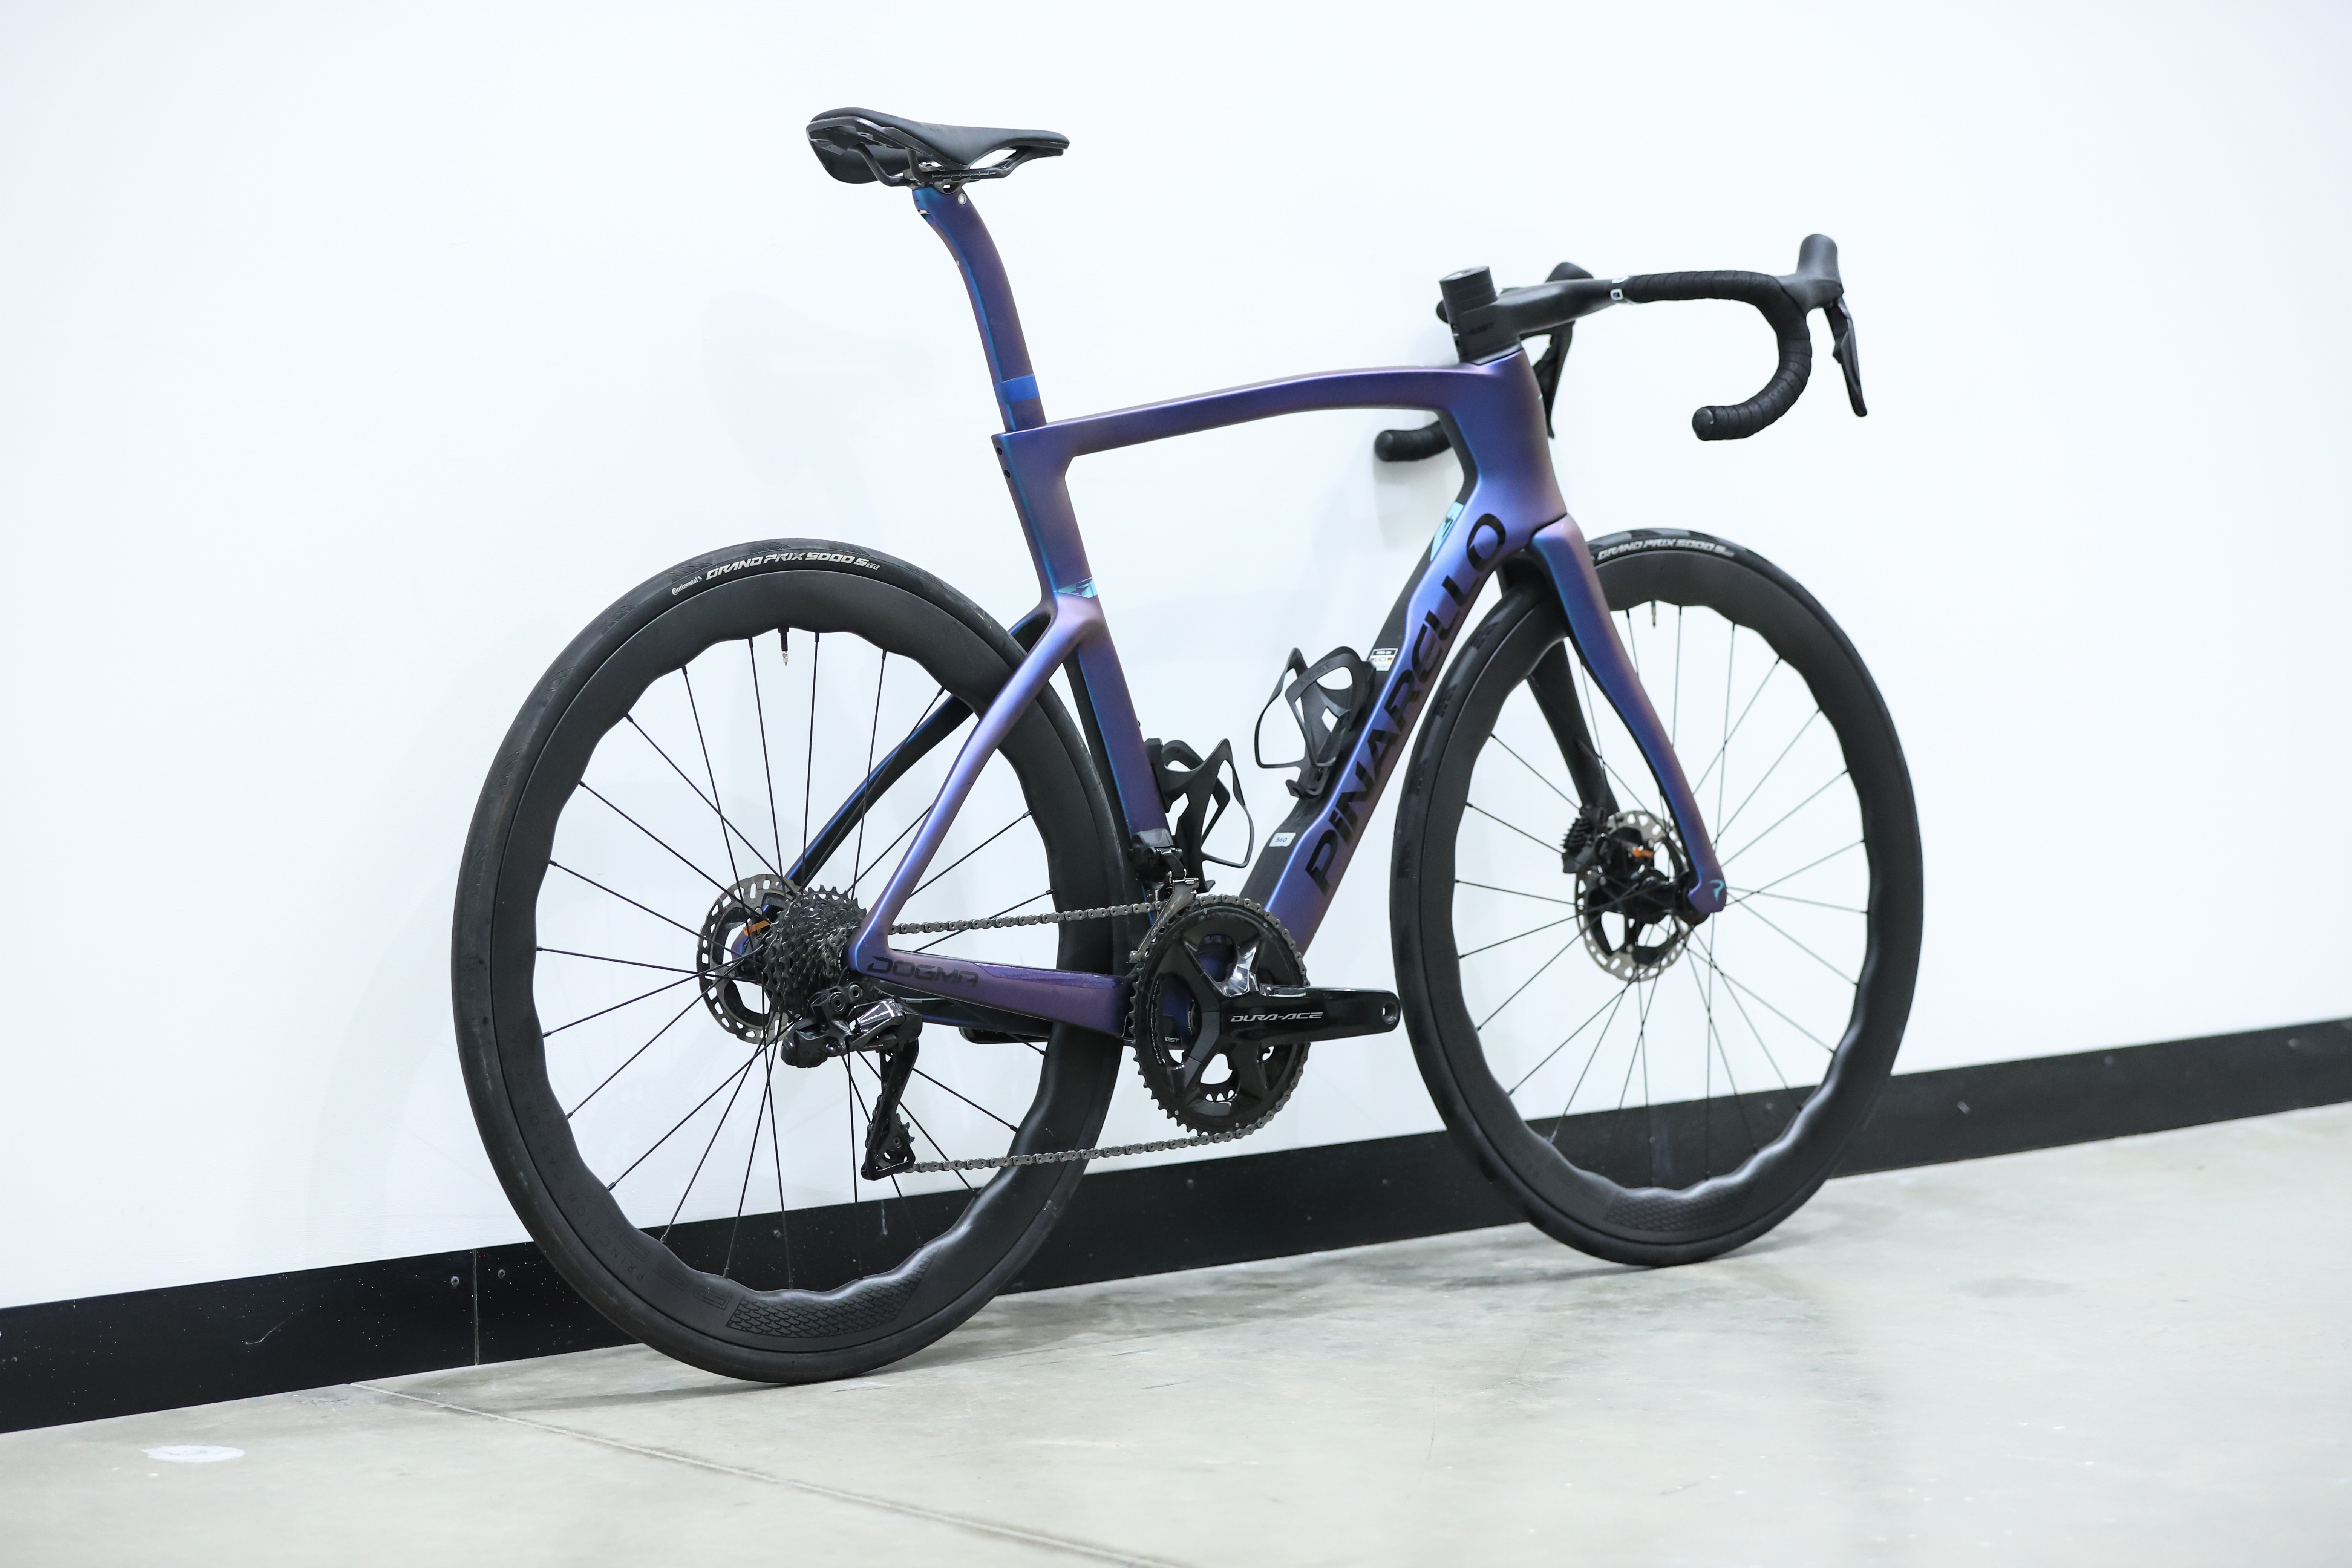
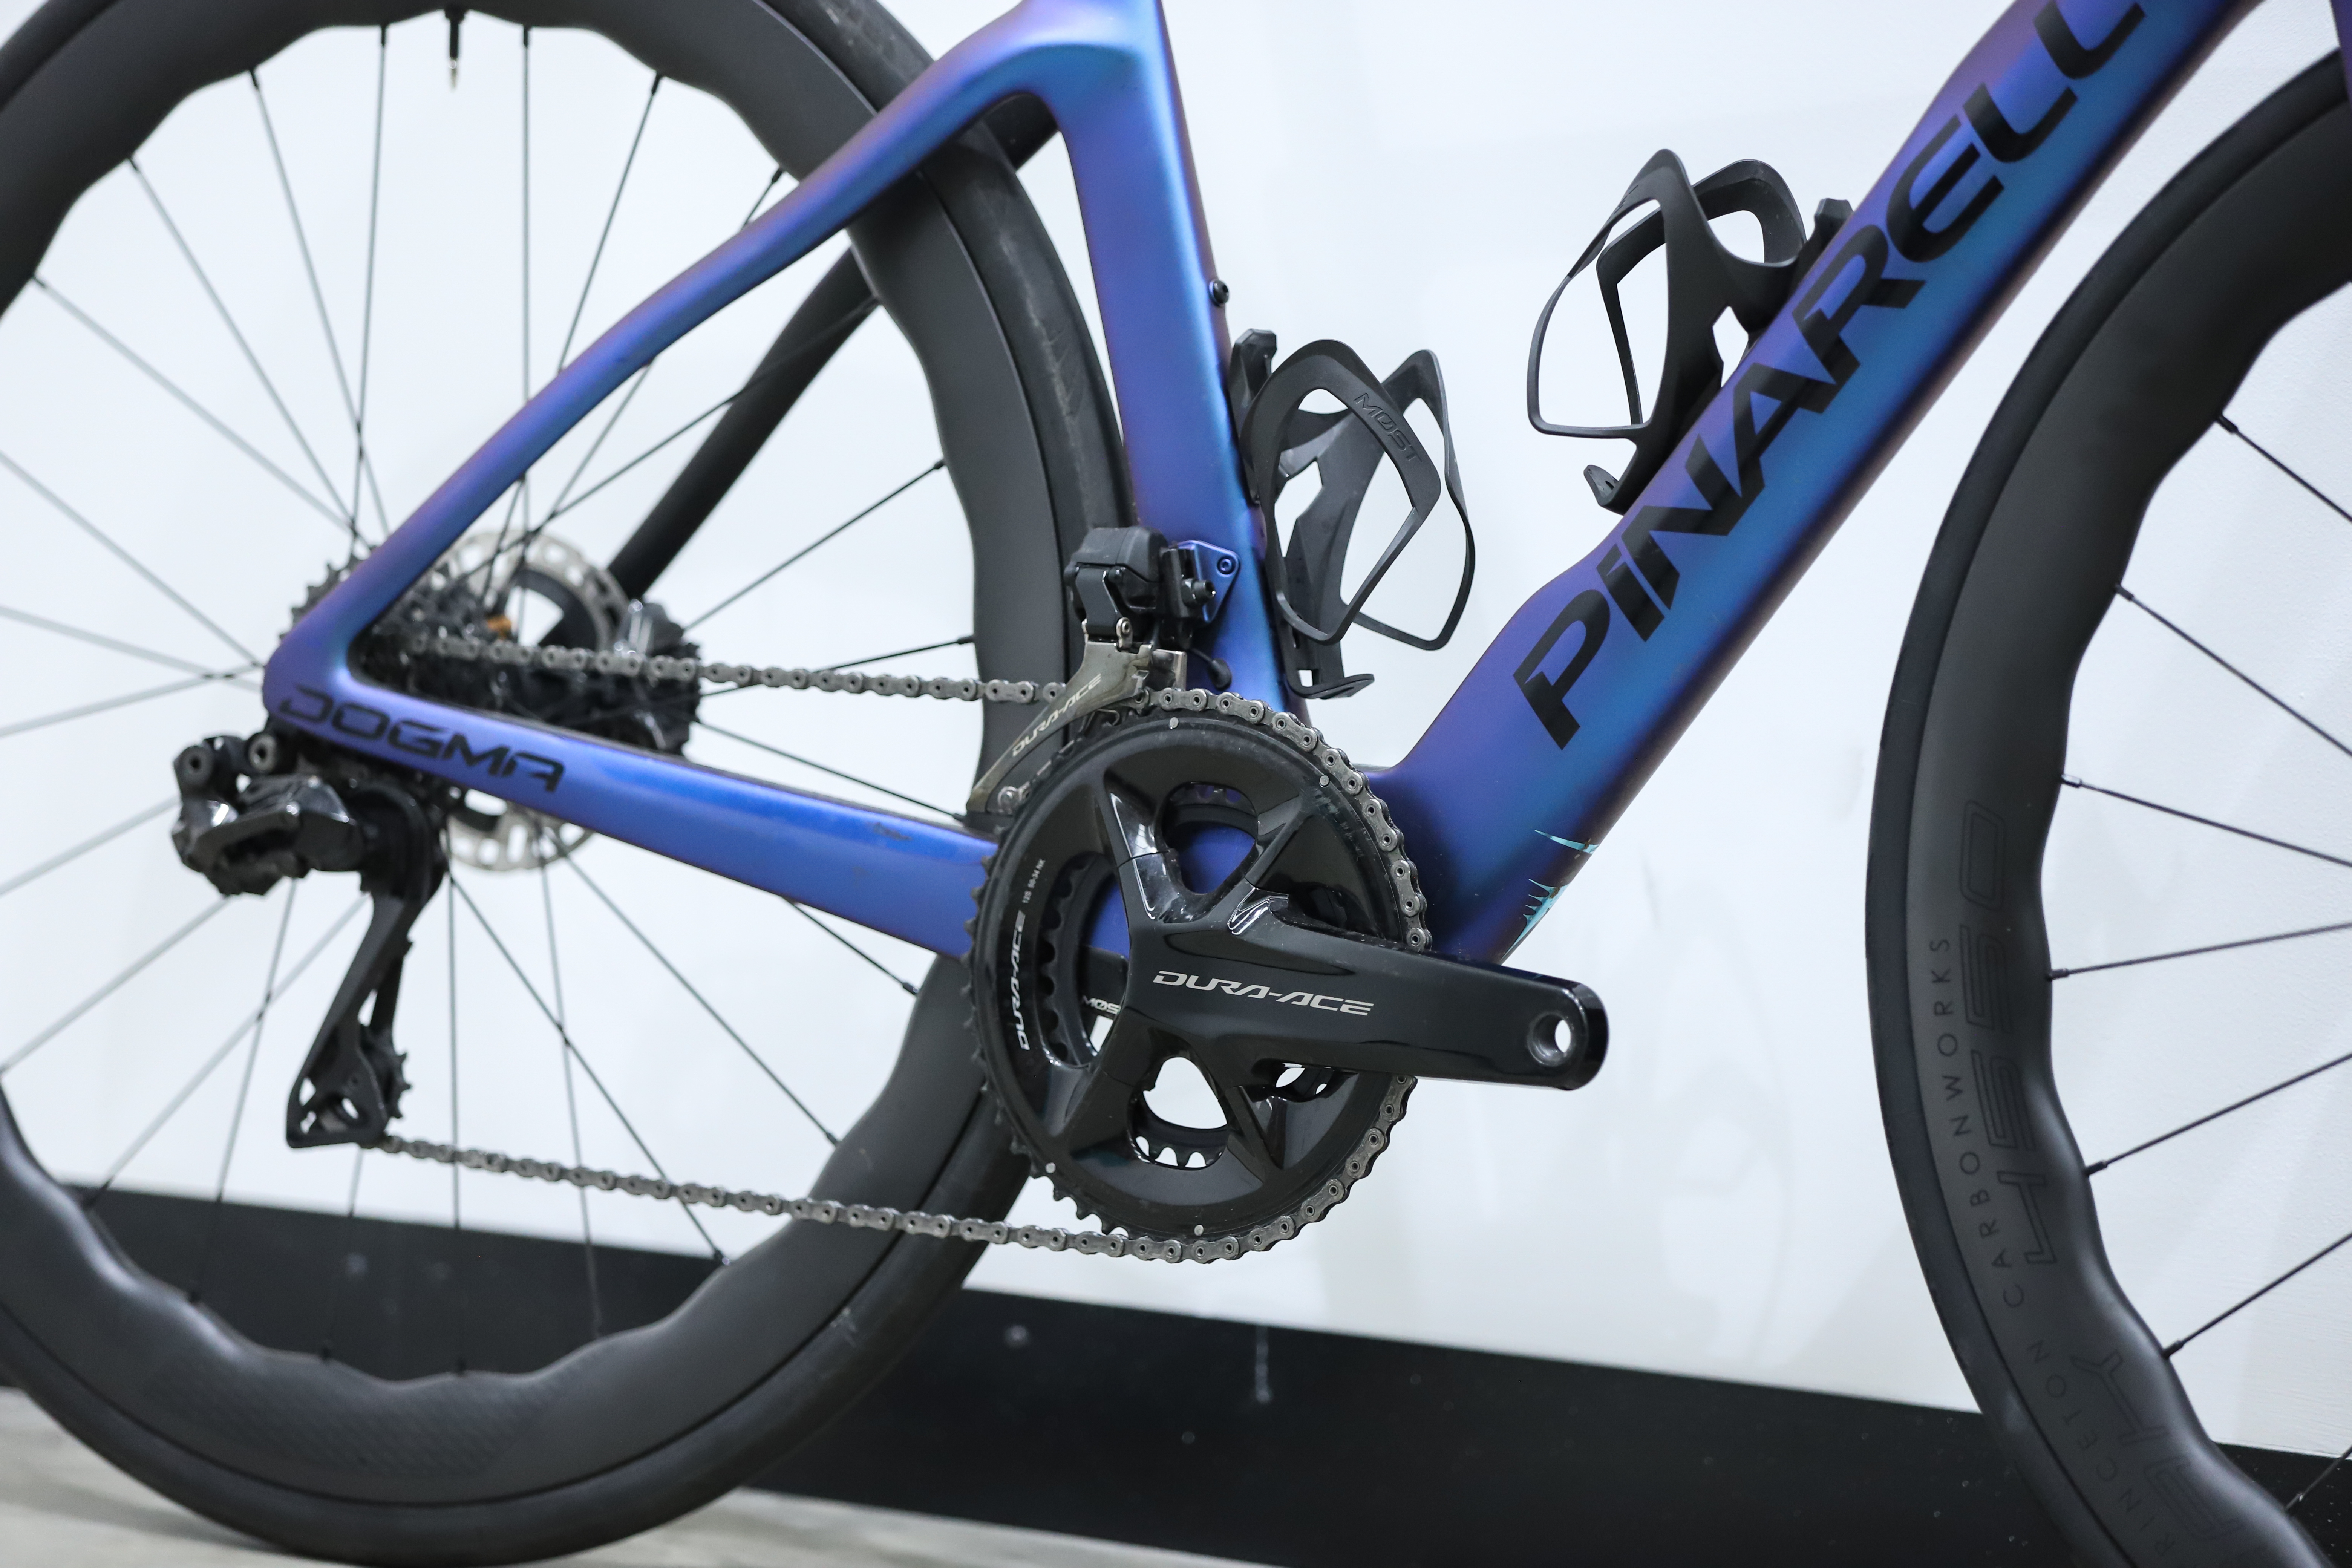
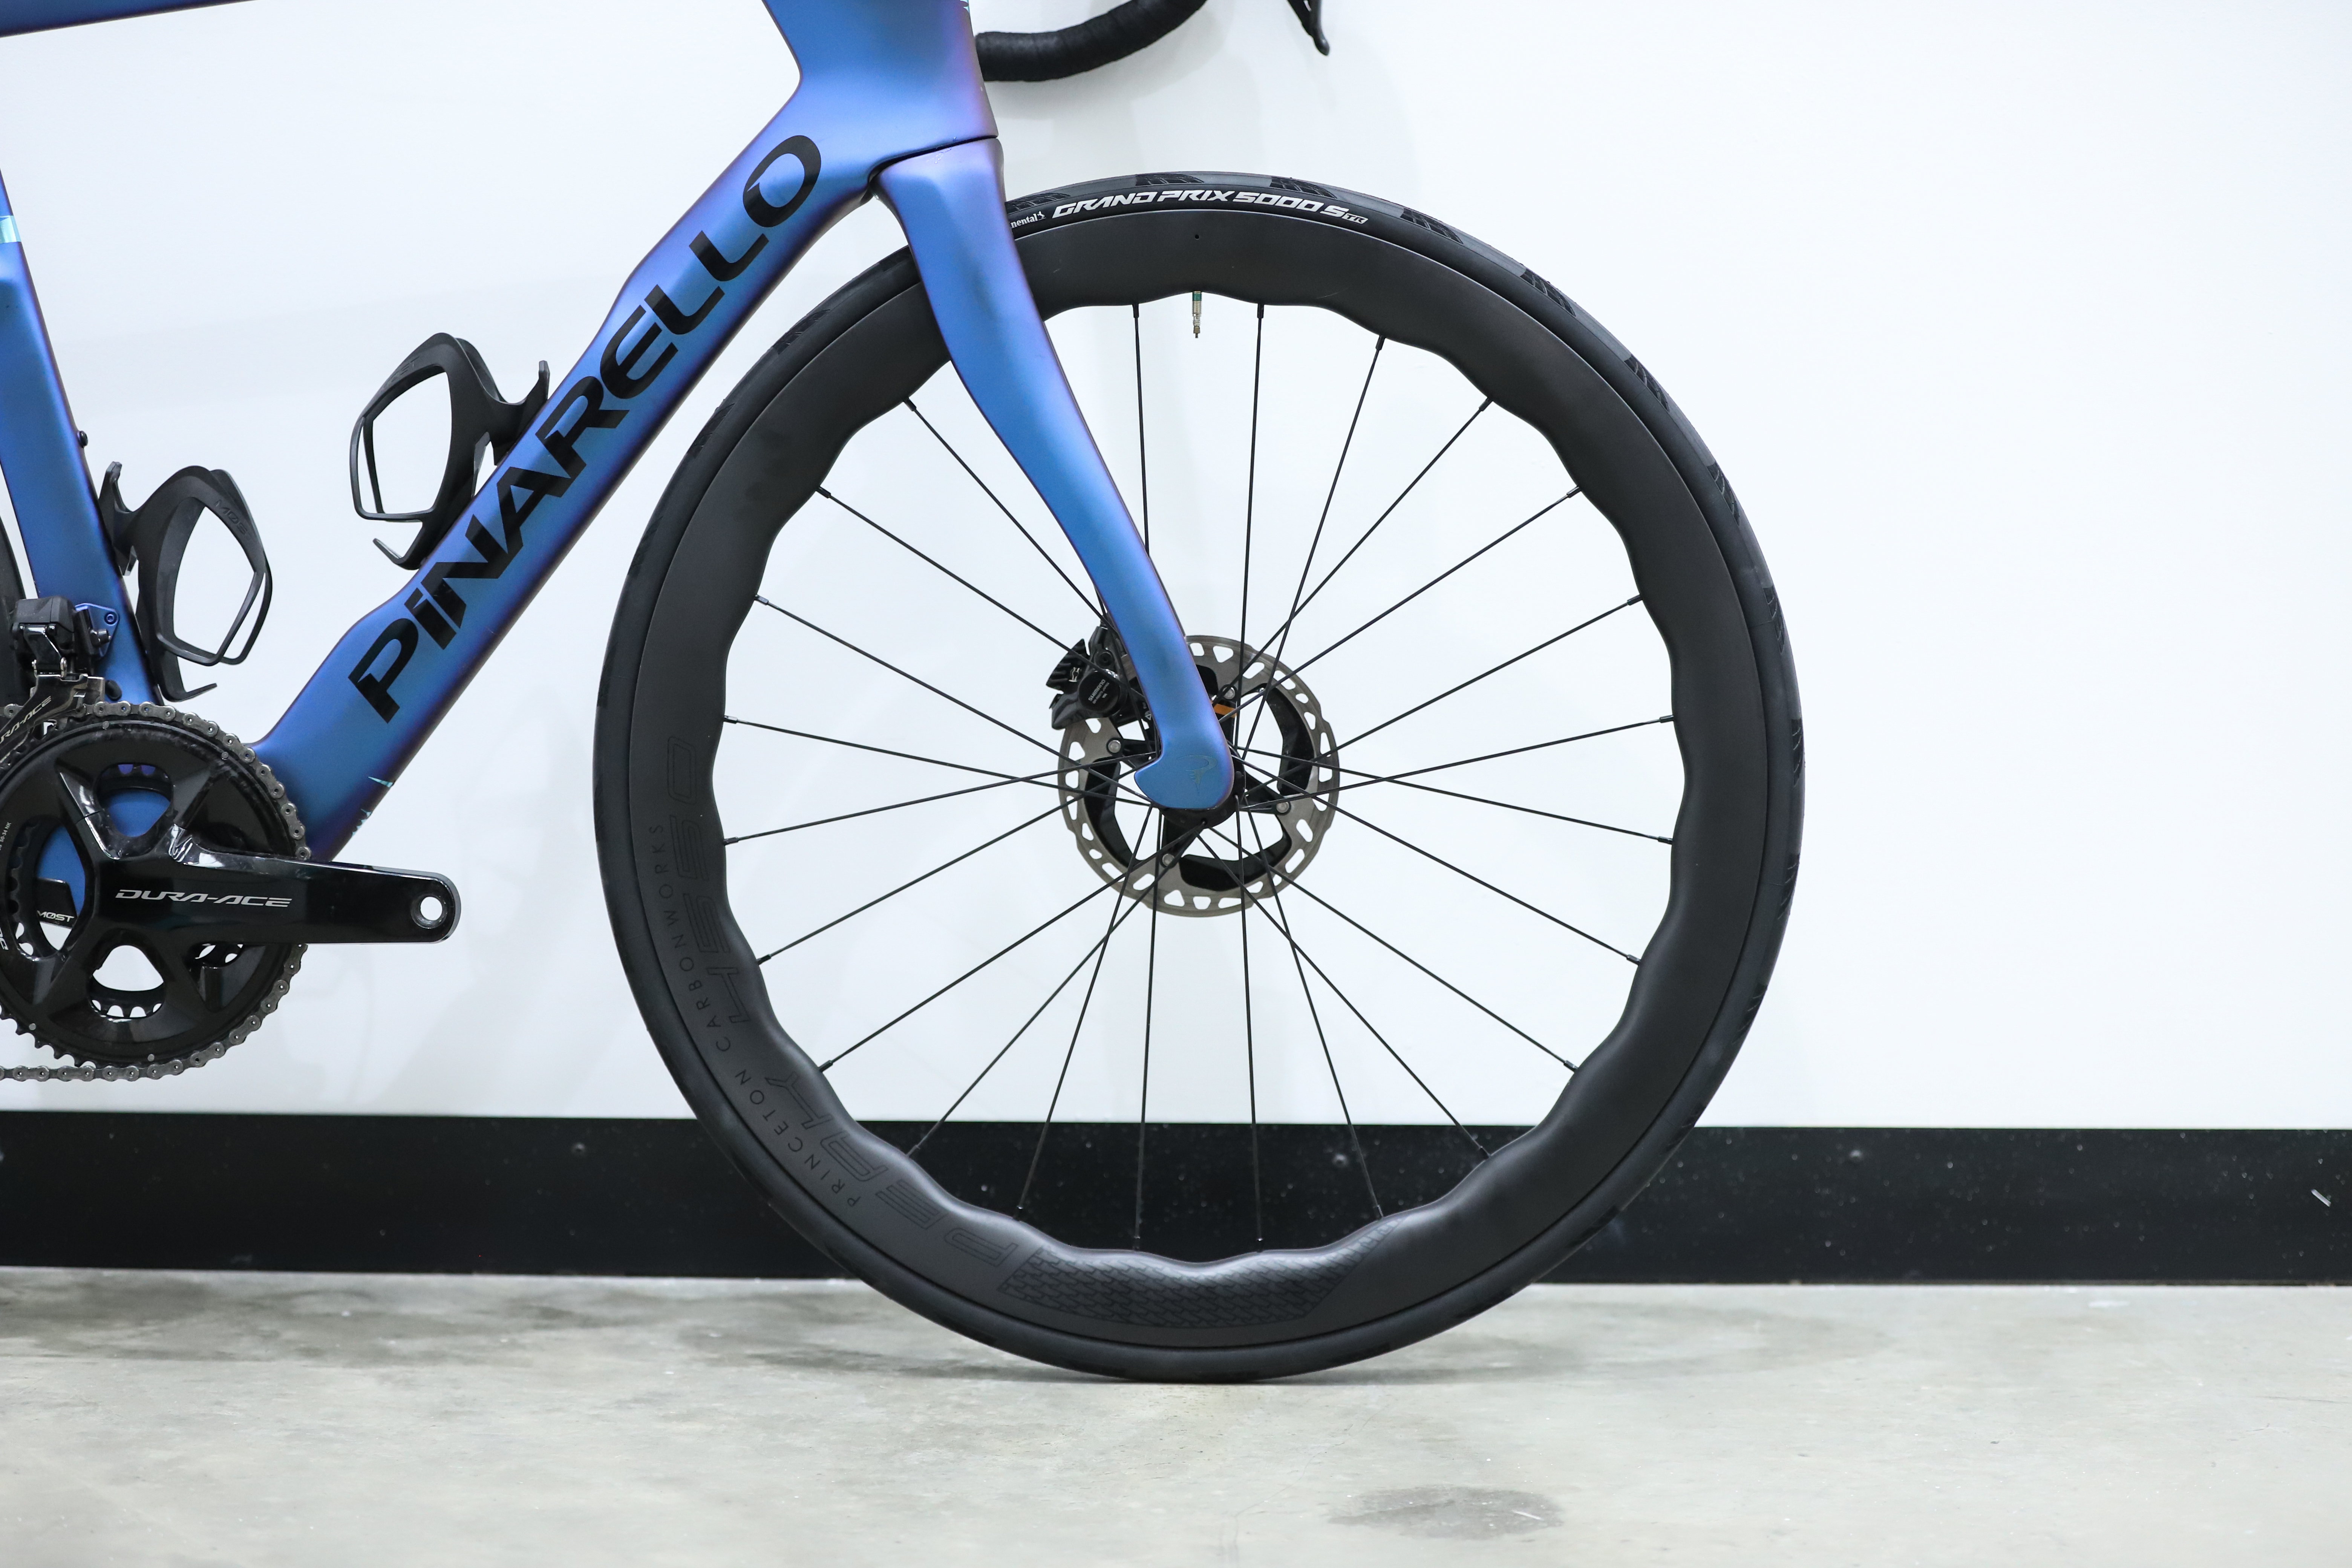
The Dogma F launched just ahead of the 2024 Tour de France, claiming to be 108g lighter - just under half of which came through a new cockpit - as well as a longer wheelbase, 30c tyre clearance, and a 0.2% improvement in the drag coefficient. For context, that's around 0.00027kg/m^2 difference in CdA, or around 0.28 watts at 40km/h.
In our tests, we were forced to mount the Dogma F using an additional plate due to the closed or 'blind' dropouts. This could have added a small amount of drag, but we can't be sure exactly how much.
The Dogma was also one of the lighter bikes in our test, tipping our scales at 7.20kg on the nose.
Cannondale SuperSix Evo 4


Average CdA
0.3442
Watts saved at 40km/h
21.37
Time saved over 40km at 250w
00:01:32
Average CdA
0.0905
Watts saved at 40km/h
38.28
Time saved over 40km at 250w
00:05:57
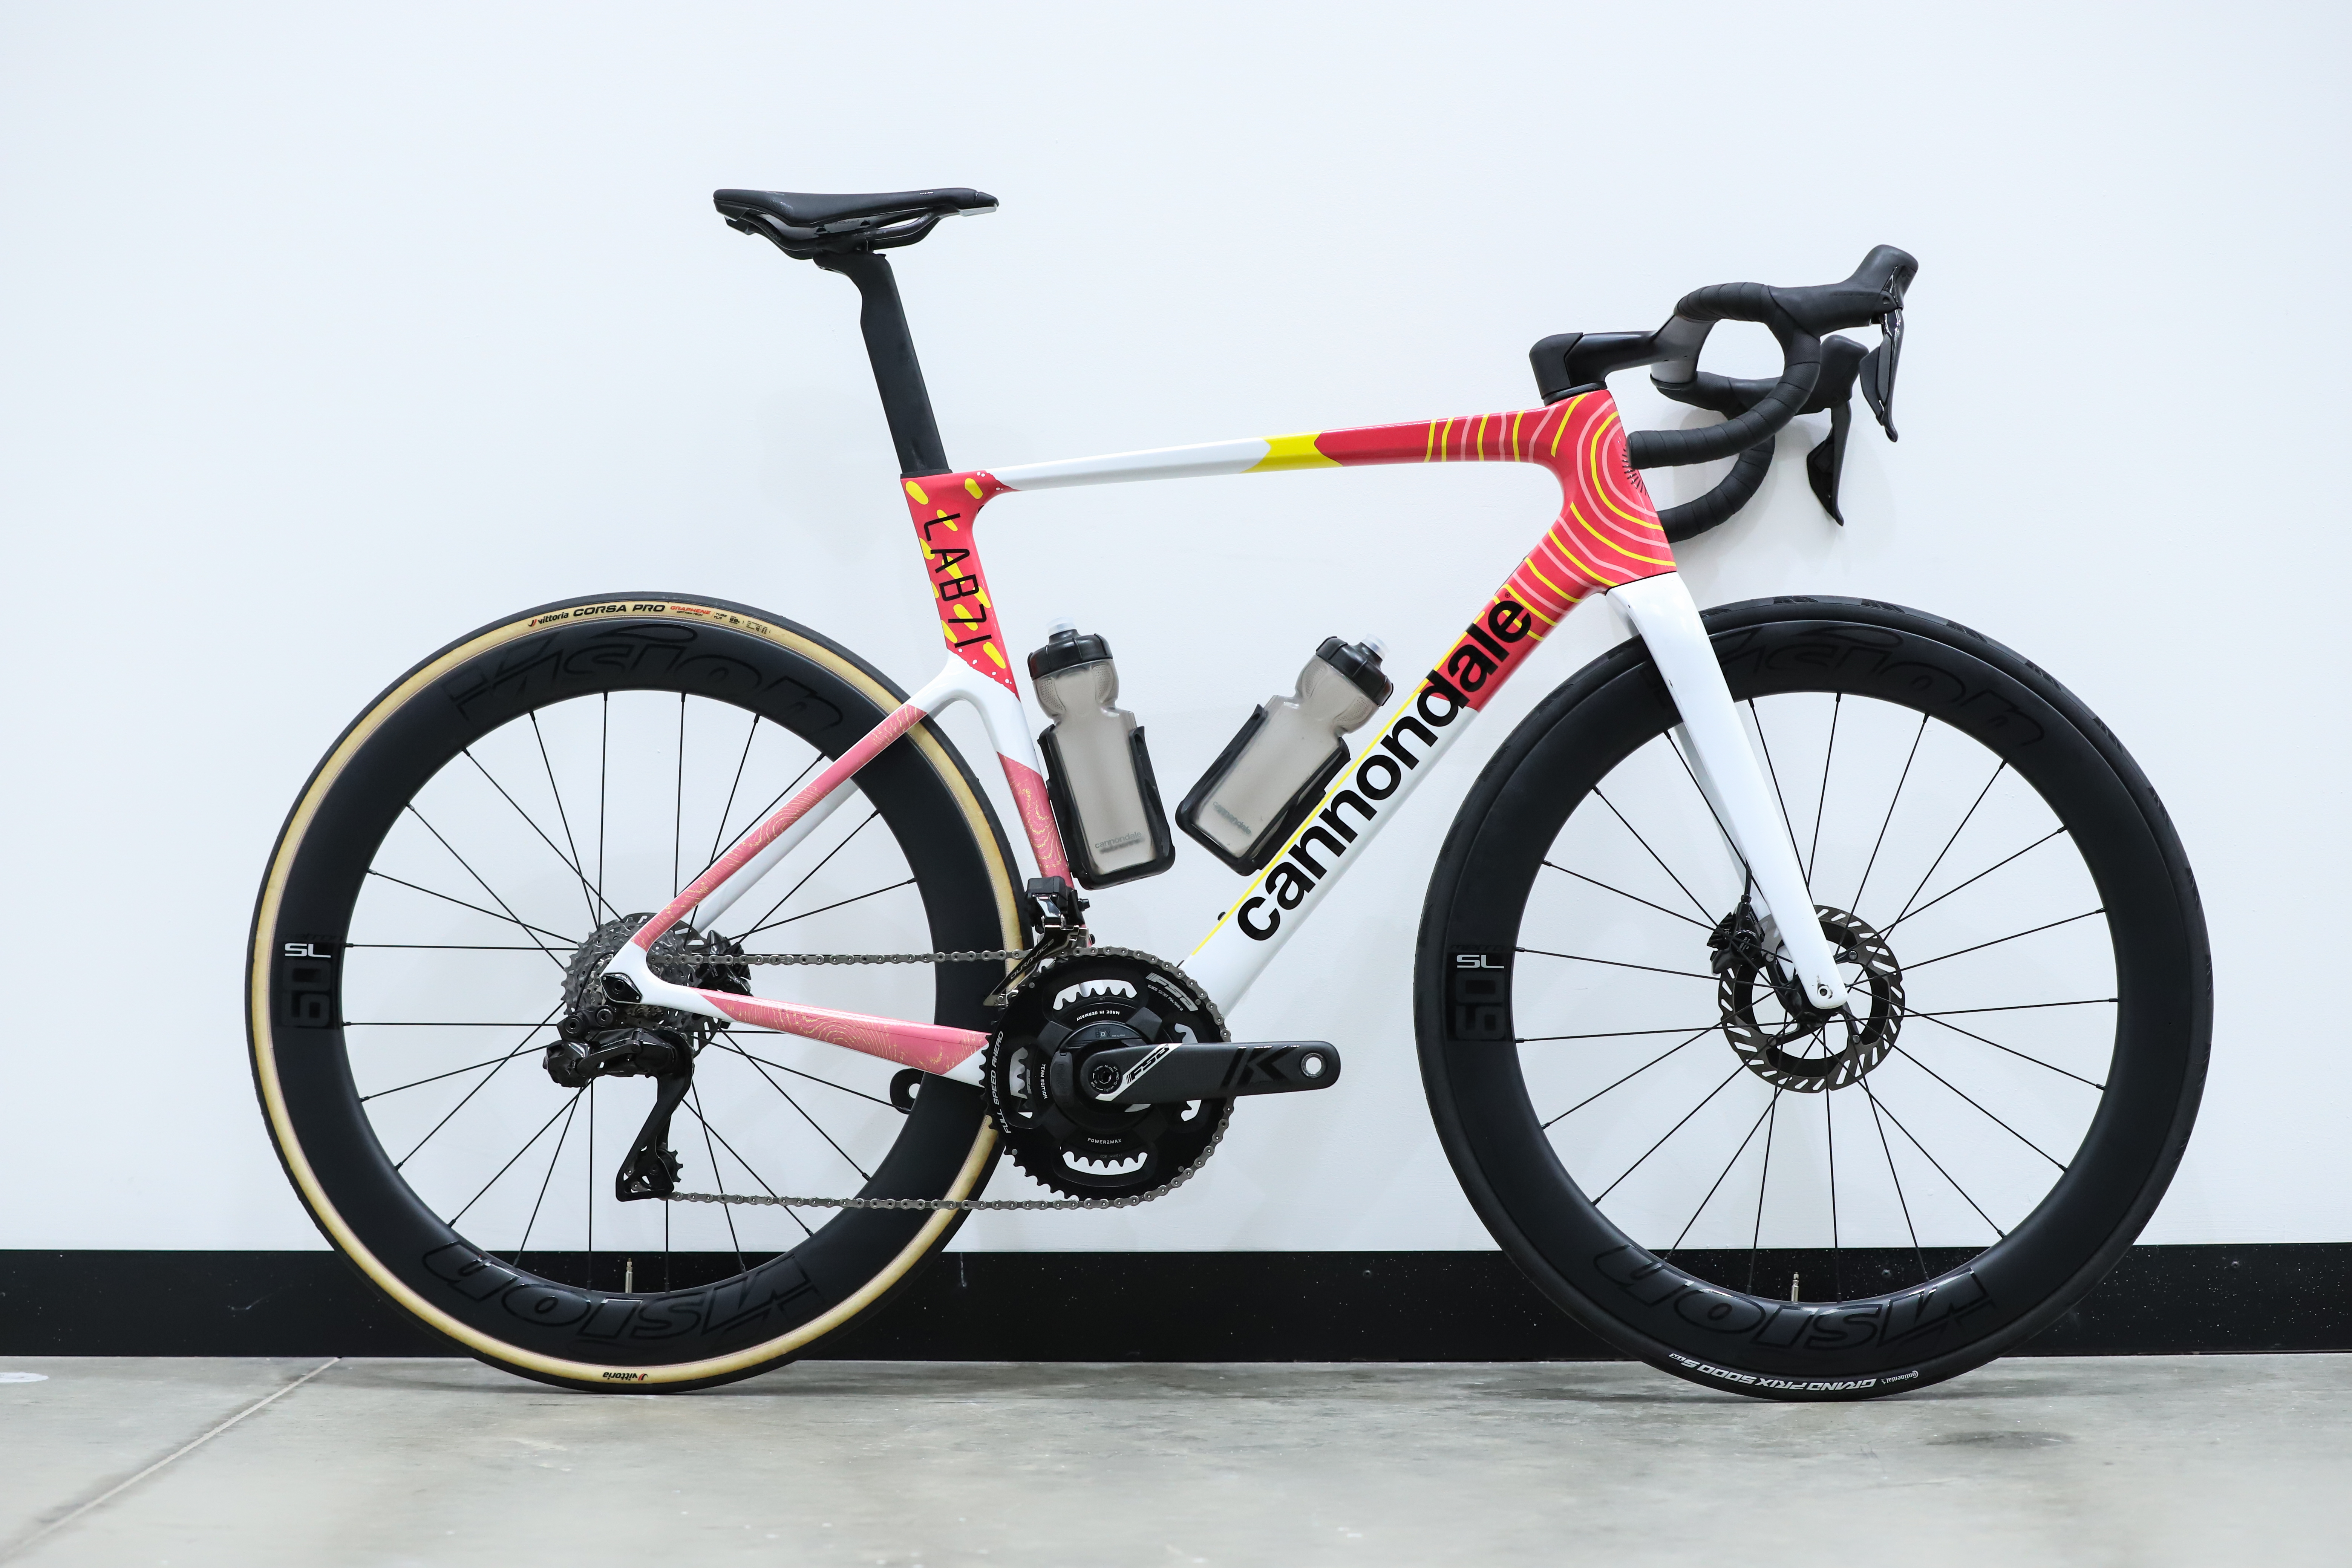
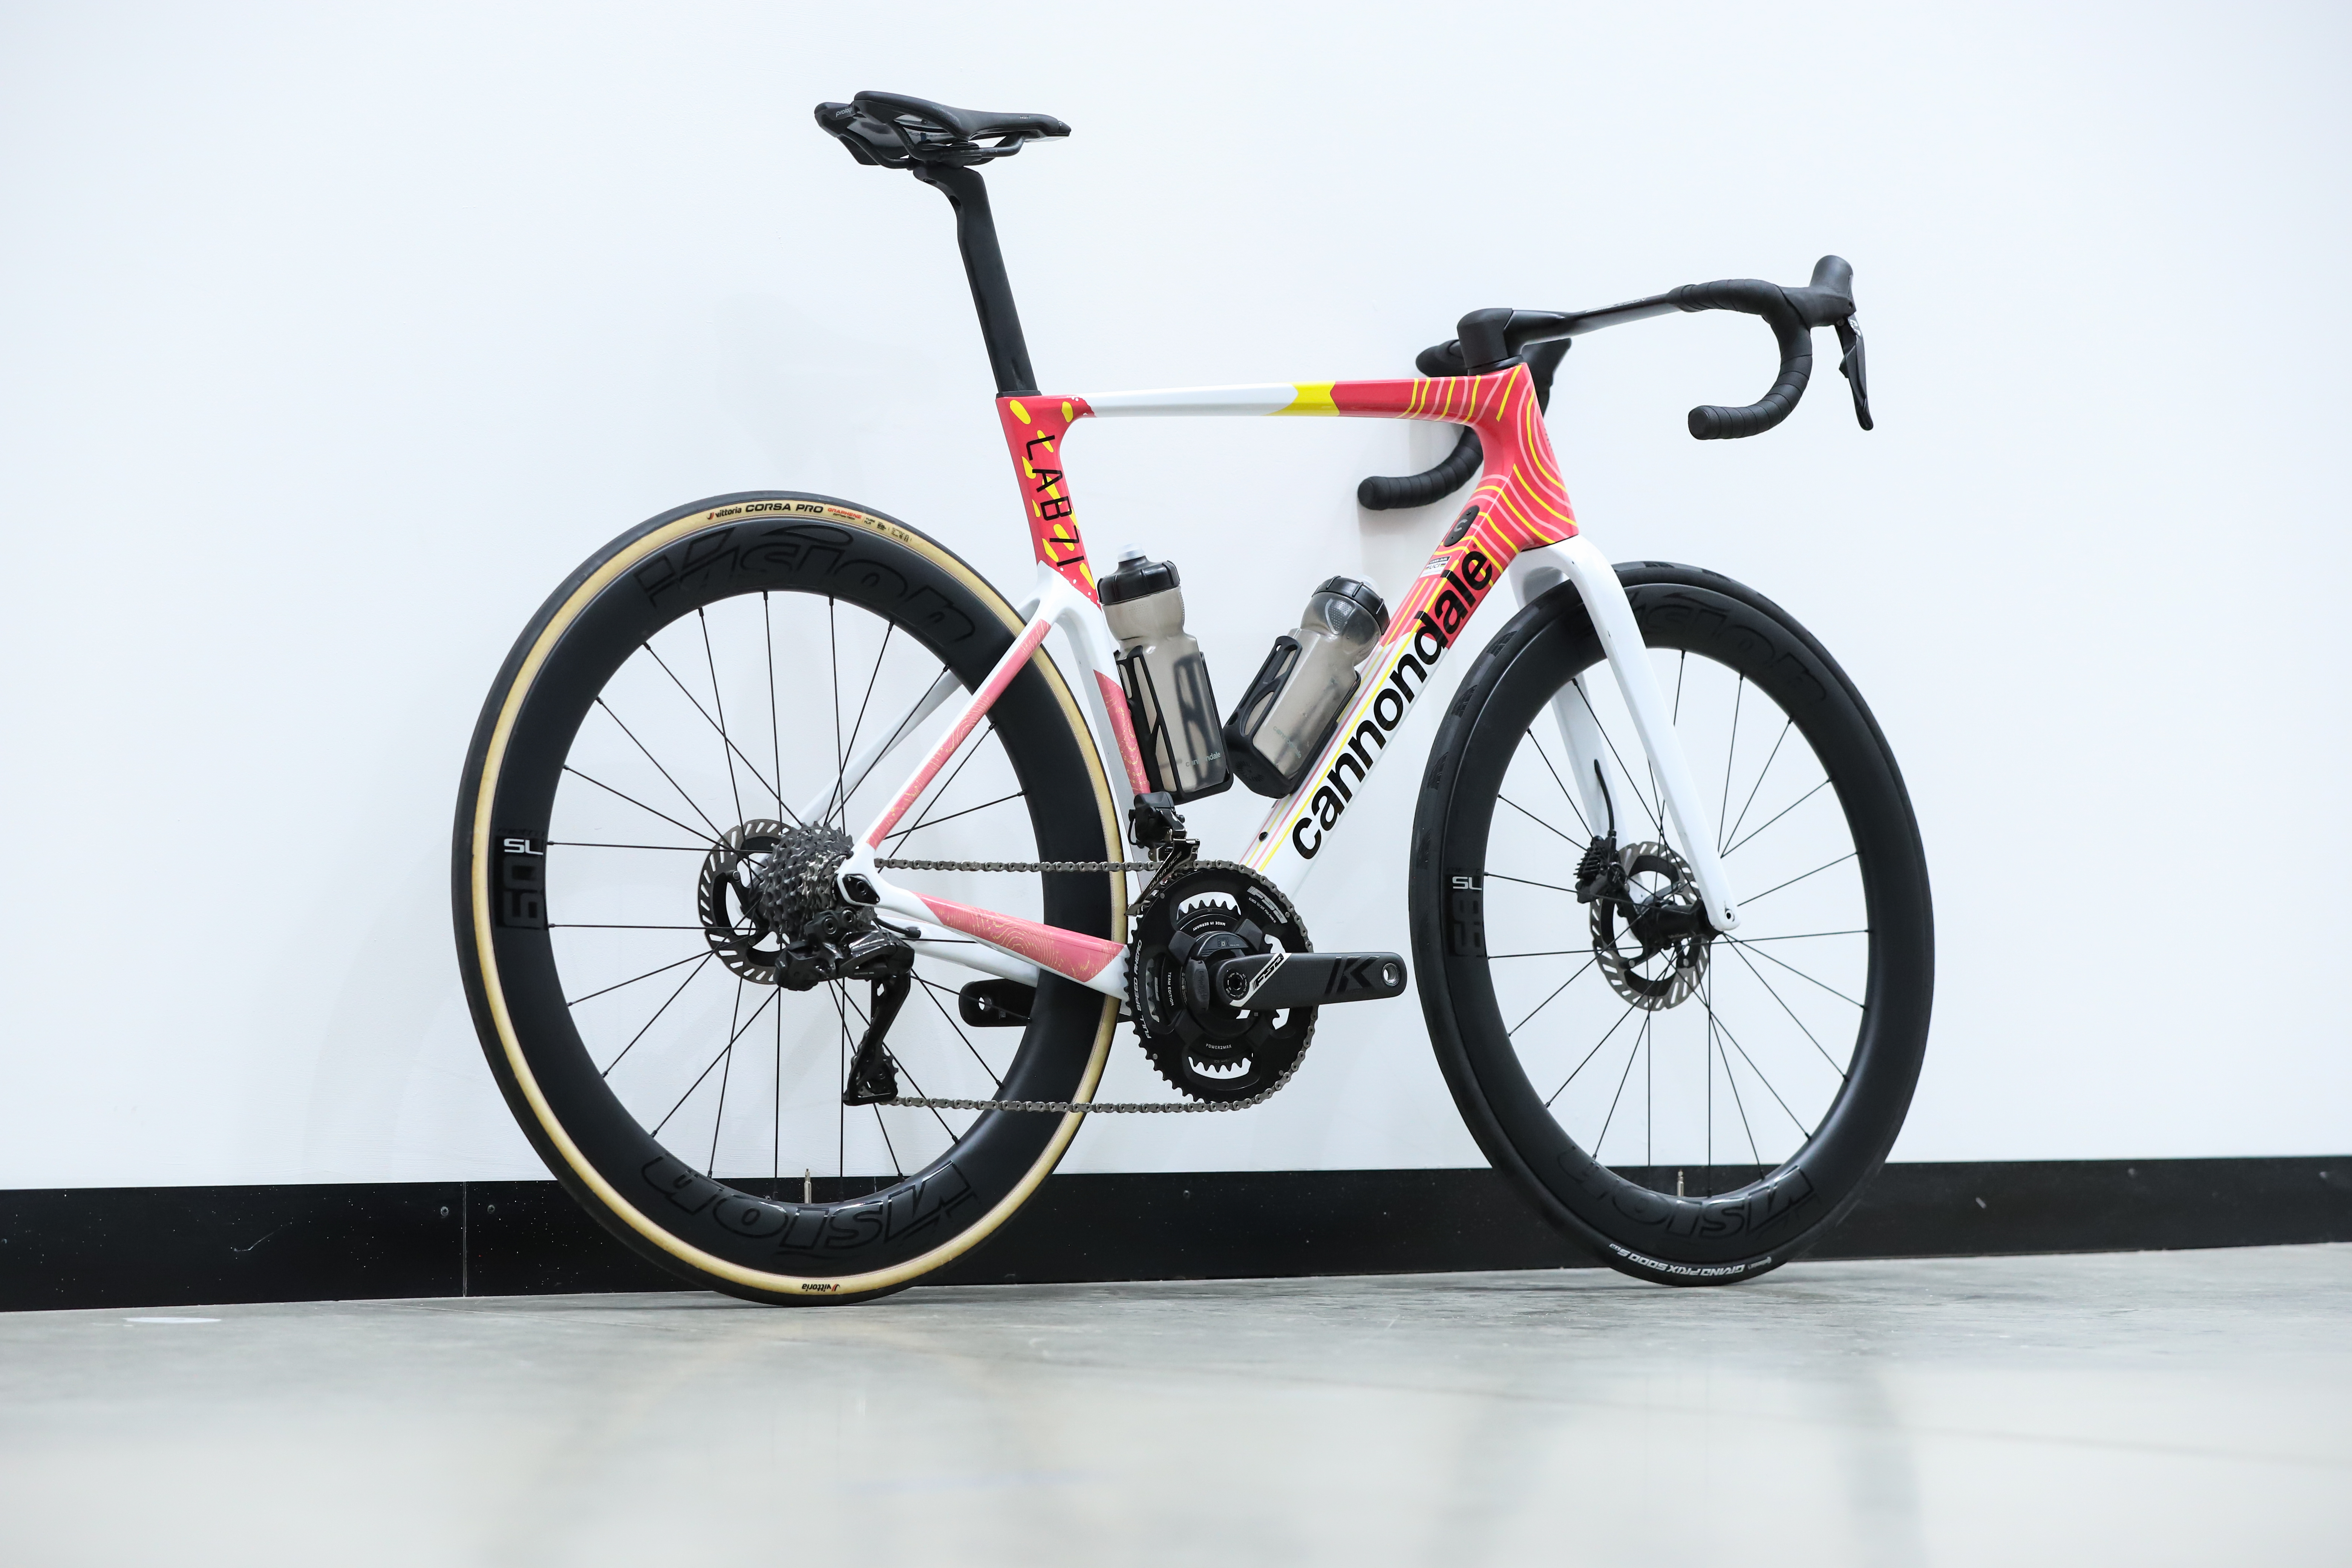
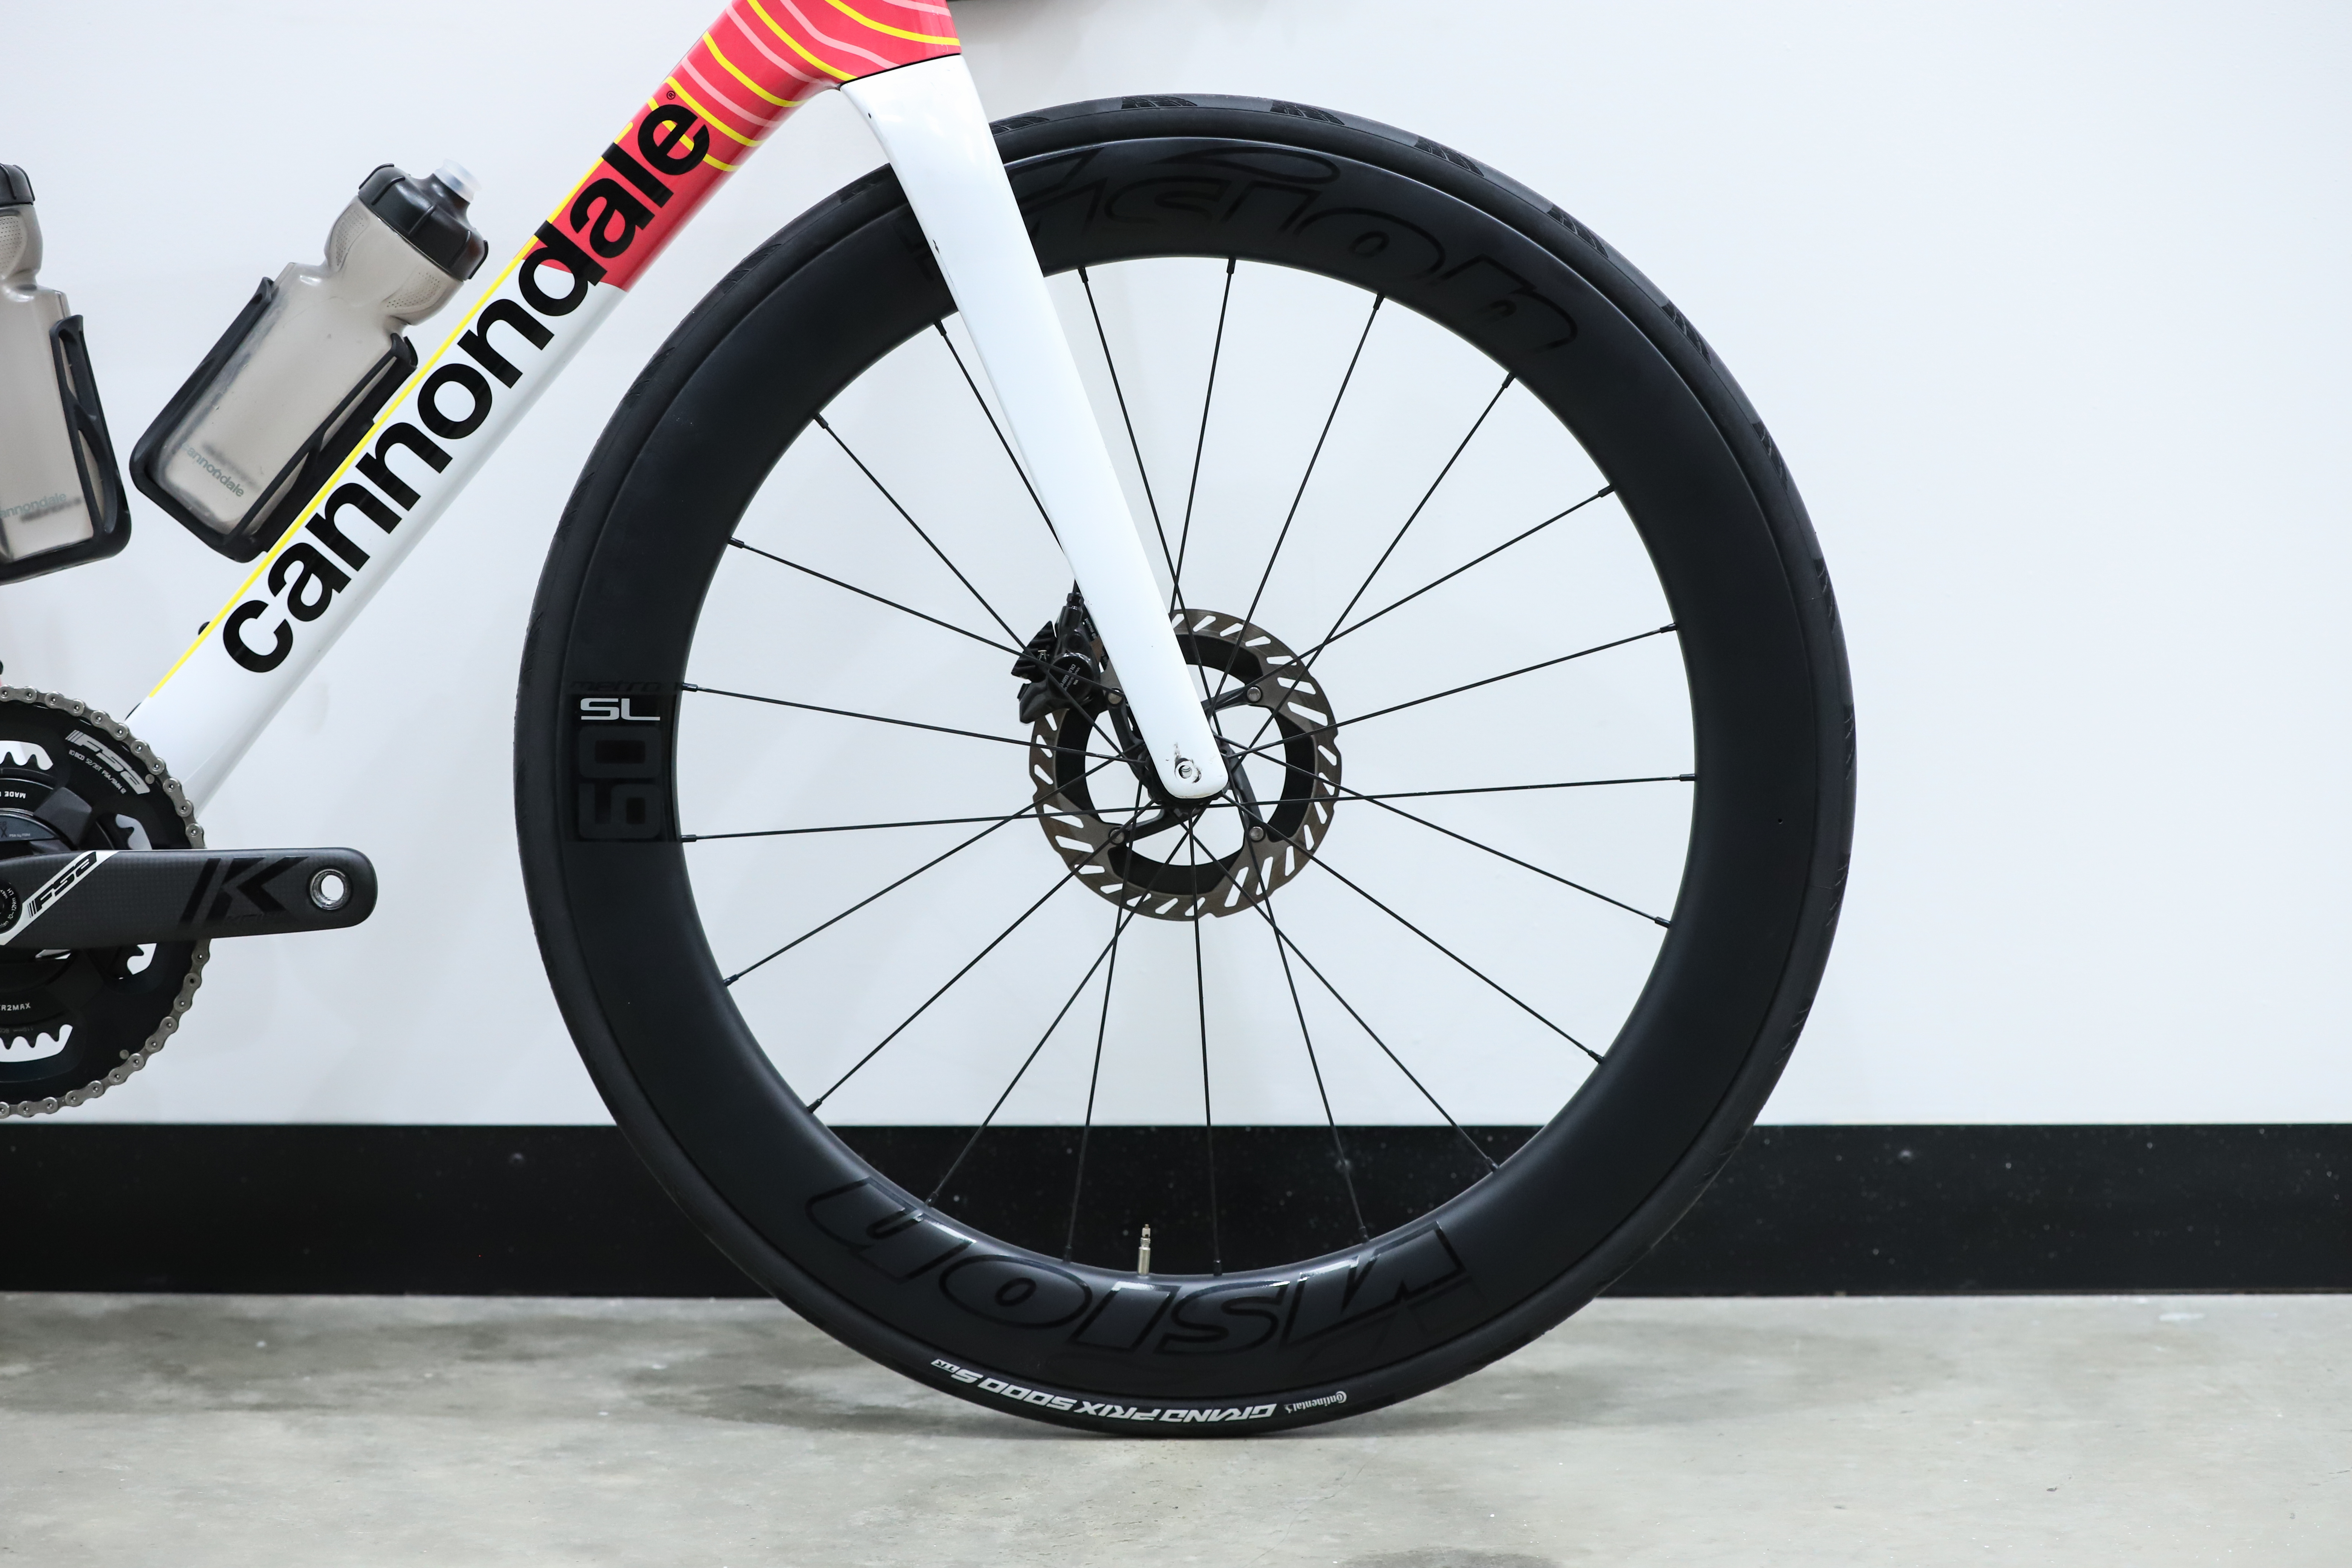
I know this page is all about scientifically proven data, but allow me this one opinion: The SuperSix Evo 4, in this colourway, is the best-looking bike of the bunch.
Unfortunately you can't actually buy the exact bike we tested. We got our hands on one of the team-edition Hi-Mod bikes with the Dura-Ace groupset.
The closest we could get as a consumer is buying the Lab71 model with SRAM Red, at an eyewatering £12,500.
Regardless, the SuperSix landed a fairly decent result given it's not even Cannondale's dedicated aero bike (that claim goes to the SystemSix). It came out 5th in our bike-only test, but with the margin of error, it can lay claim to 2nd place. That margin goes the other way too, though, so it could also be as low as 7th.
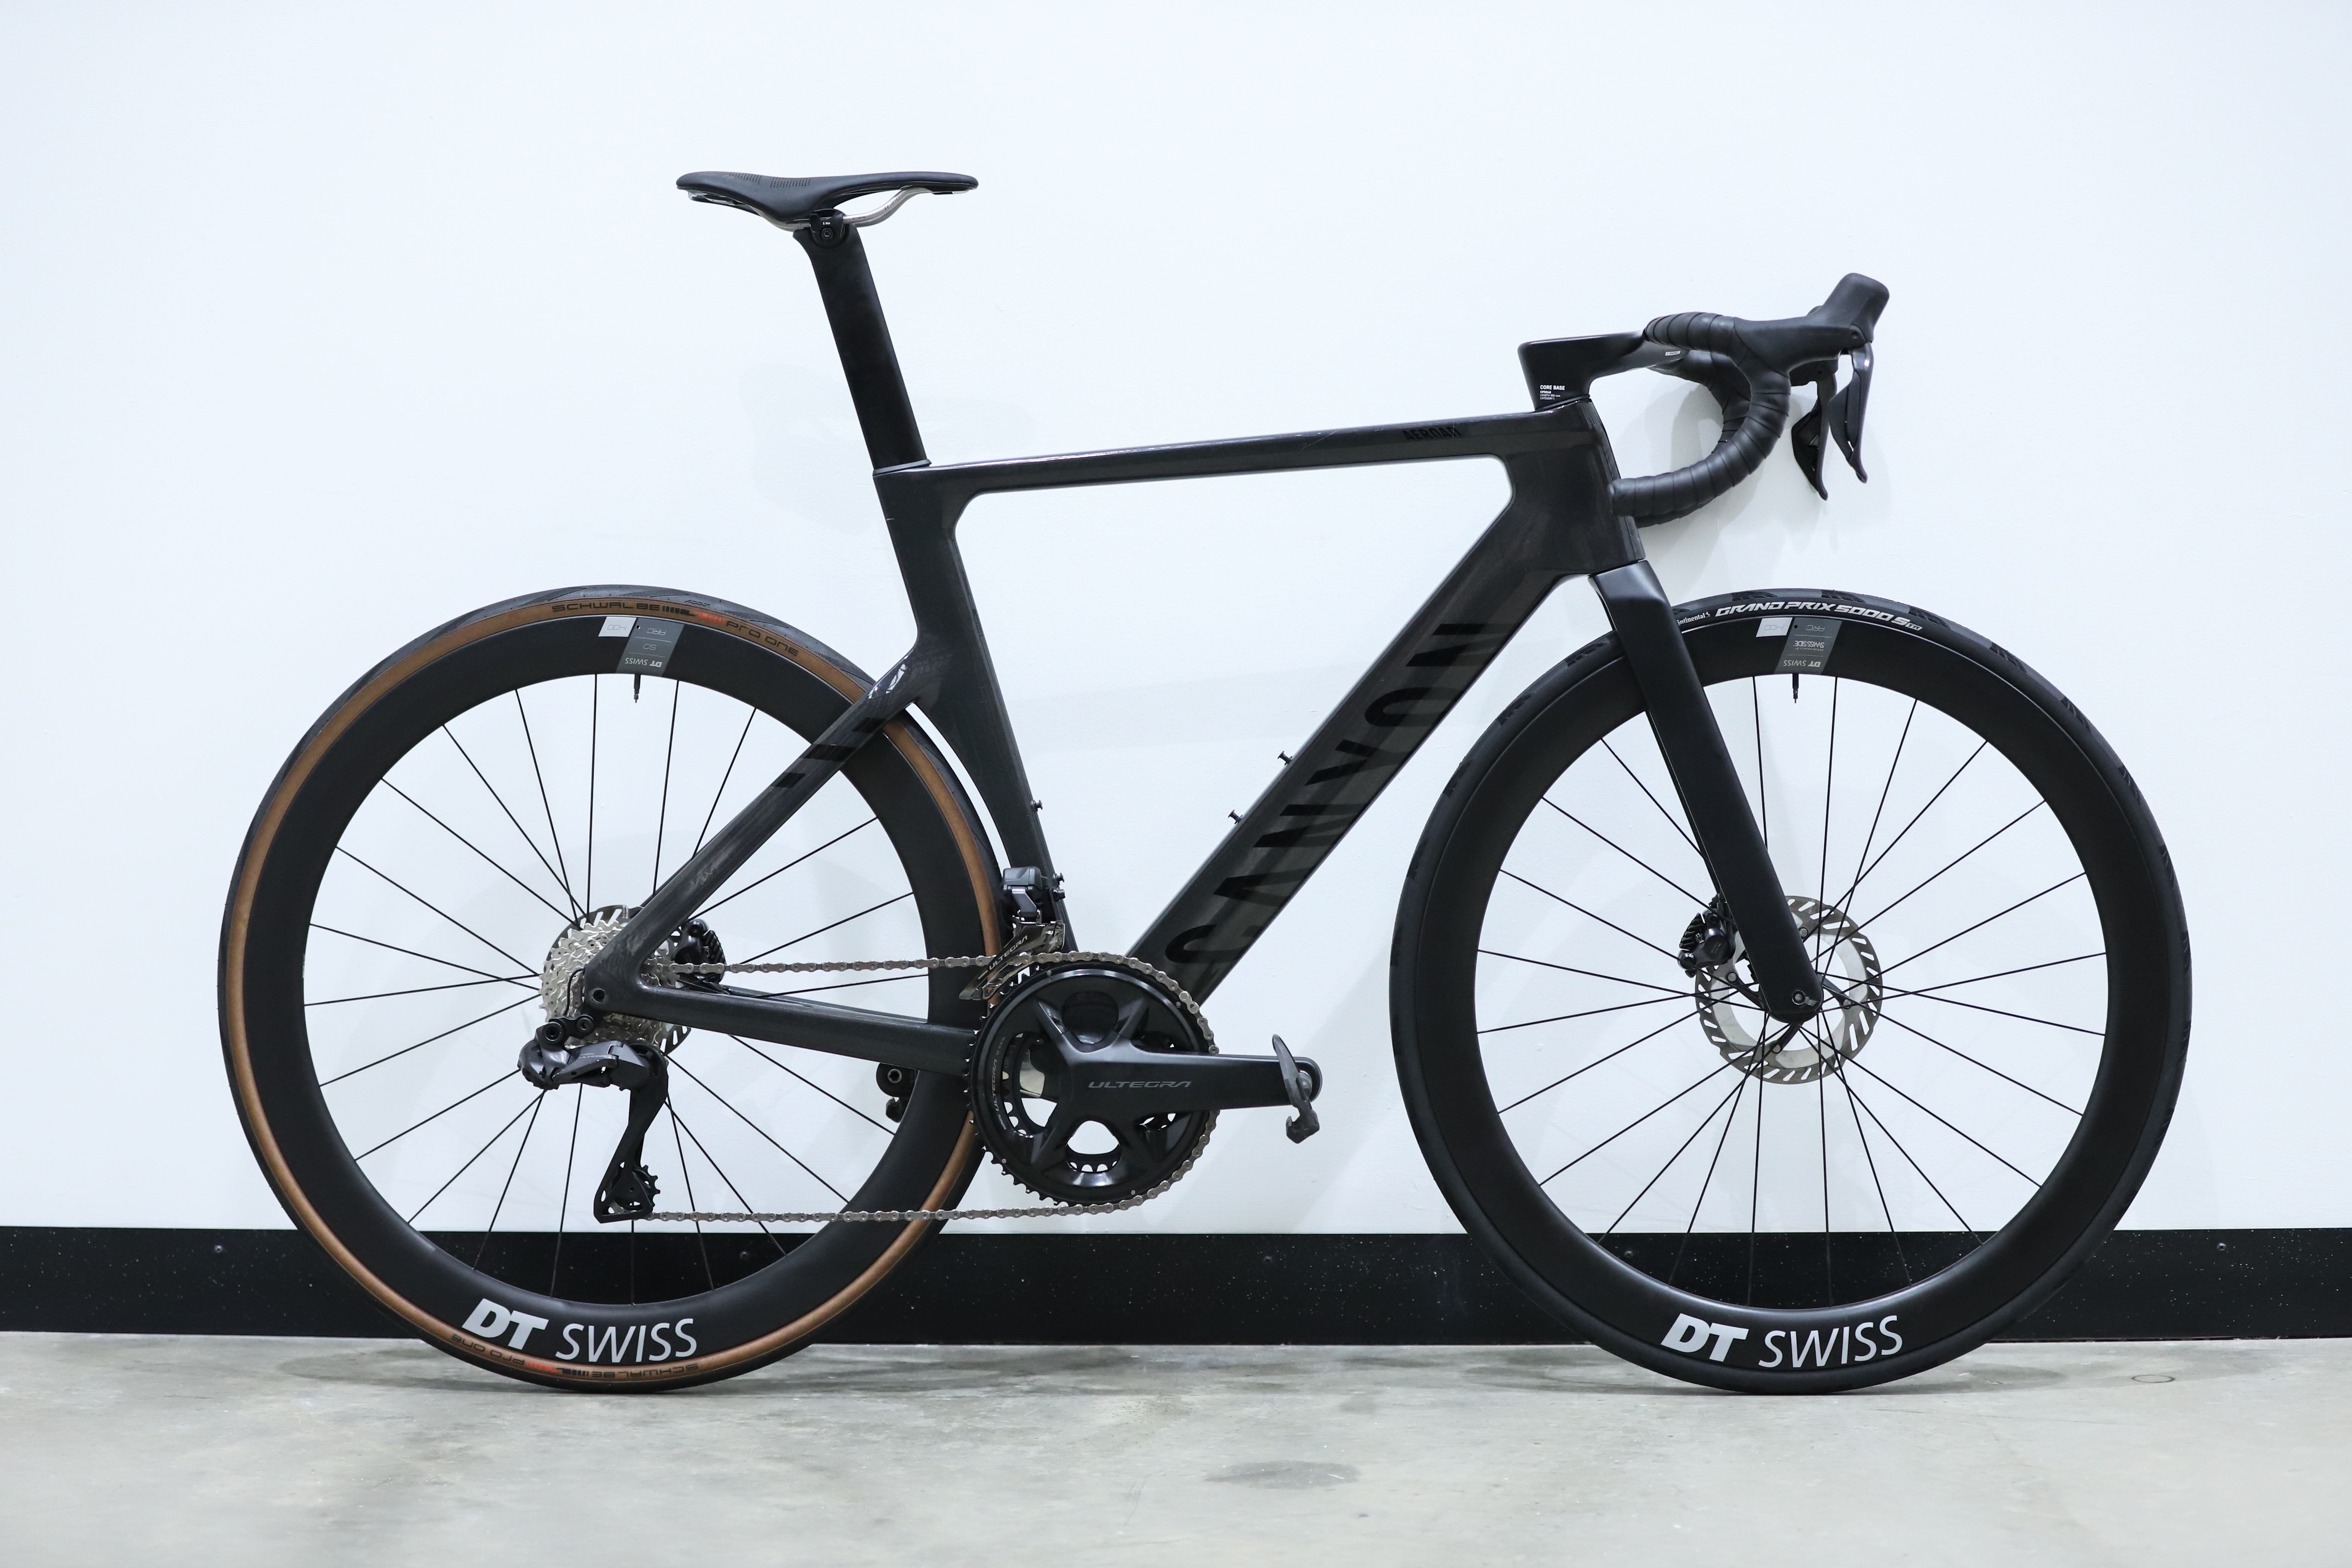
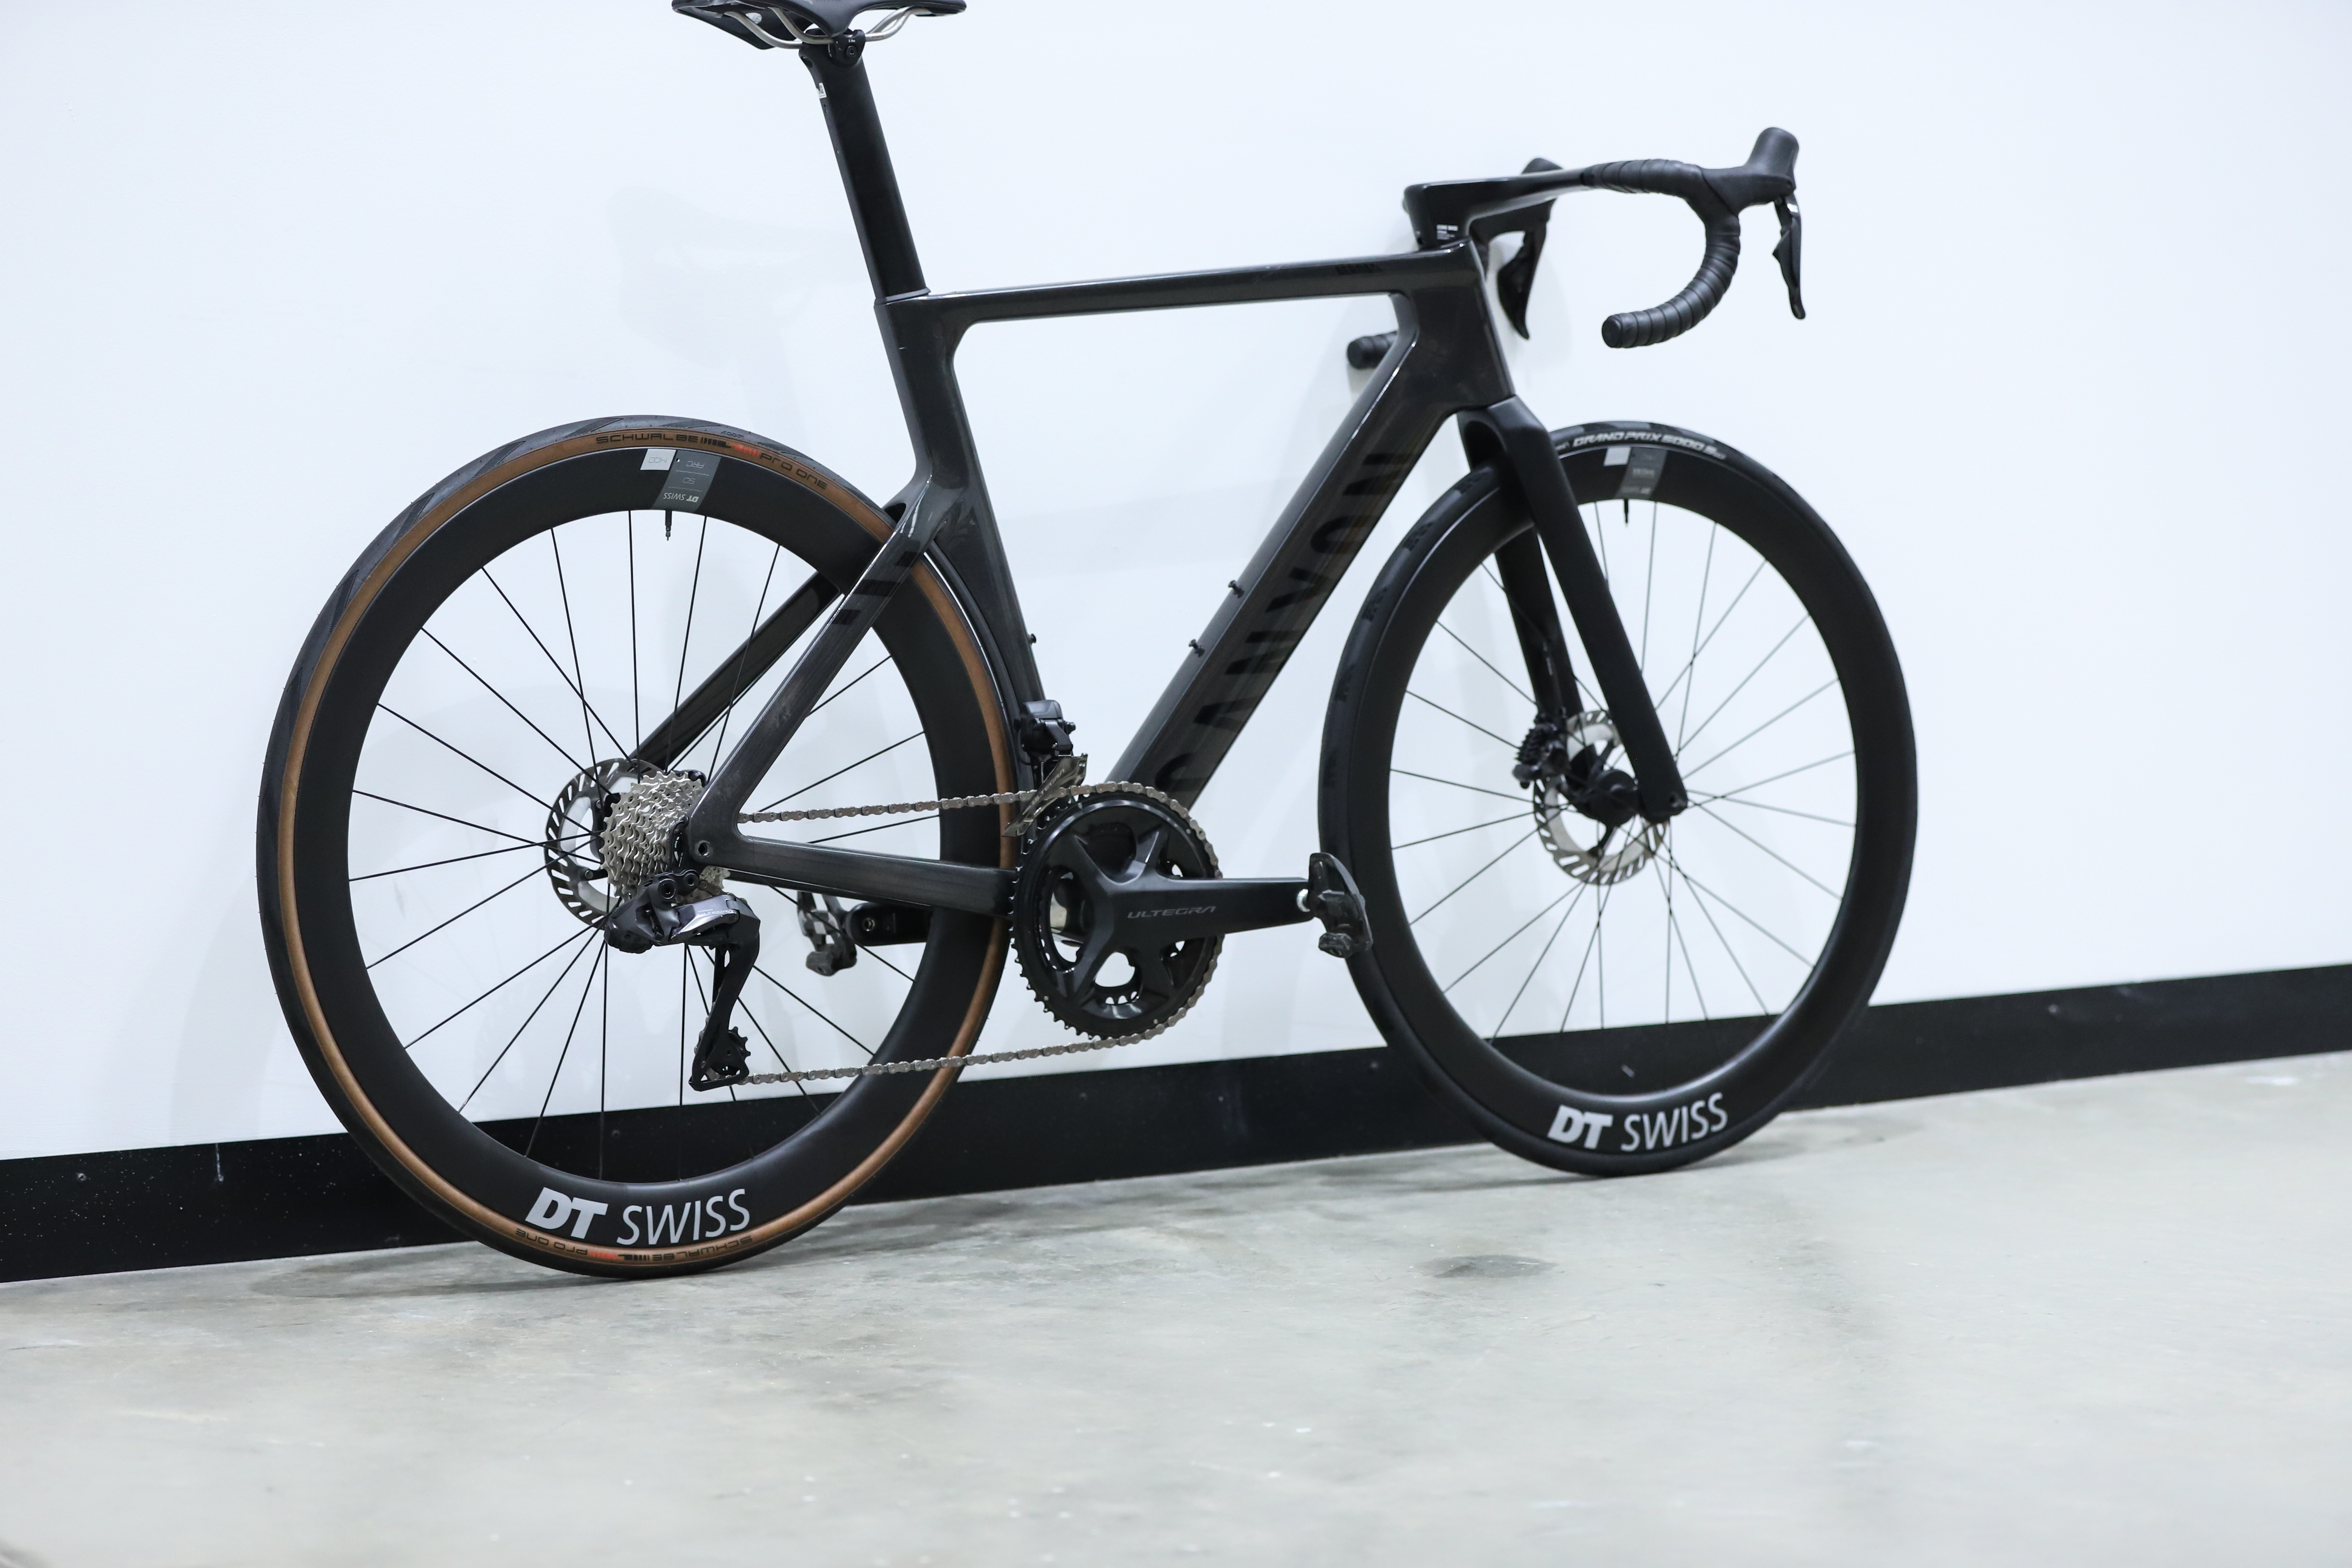
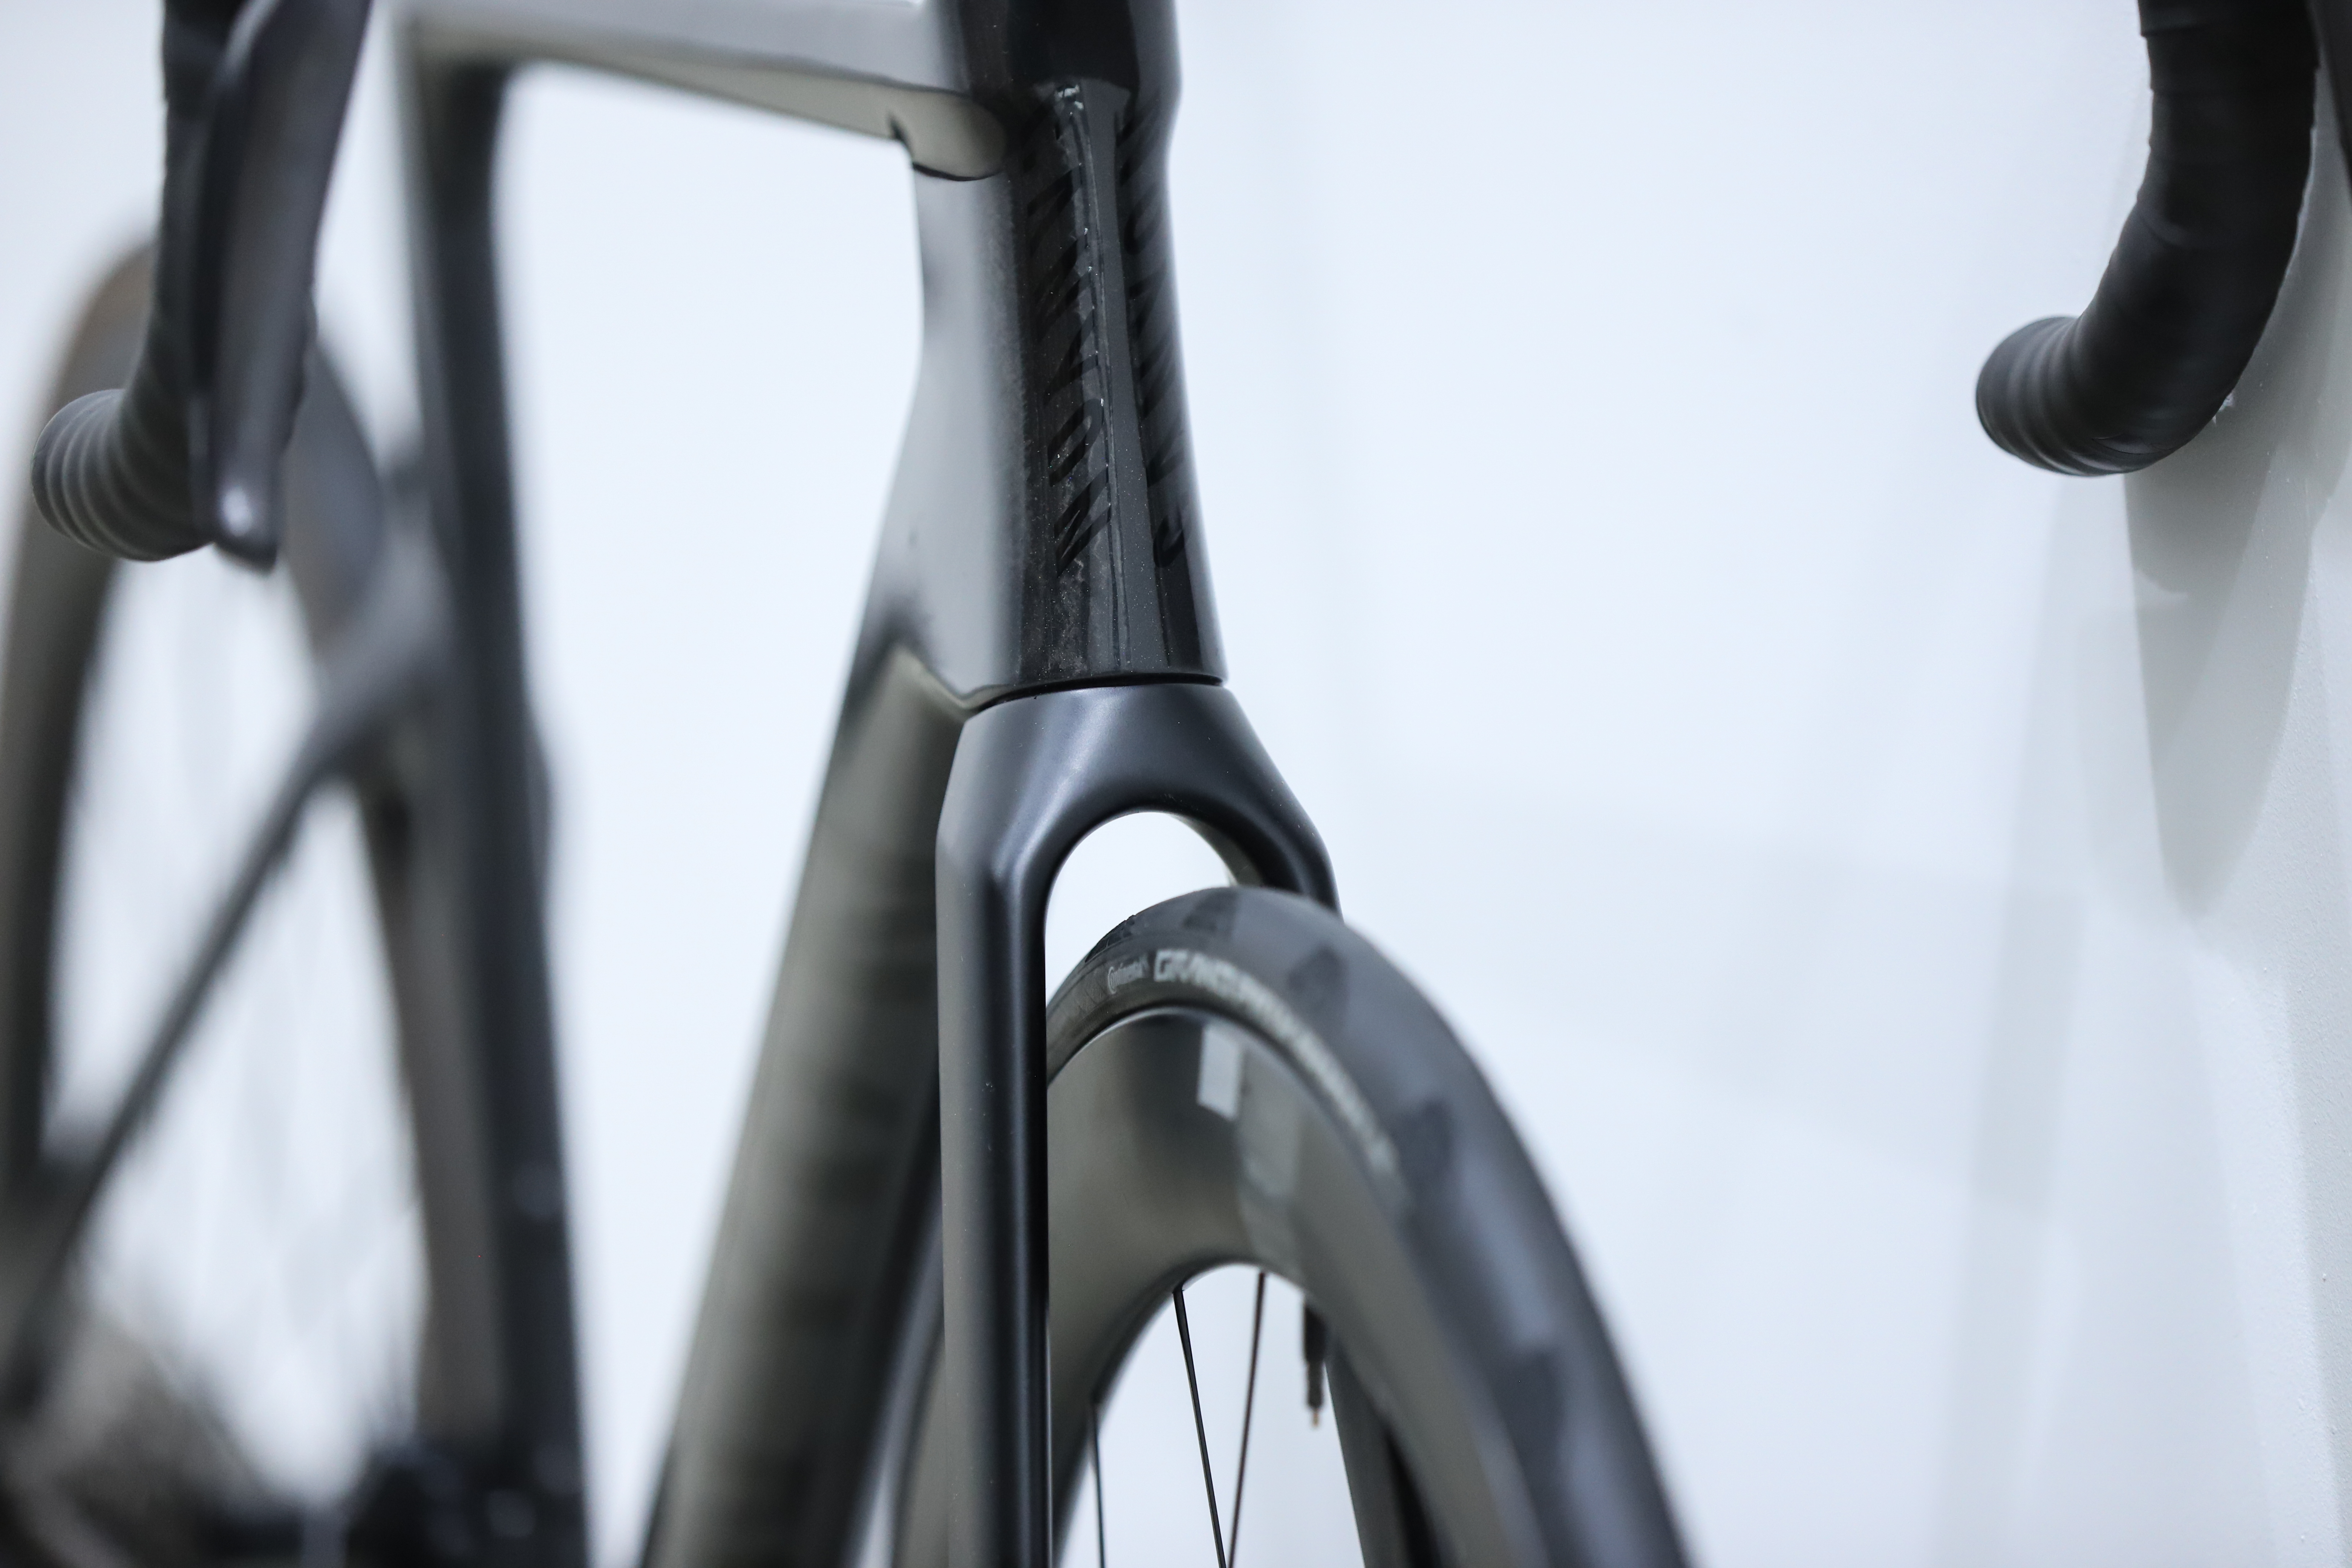
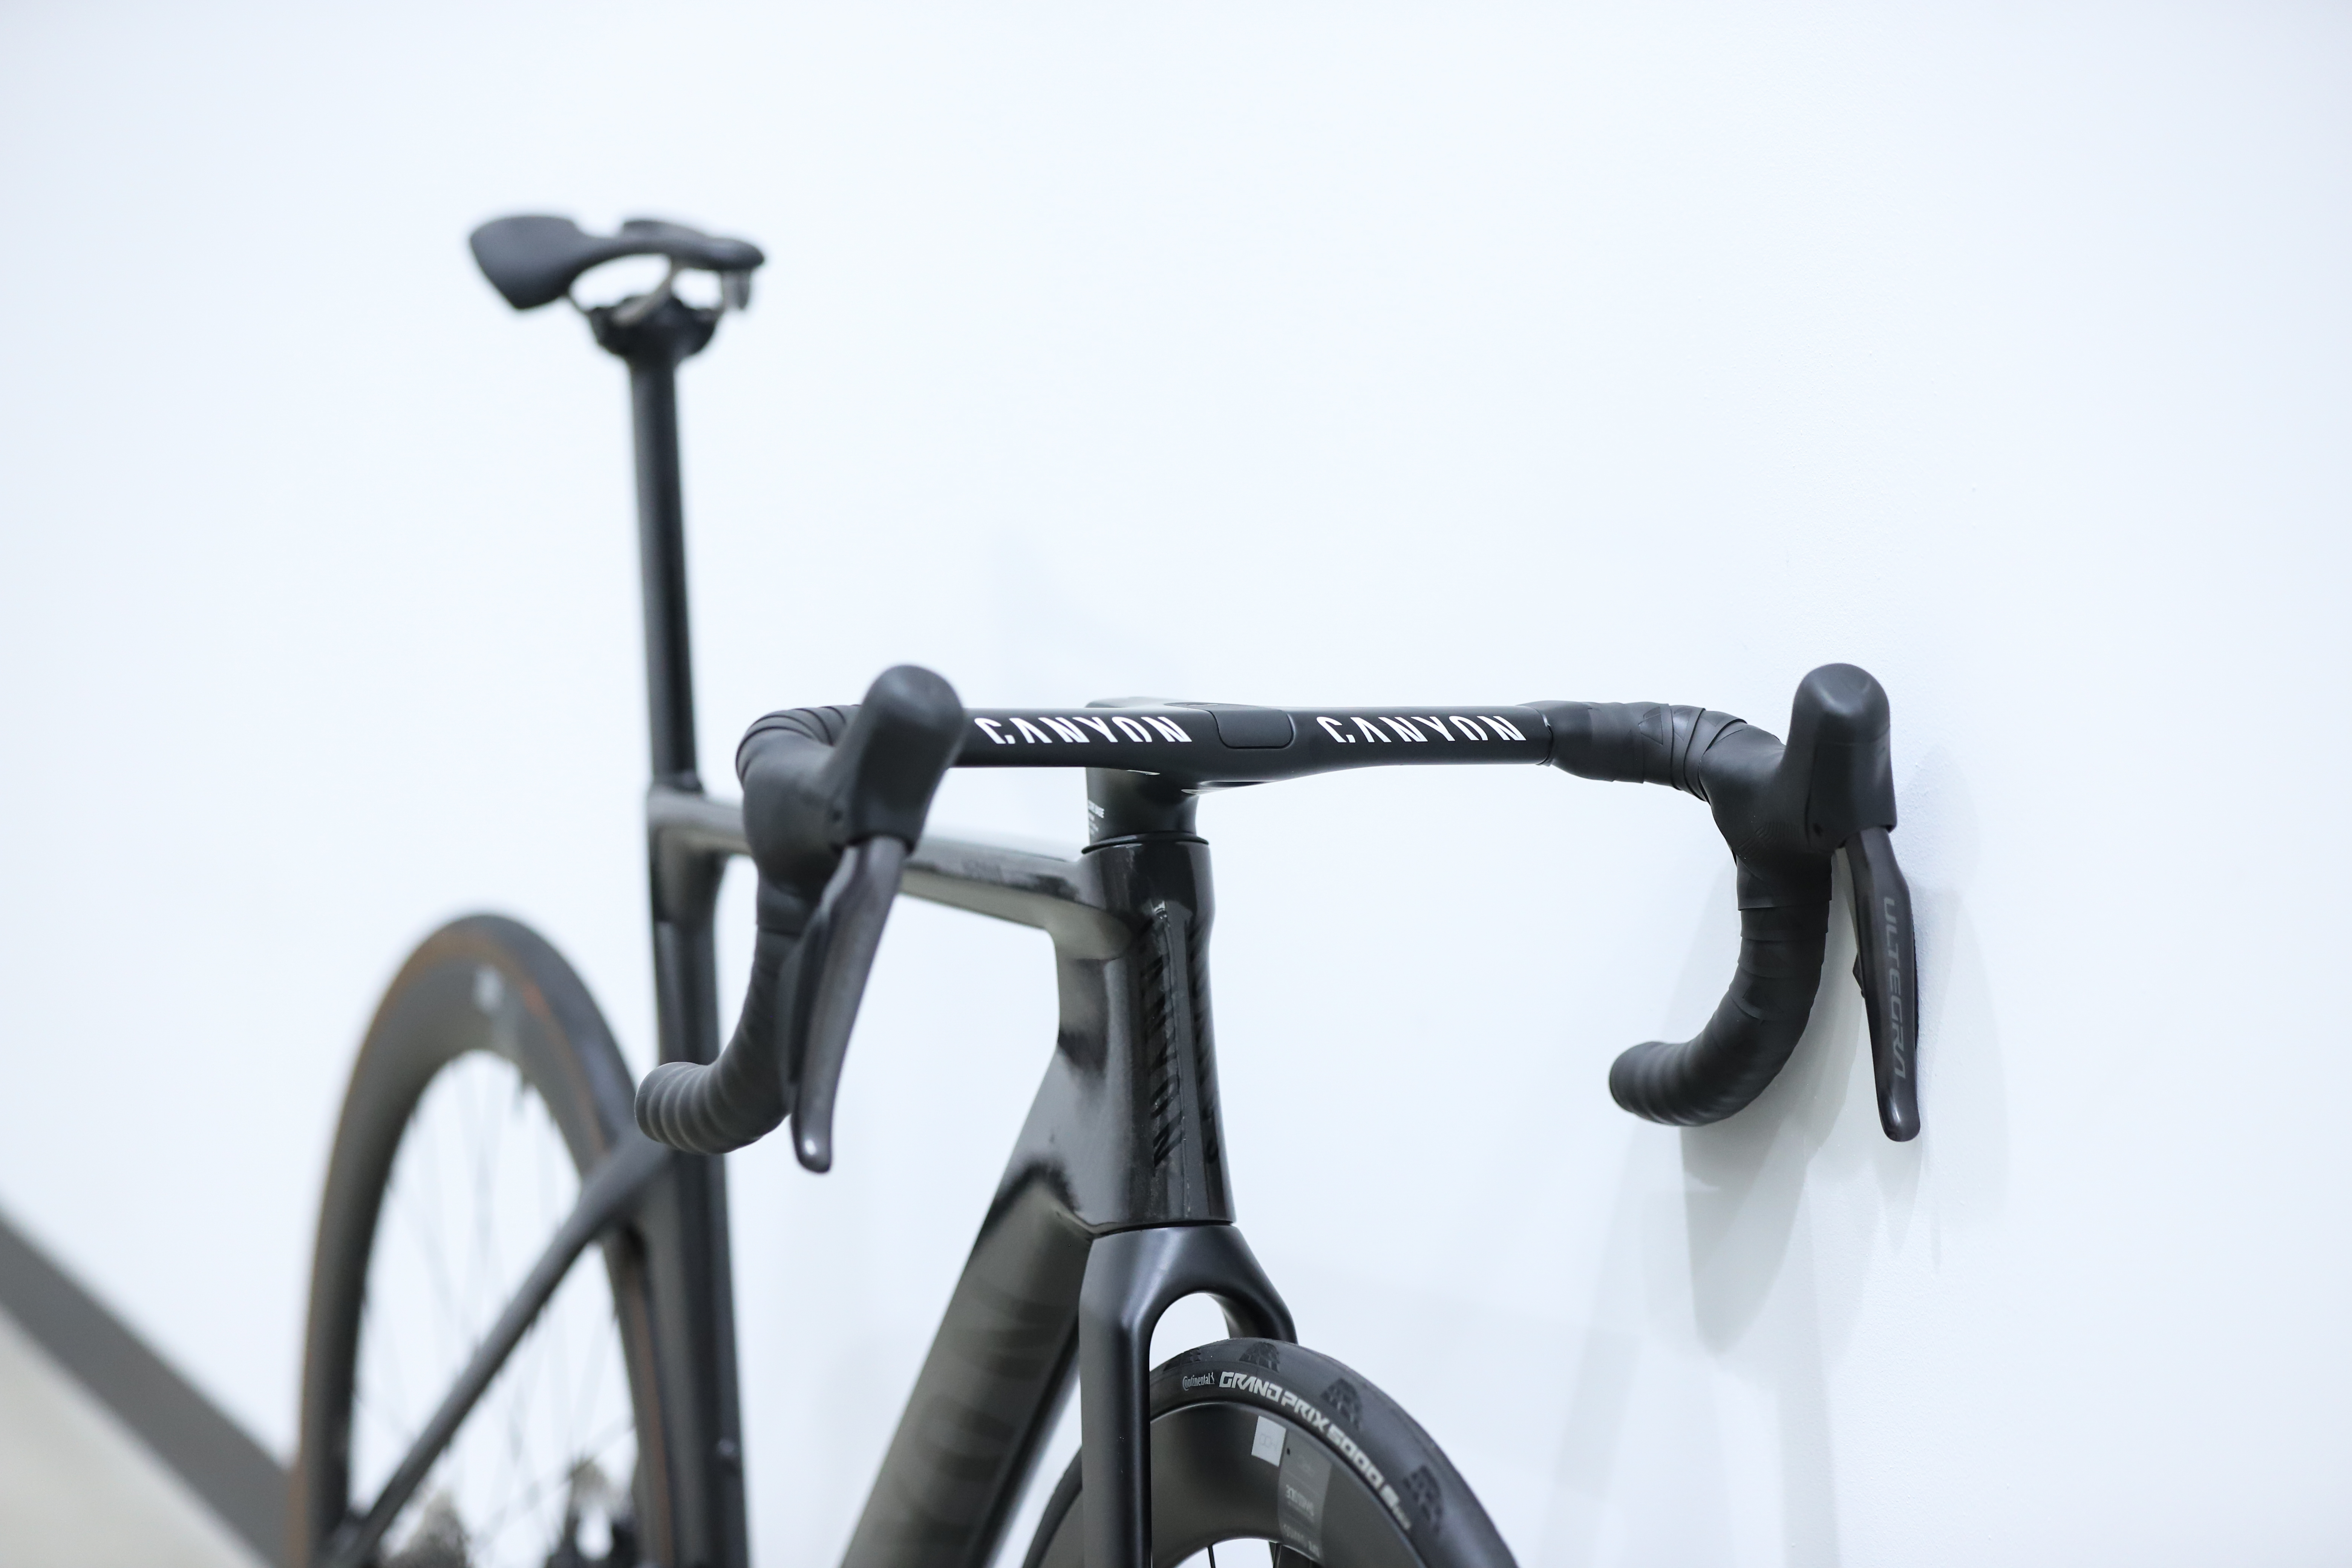
Canyon Aeroad CFR


Average CdA
0.3428
Watts saved at 40km/h
22.54
Time saved over 40km at 250w
00:01:37
Average CdA
0.0904
Watts saved at 40km/h
38.31
Time saved over 40km at 250w
00:05:57
At the launch of this latest Aeroad, Canyon found it was faster than the Tarmac SL8 on average, and faster than the Cervélo S5 at higher yaw, with the Cervélo edging slightly ahead at zero yaw. Our raw data agrees, but due to our error margin, we cannot guarantee that it wasn't simply a result of a change in conditions throughout the day.
The Aeroad CFR offers excellent value when compared to the rest of the bikes here. It might be a few hundred pounds more than the Van Rysel, but with its width-adjustable handlebars and height-adjustable cockpit (that doesn't need you to cut the steerer tube in the process), it will save you from possibly needing to buy a separate cockpit once you've had a bike fit.
It is Canyon's dedicated aero bike, sitting alongside the more lightweight Ultimate CFR. Despite that, it weighs about the same as the Look Blade 795 RS, or around 740 grams less than the Force-AXS equipped Cervélo. Like Giant's Propel/TCR combo, we also predict these two will merge in a few years.
Also like Giant, Canyon designs the bike with a pedalling dummy it calls Ferdie, and as such, you should bear that in mind when reading the bike-only results shown here.
Cervélo S5
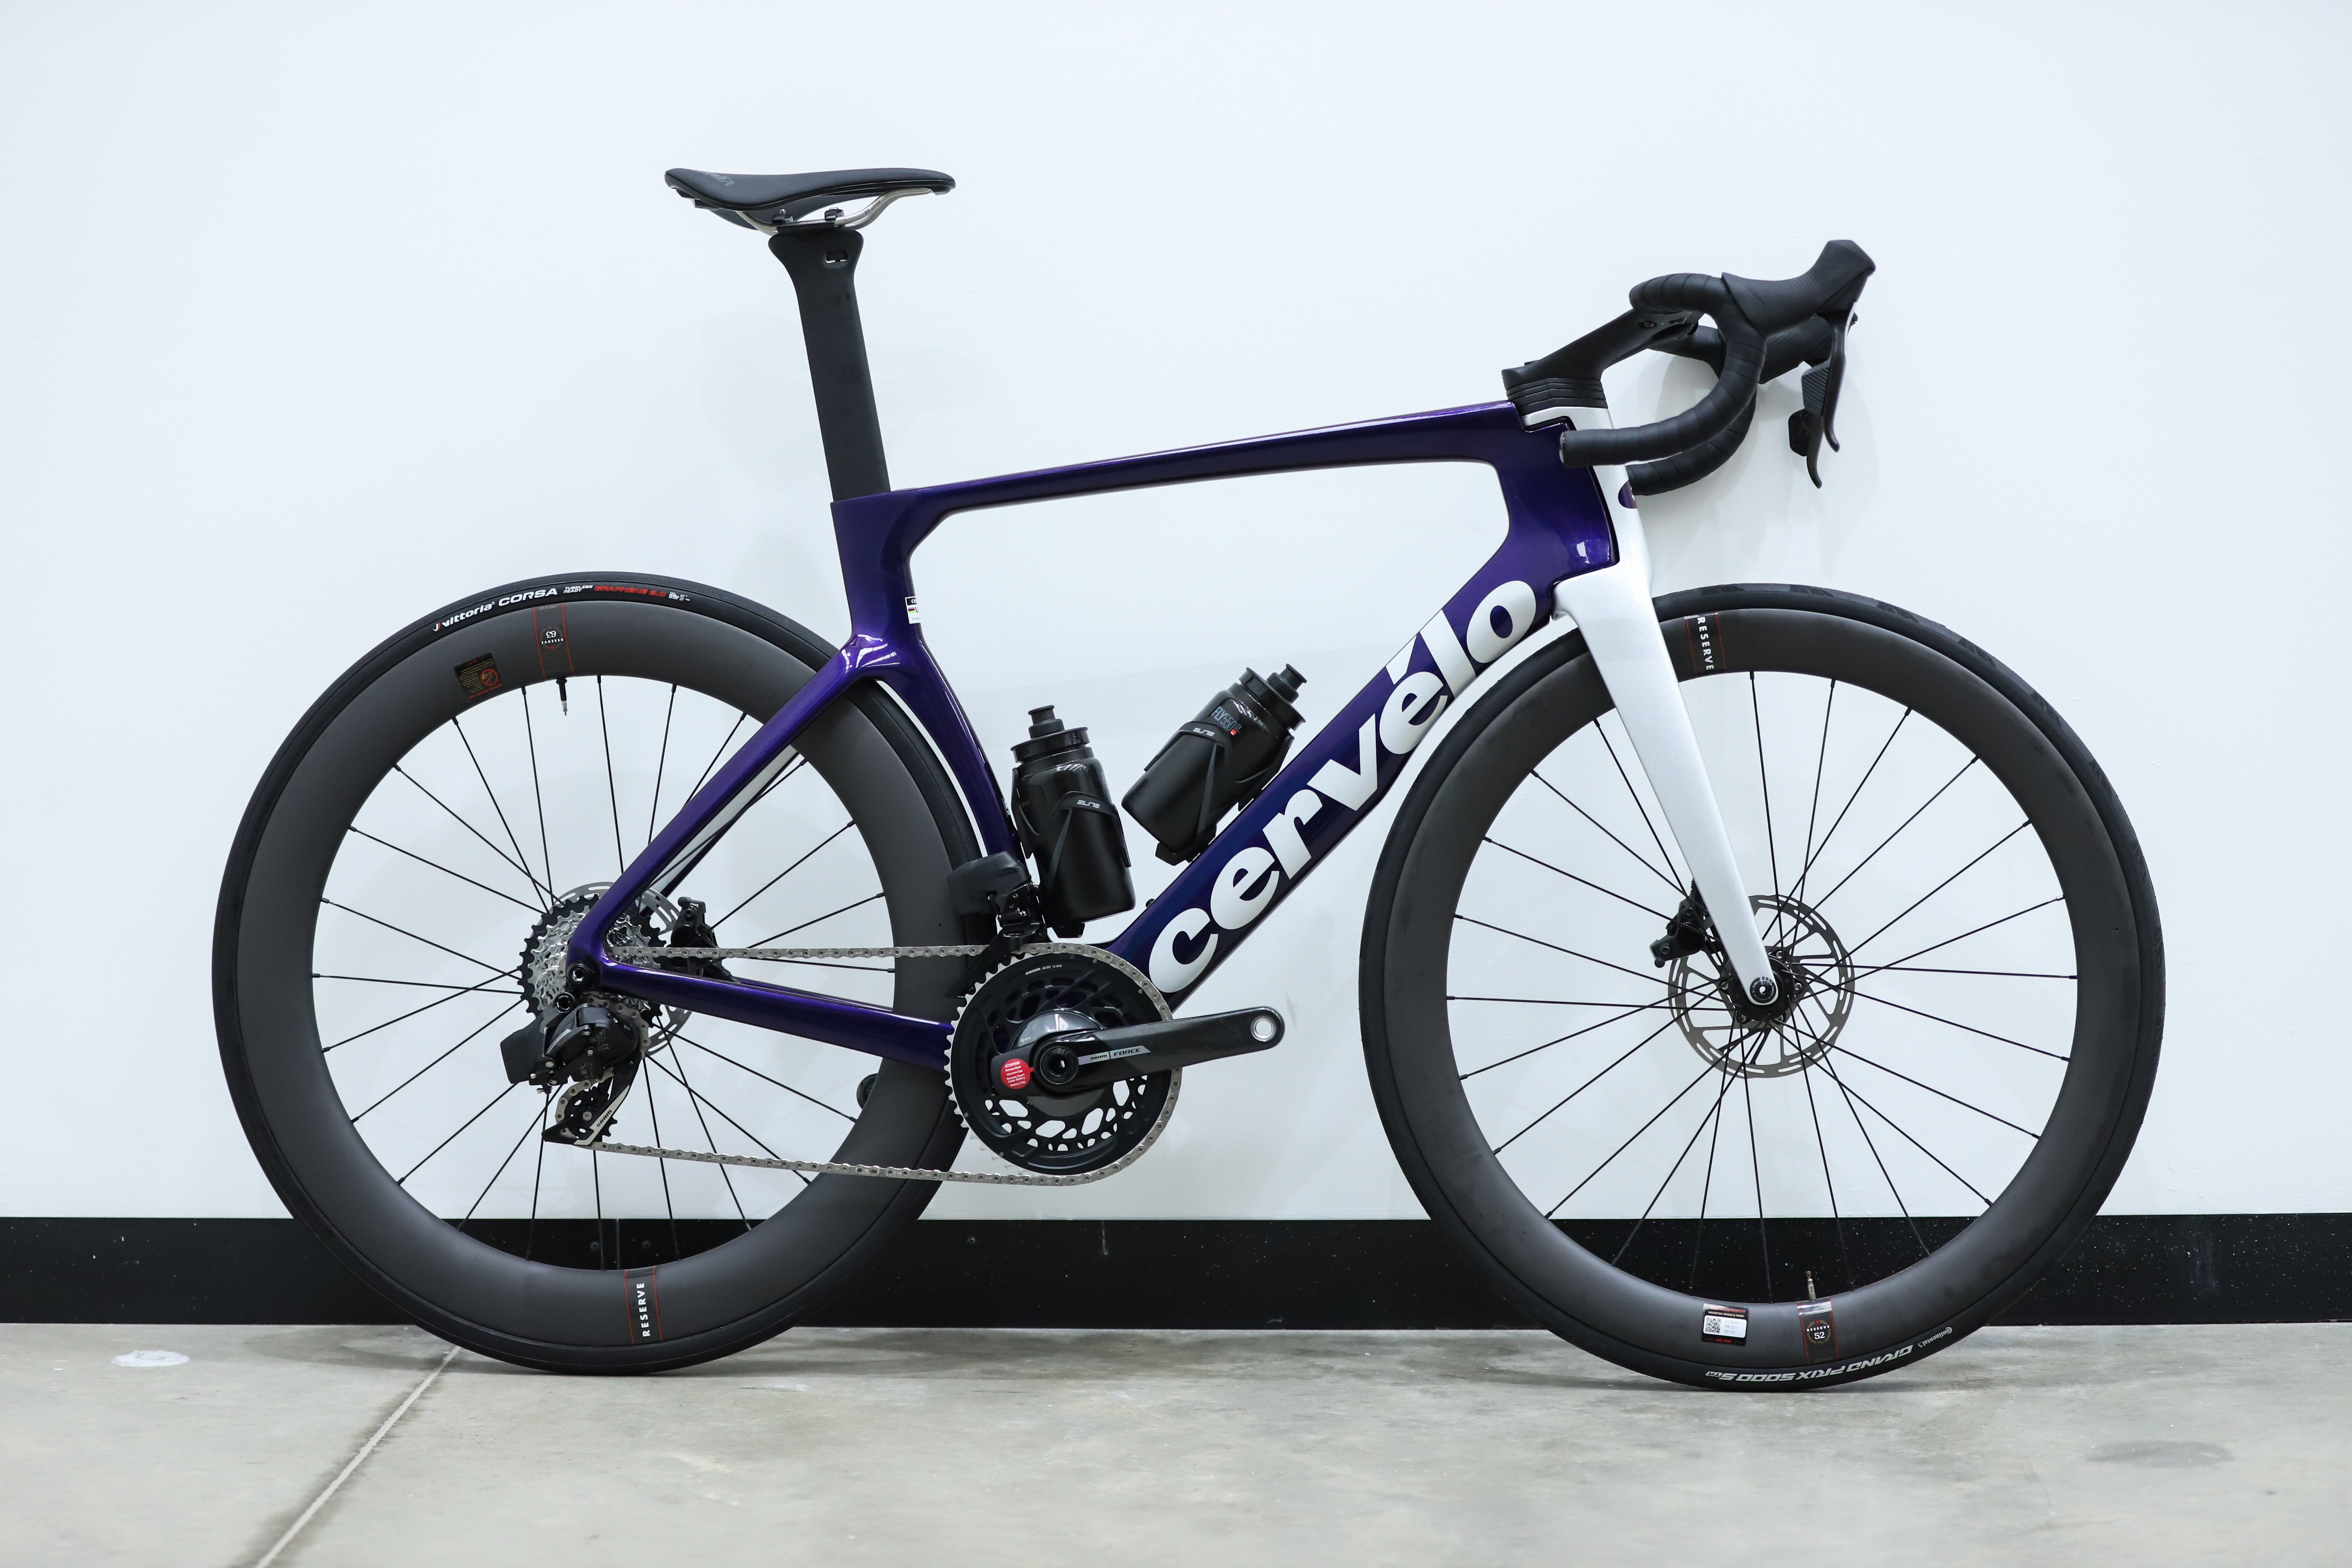


Average CdA
0.3418
Watts saved at 40km/h
23.38
Time saved over 40km at 250w
00:01:41
Average CdA
0.0900
Watts saved at 40km/h
38.66
Time saved over 40km at 250w
00:06:01
The Cervélo S5 is unashamedly a dedicated aero bike, with its v-shaped cockpit, deep tubes and rear-wheel-wrapping seat tube. As a result, it's no featherweight.
That's a slightly unfair assessment given the bike we have here is Force-AXS equipped, rather than Red, but it still tips the scales at 340 grams more than the similarly-specced Madone.
Found beneath the Visma-Lease a Bike team, the S5 has crossed many a finish line in first place, although the team's two-time Tour de France winner, Jonas Vingegaard, often reaches for the lighter-weight R5 on hillier days.
In our bike-only test, the S5 is one of just three bikes that can lay claim to 1st place, once our margin of error has been factored in. However, given that it goes both ways, it could also drop to 7th.
Scott Foil RC Pro
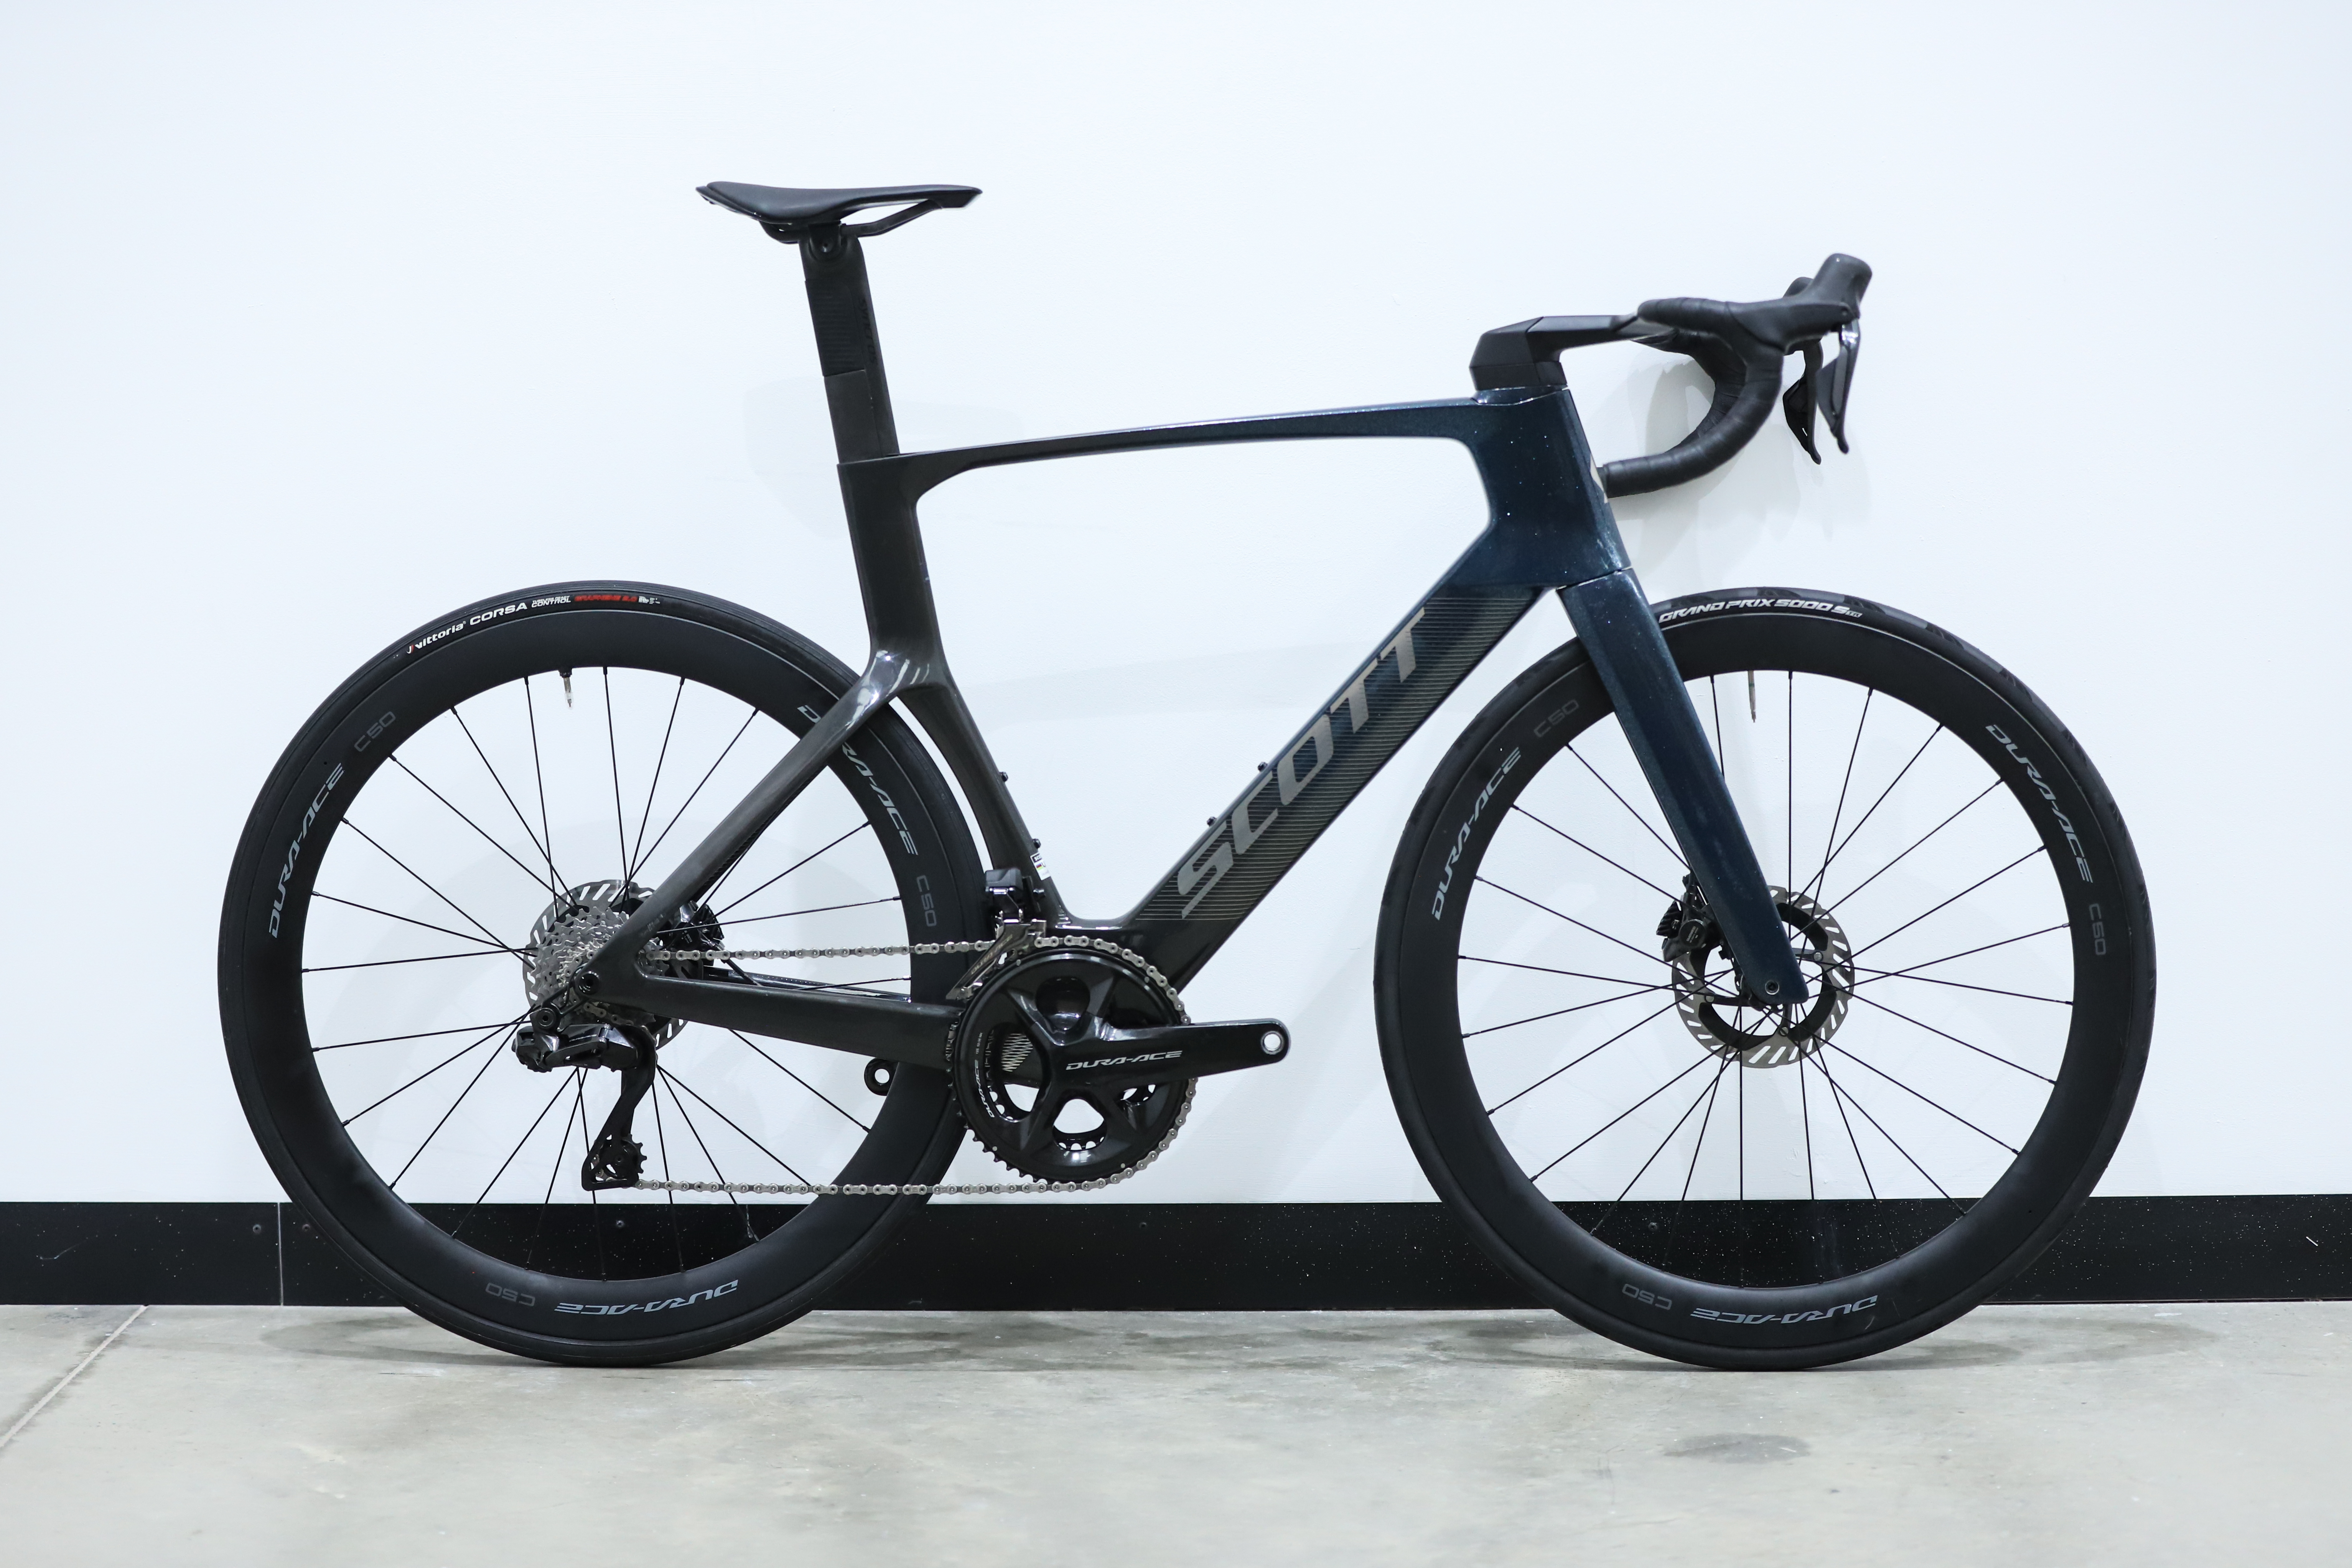


Average CdA
0.3441
Watts saved at 40km/h
21.48
Time saved over 40km at 250w
00:01:33
Average CdA
0.0897
Watts saved at 40km/h
38.90
Time saved over 40km at 250w
00:06:03
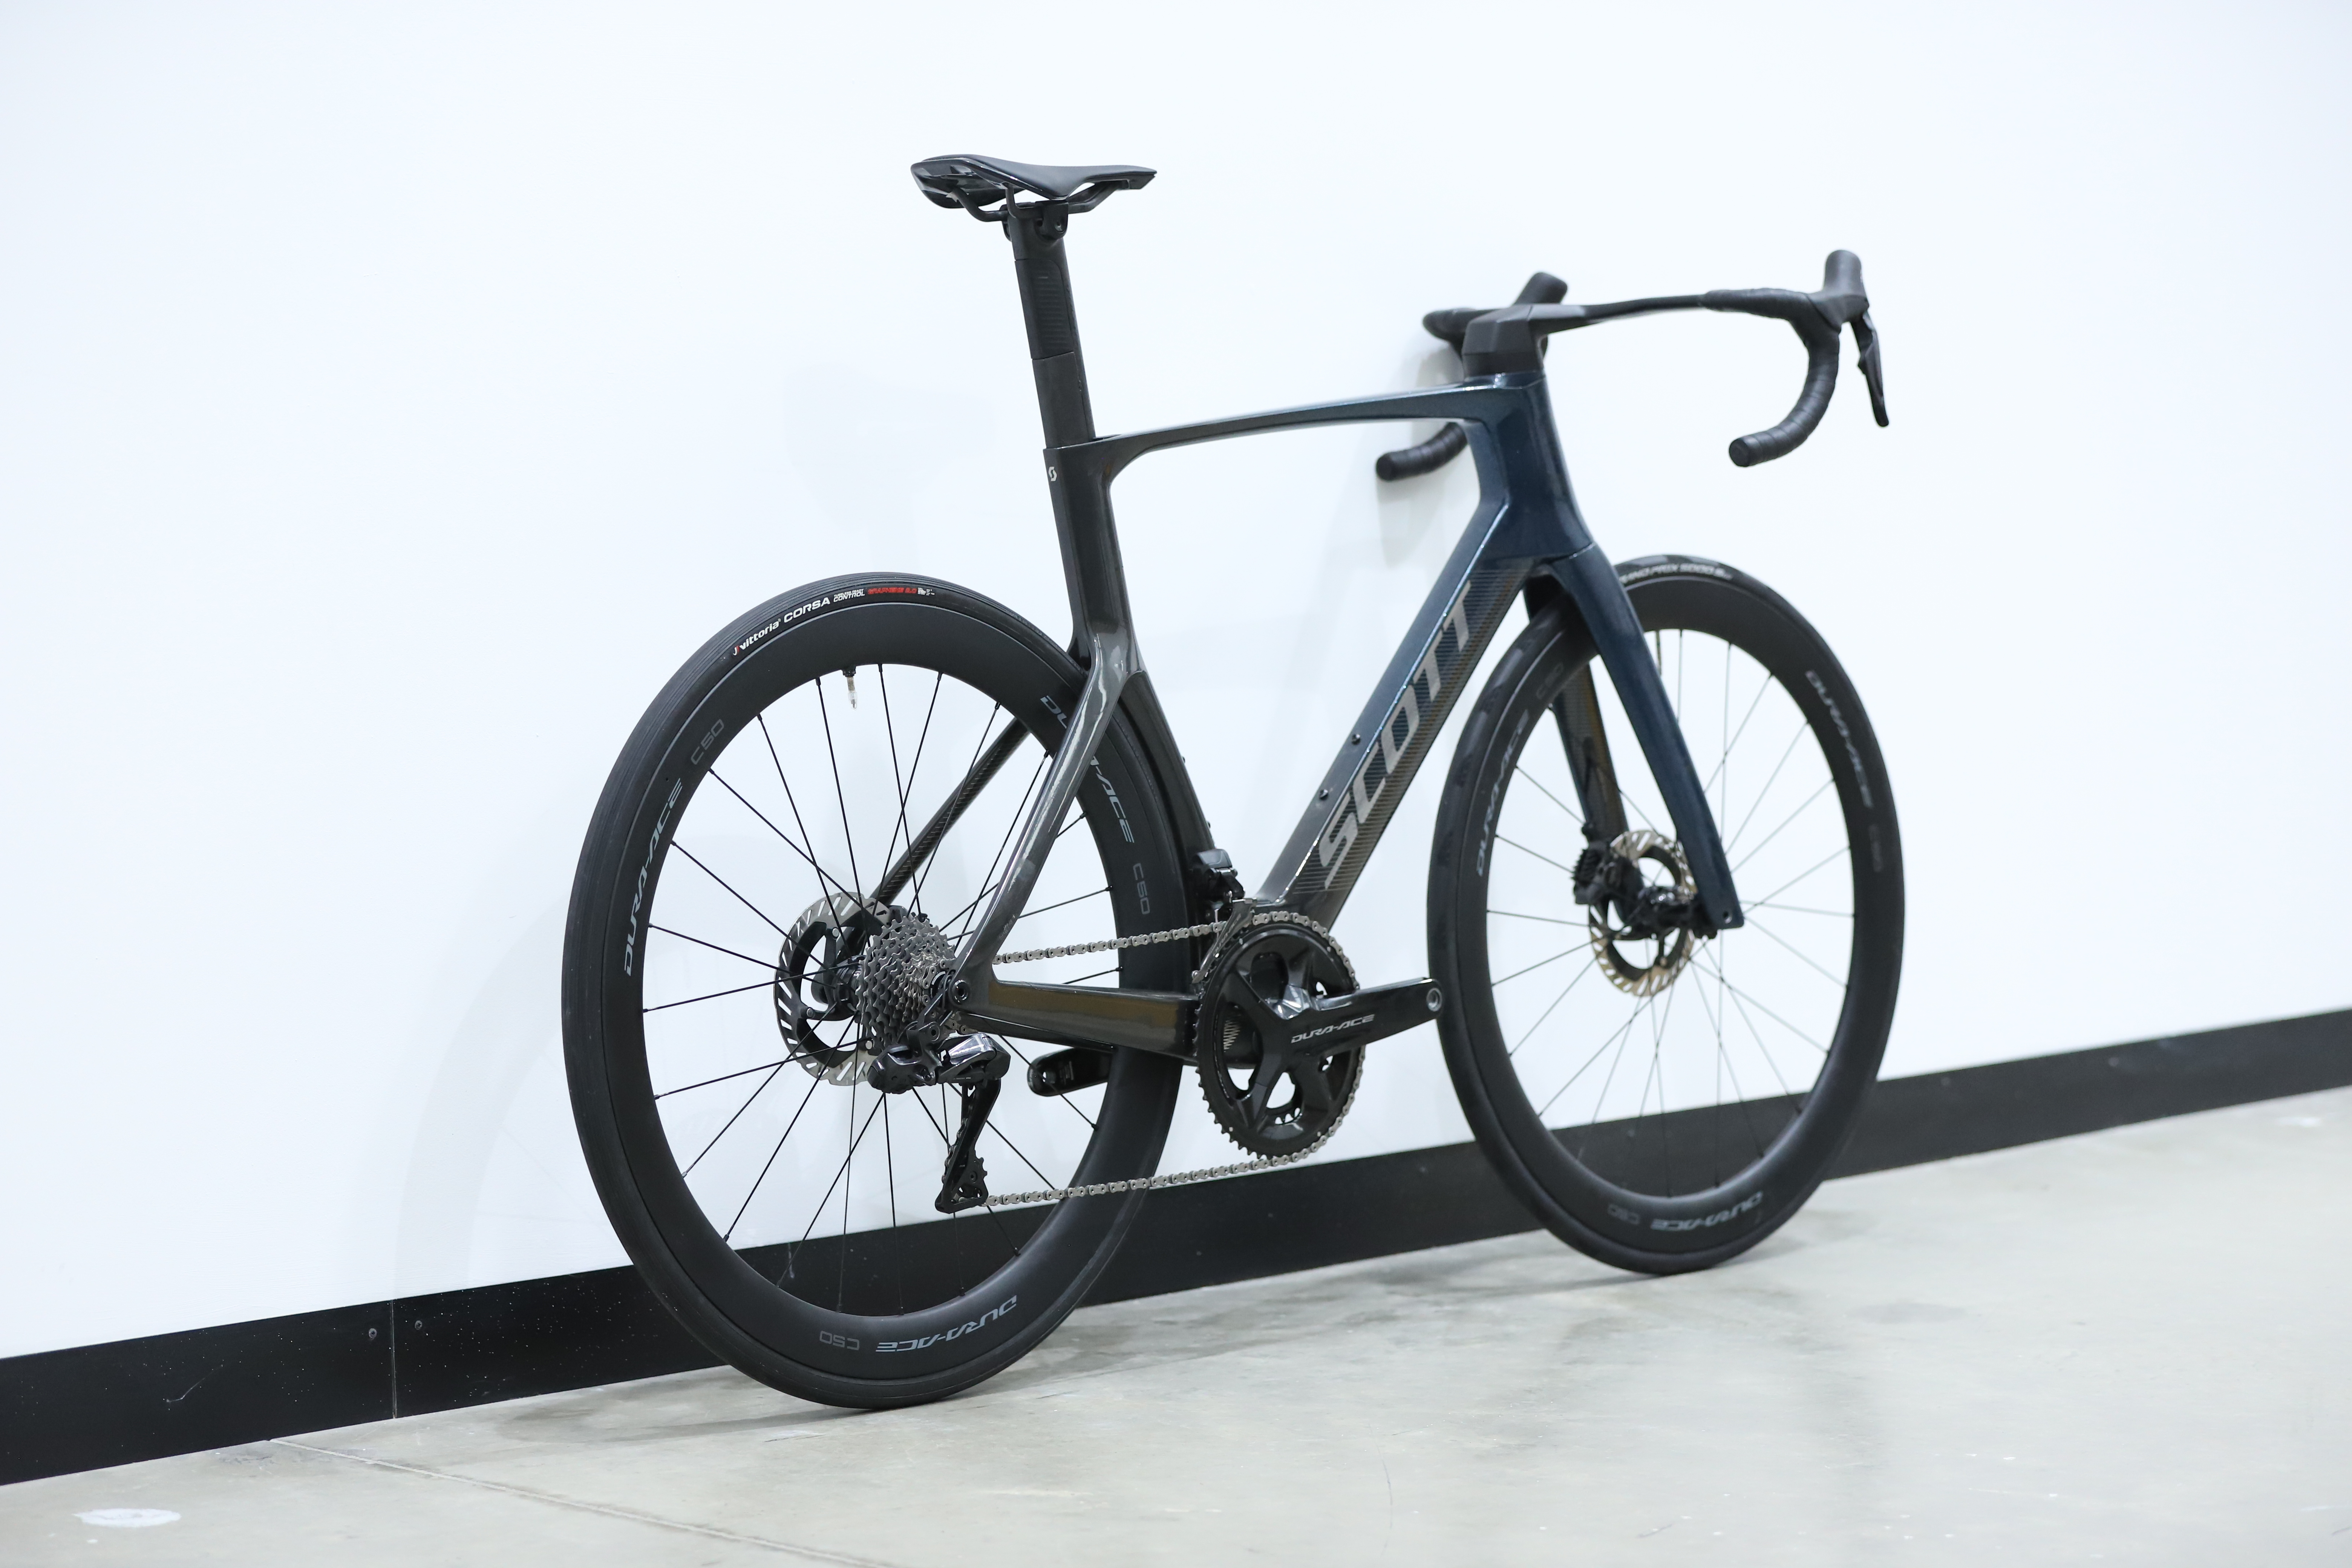
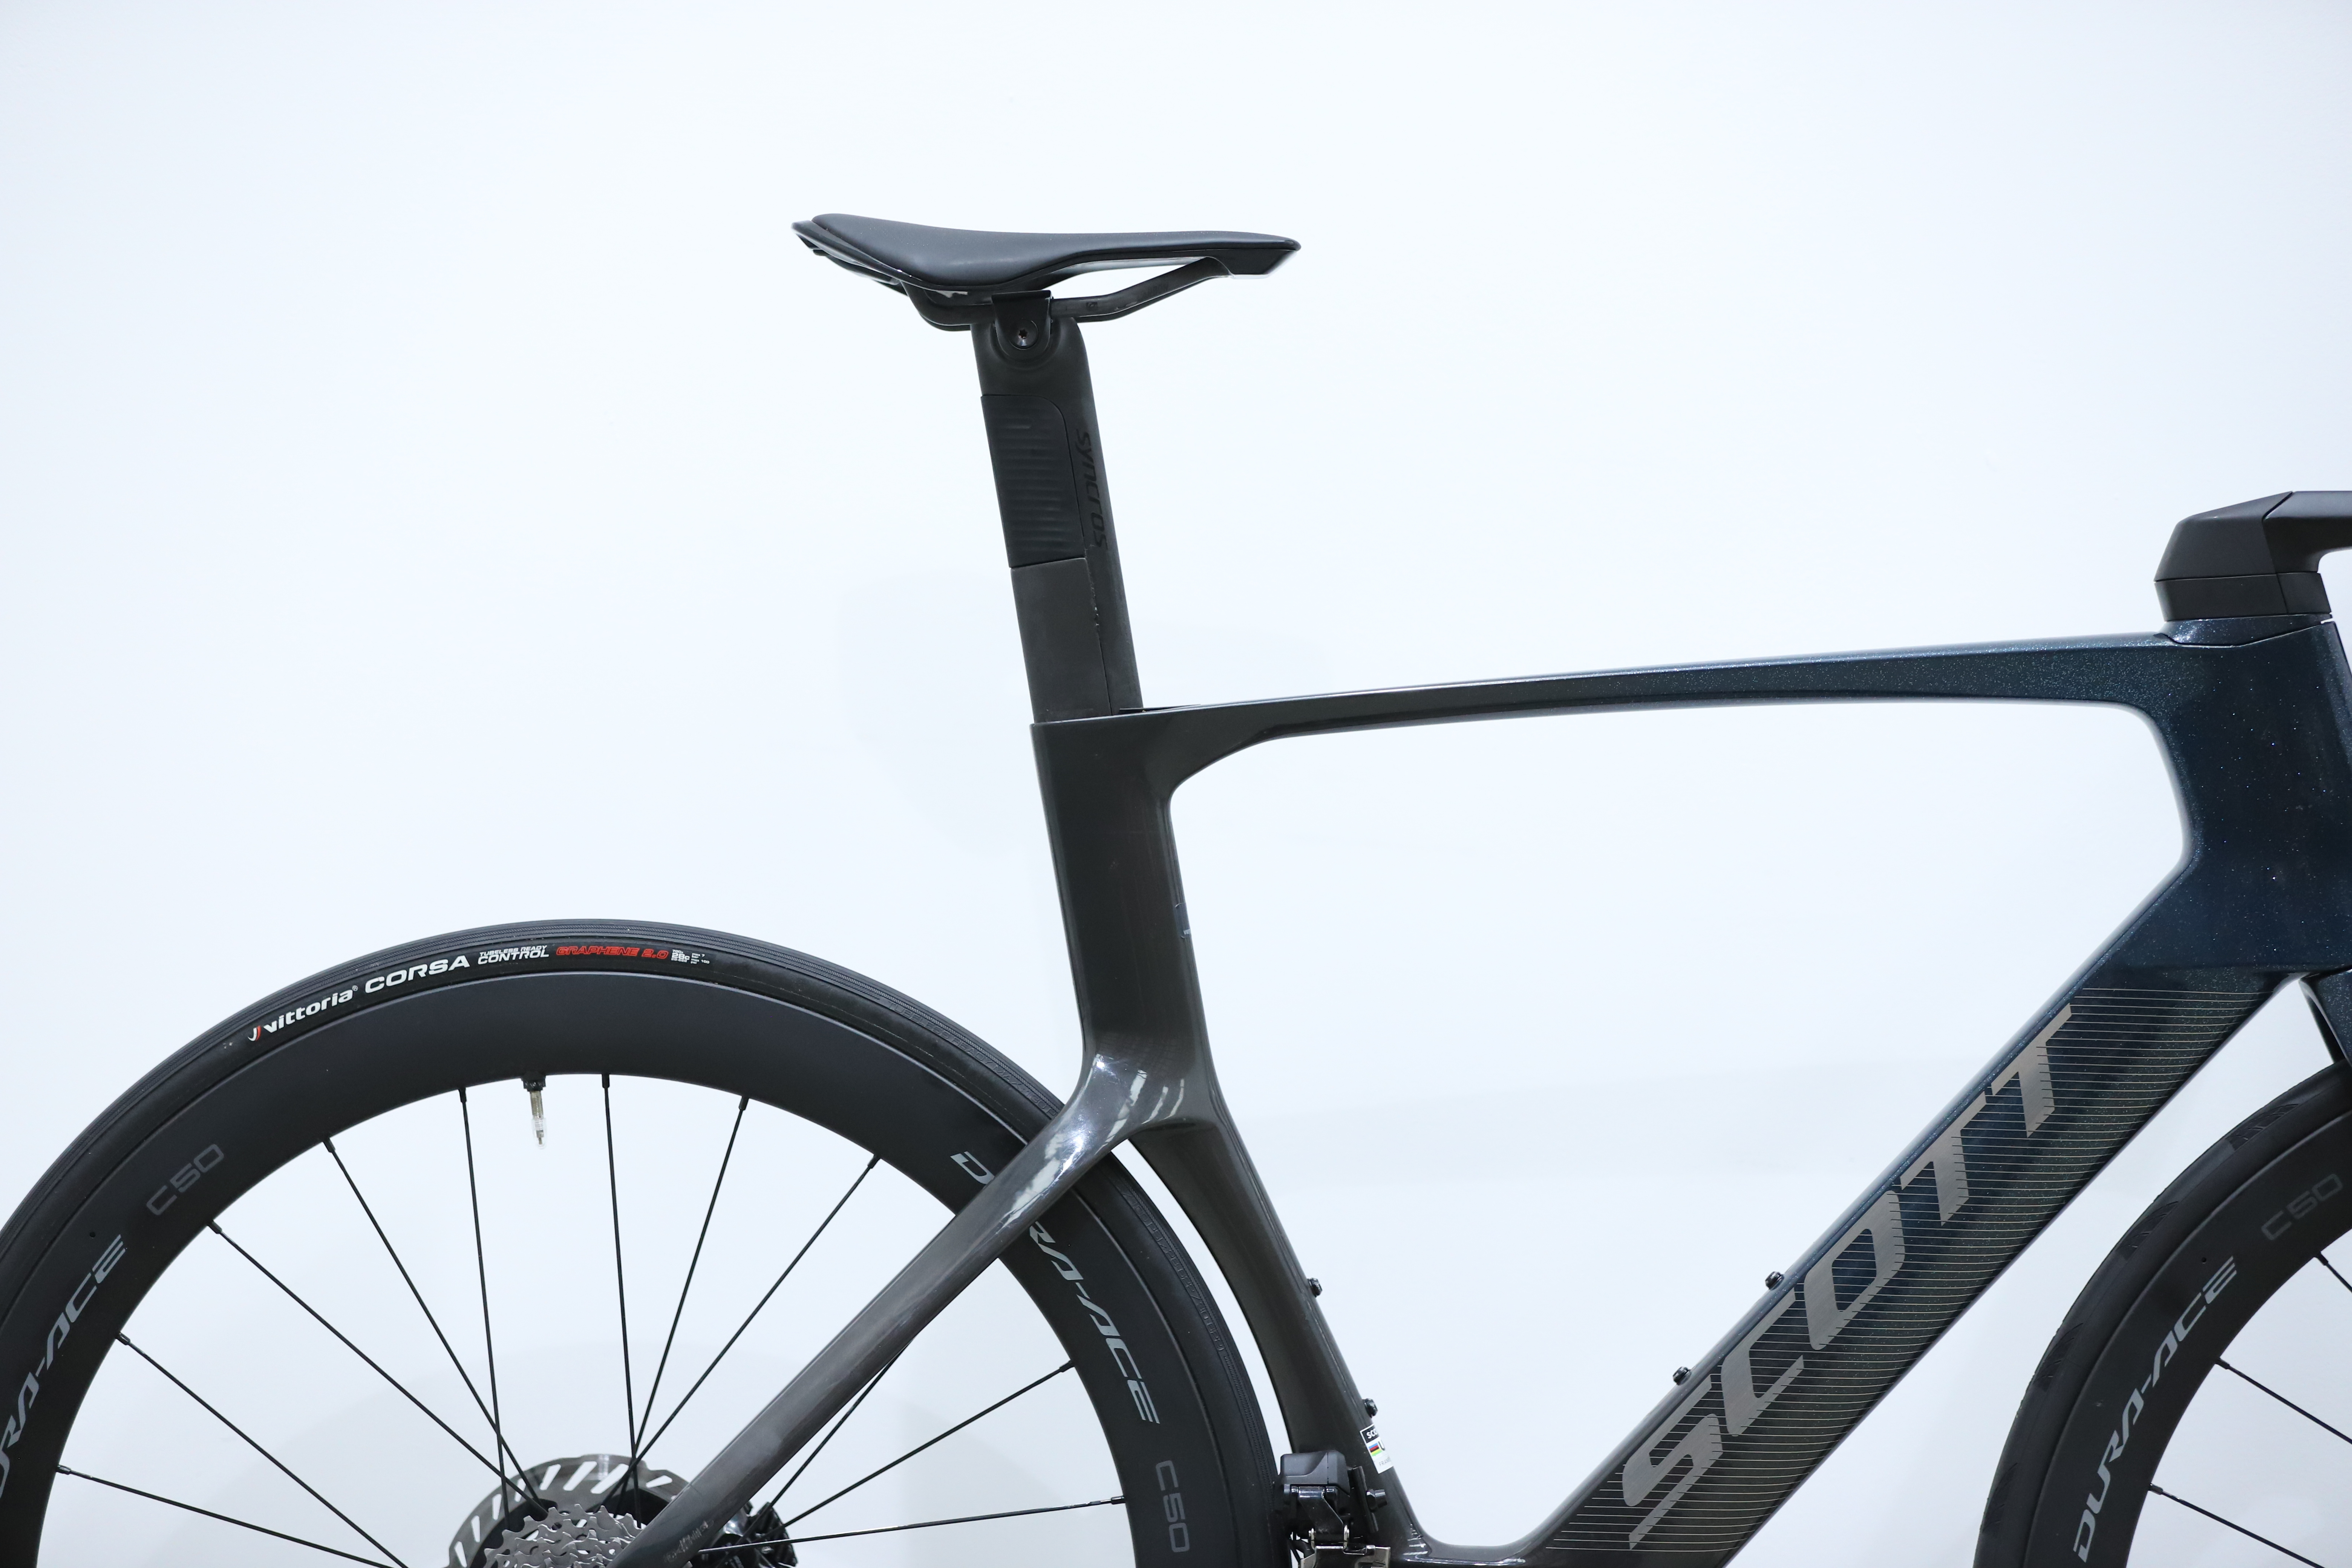
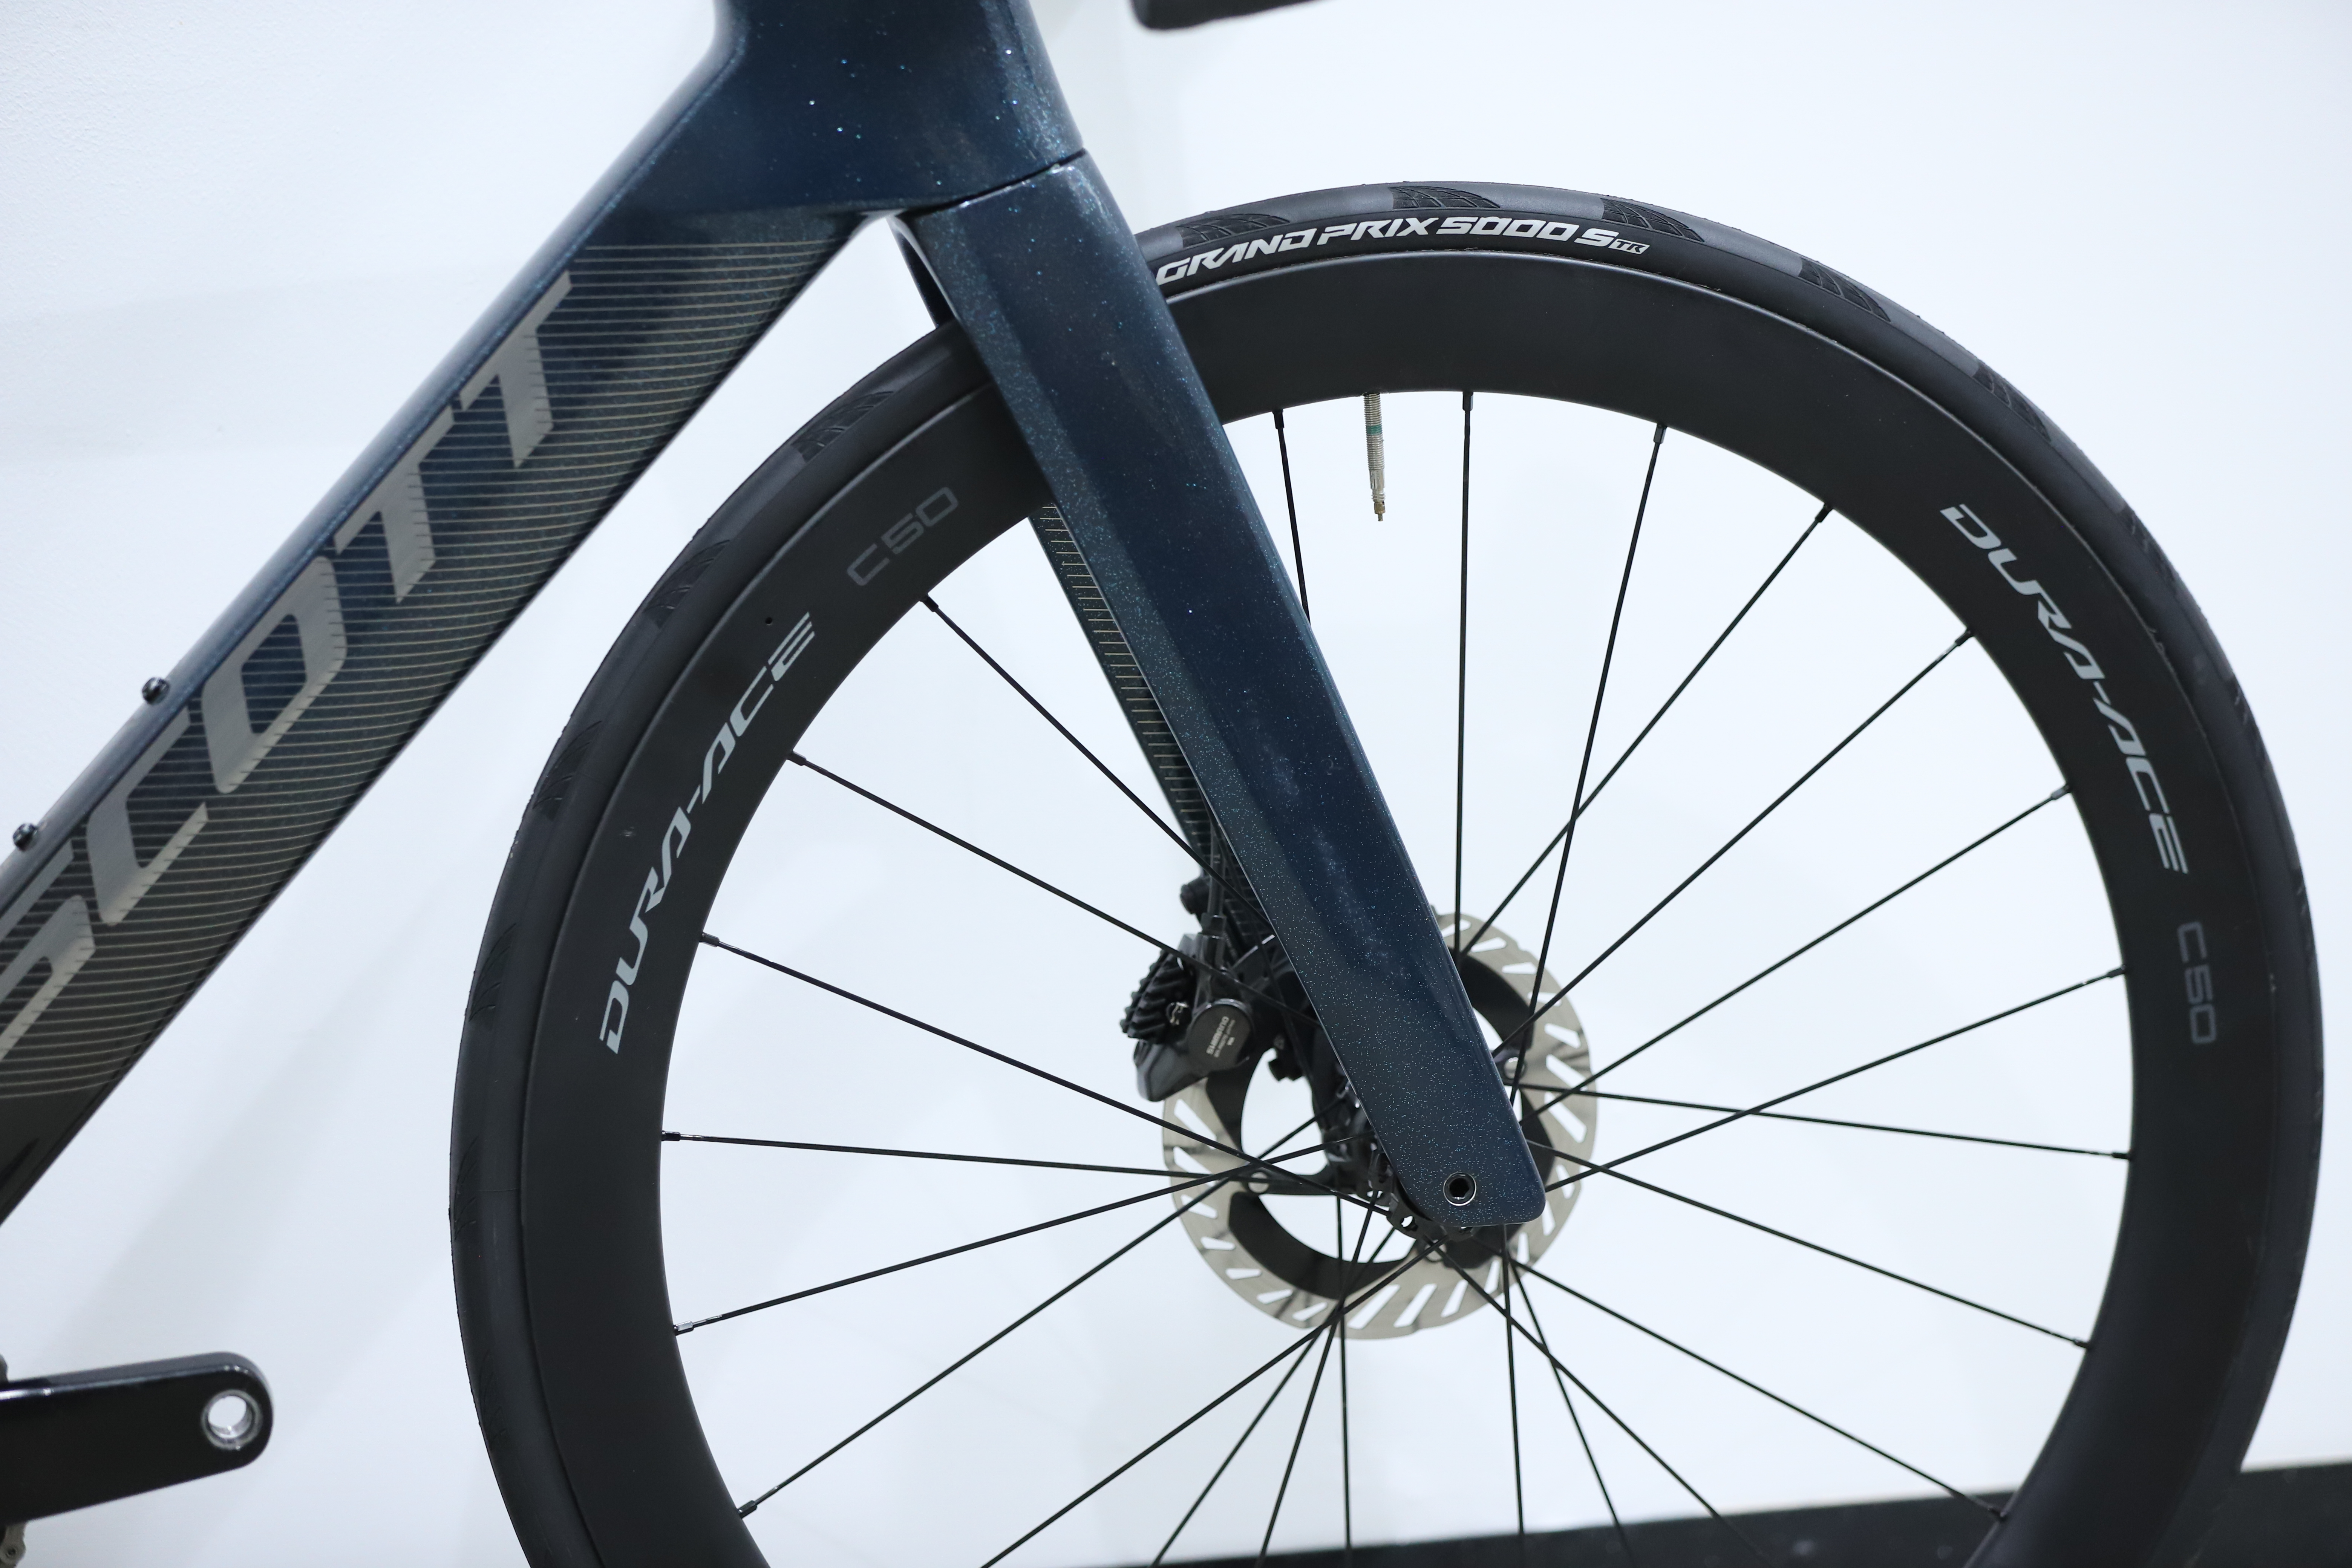
Although the rumourmill is telling us that a new Scott Addict 'all-rounder bike' should be launching in the not-too-distant future, we're yet to see anything beneath the riders at the brand's sponsored WorldTour team, DSM-Firmenich-Post NL. Their race bike of choice continues to be the Foil aero bike.
At 7.87kg, it's not going to trouble the UCI minimum weight rule anytime soon, but that's less of a concern given its main concern is going fast on flatter terrain. If our results are anything to go by, it should do that well, as it landed in 2nd place.
With our error margin, it can lay claim to 1st place, but as that goes both ways, it could also fall as low as 7th.
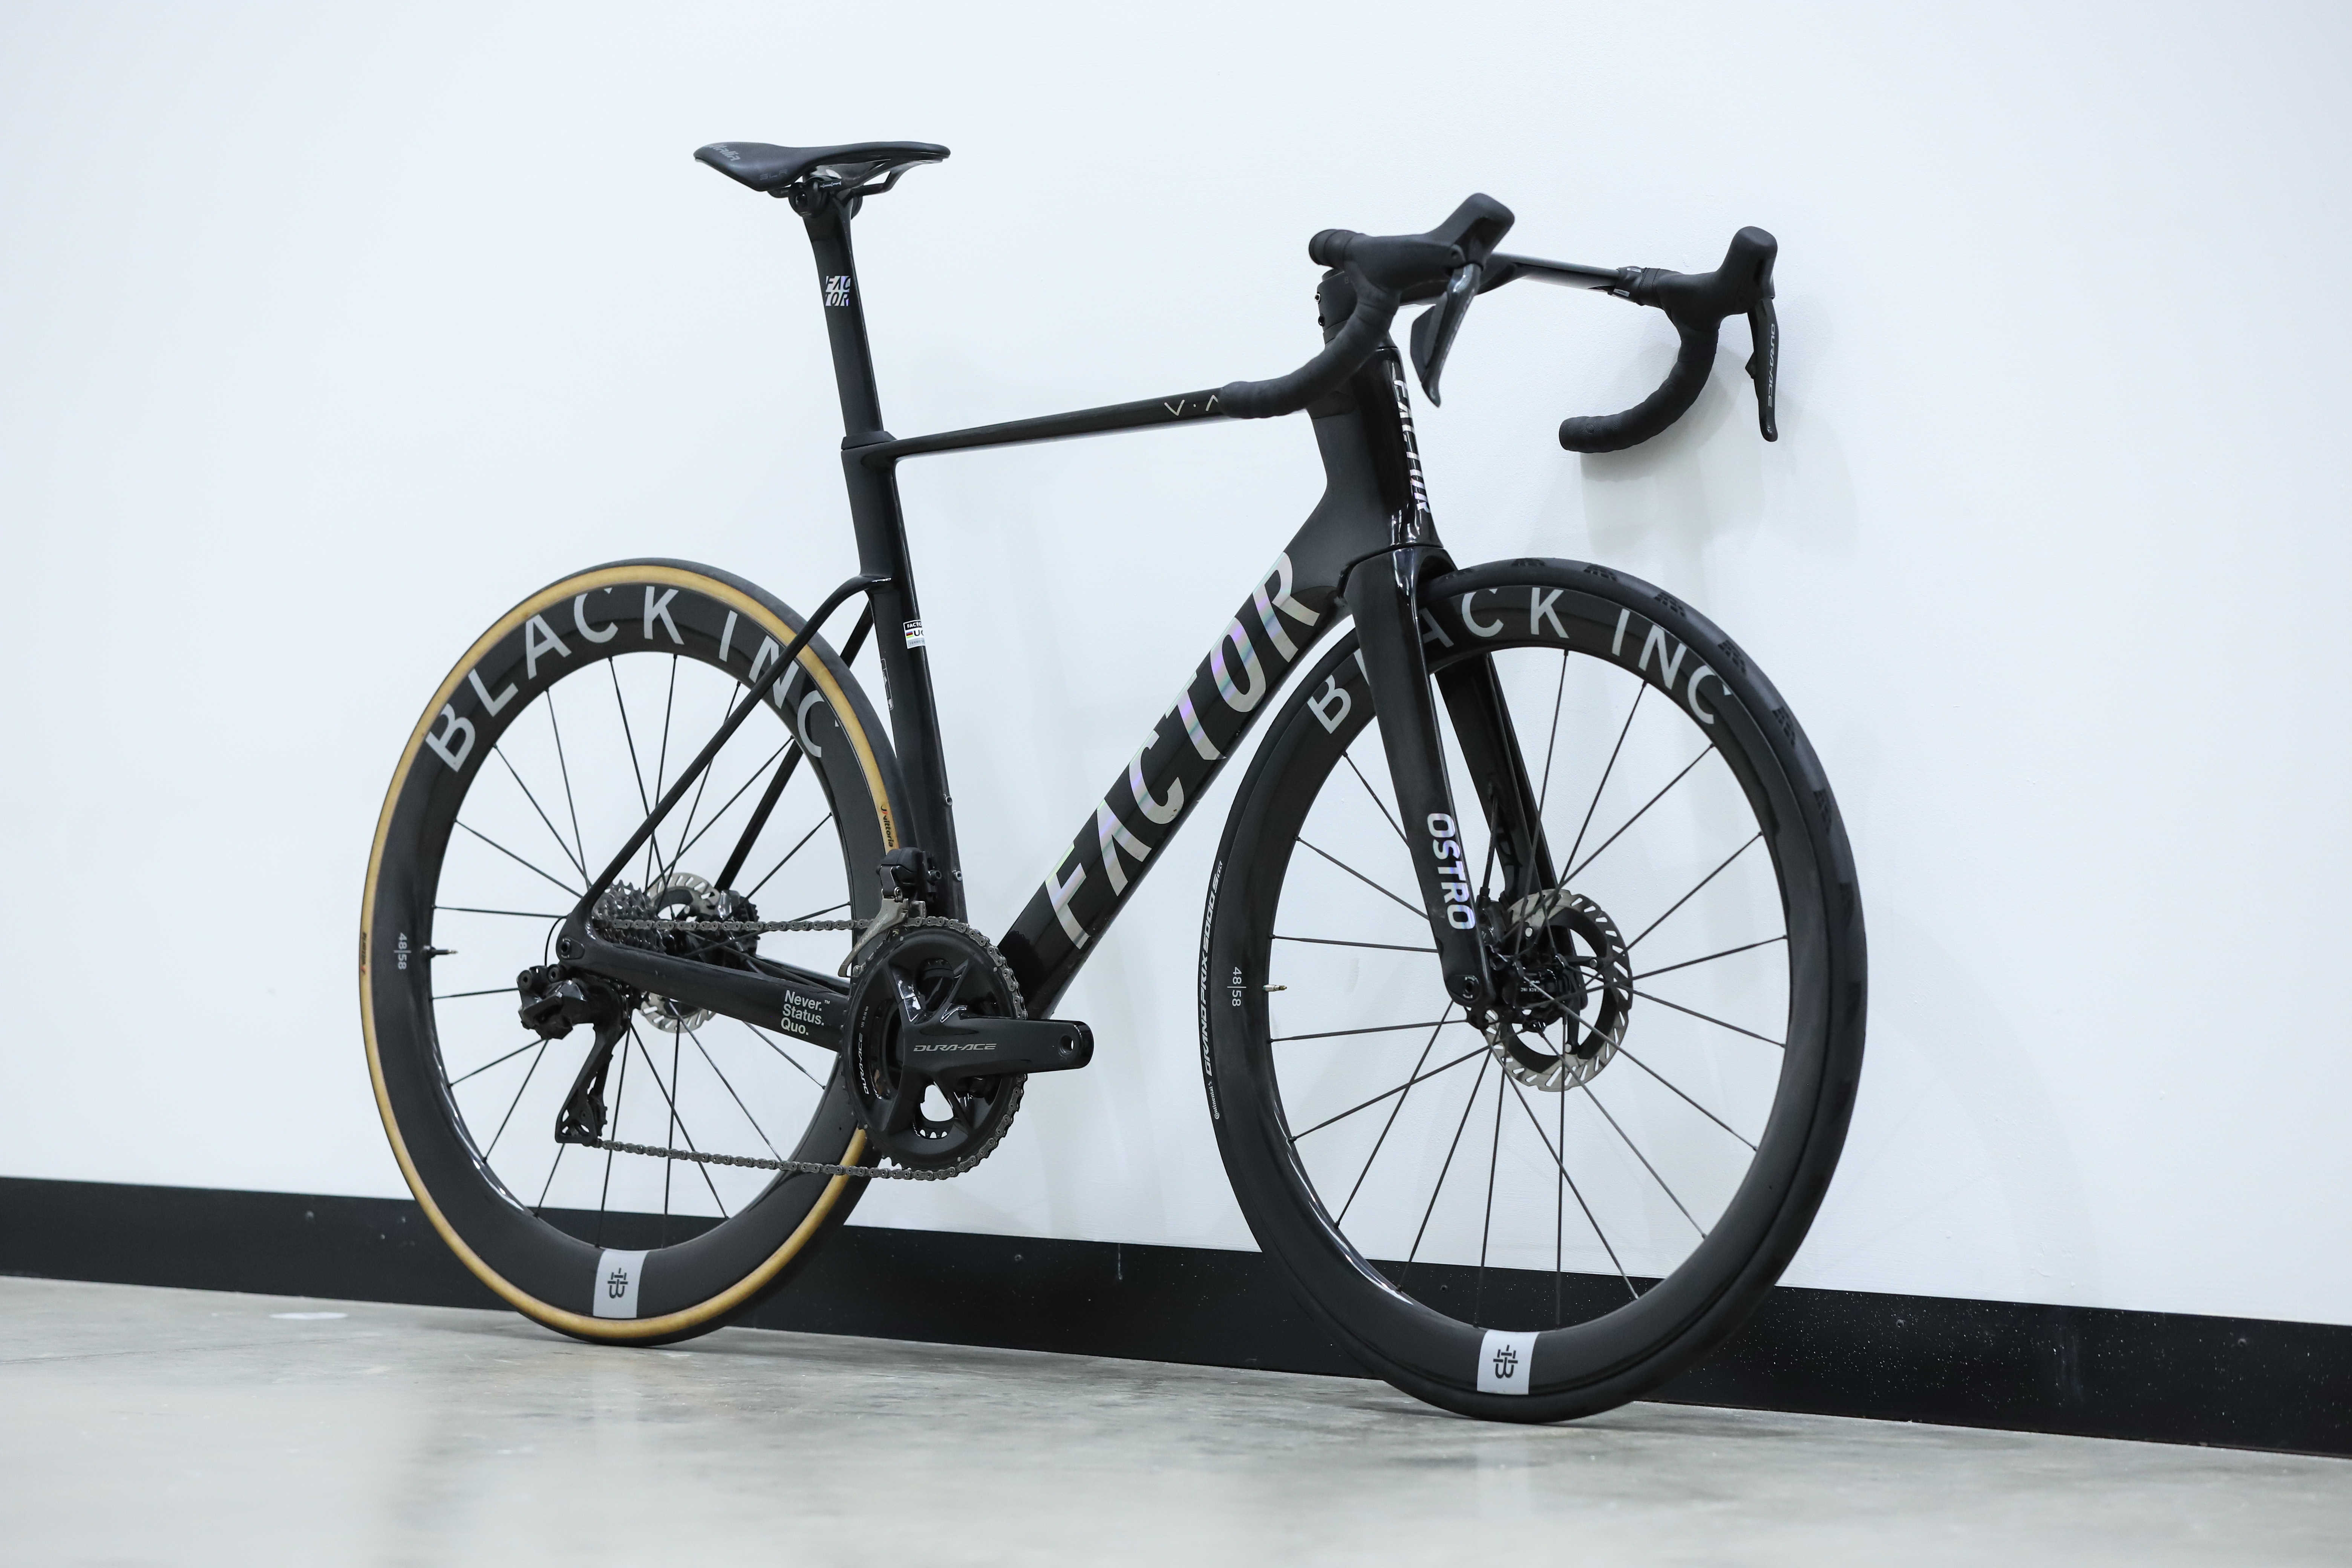
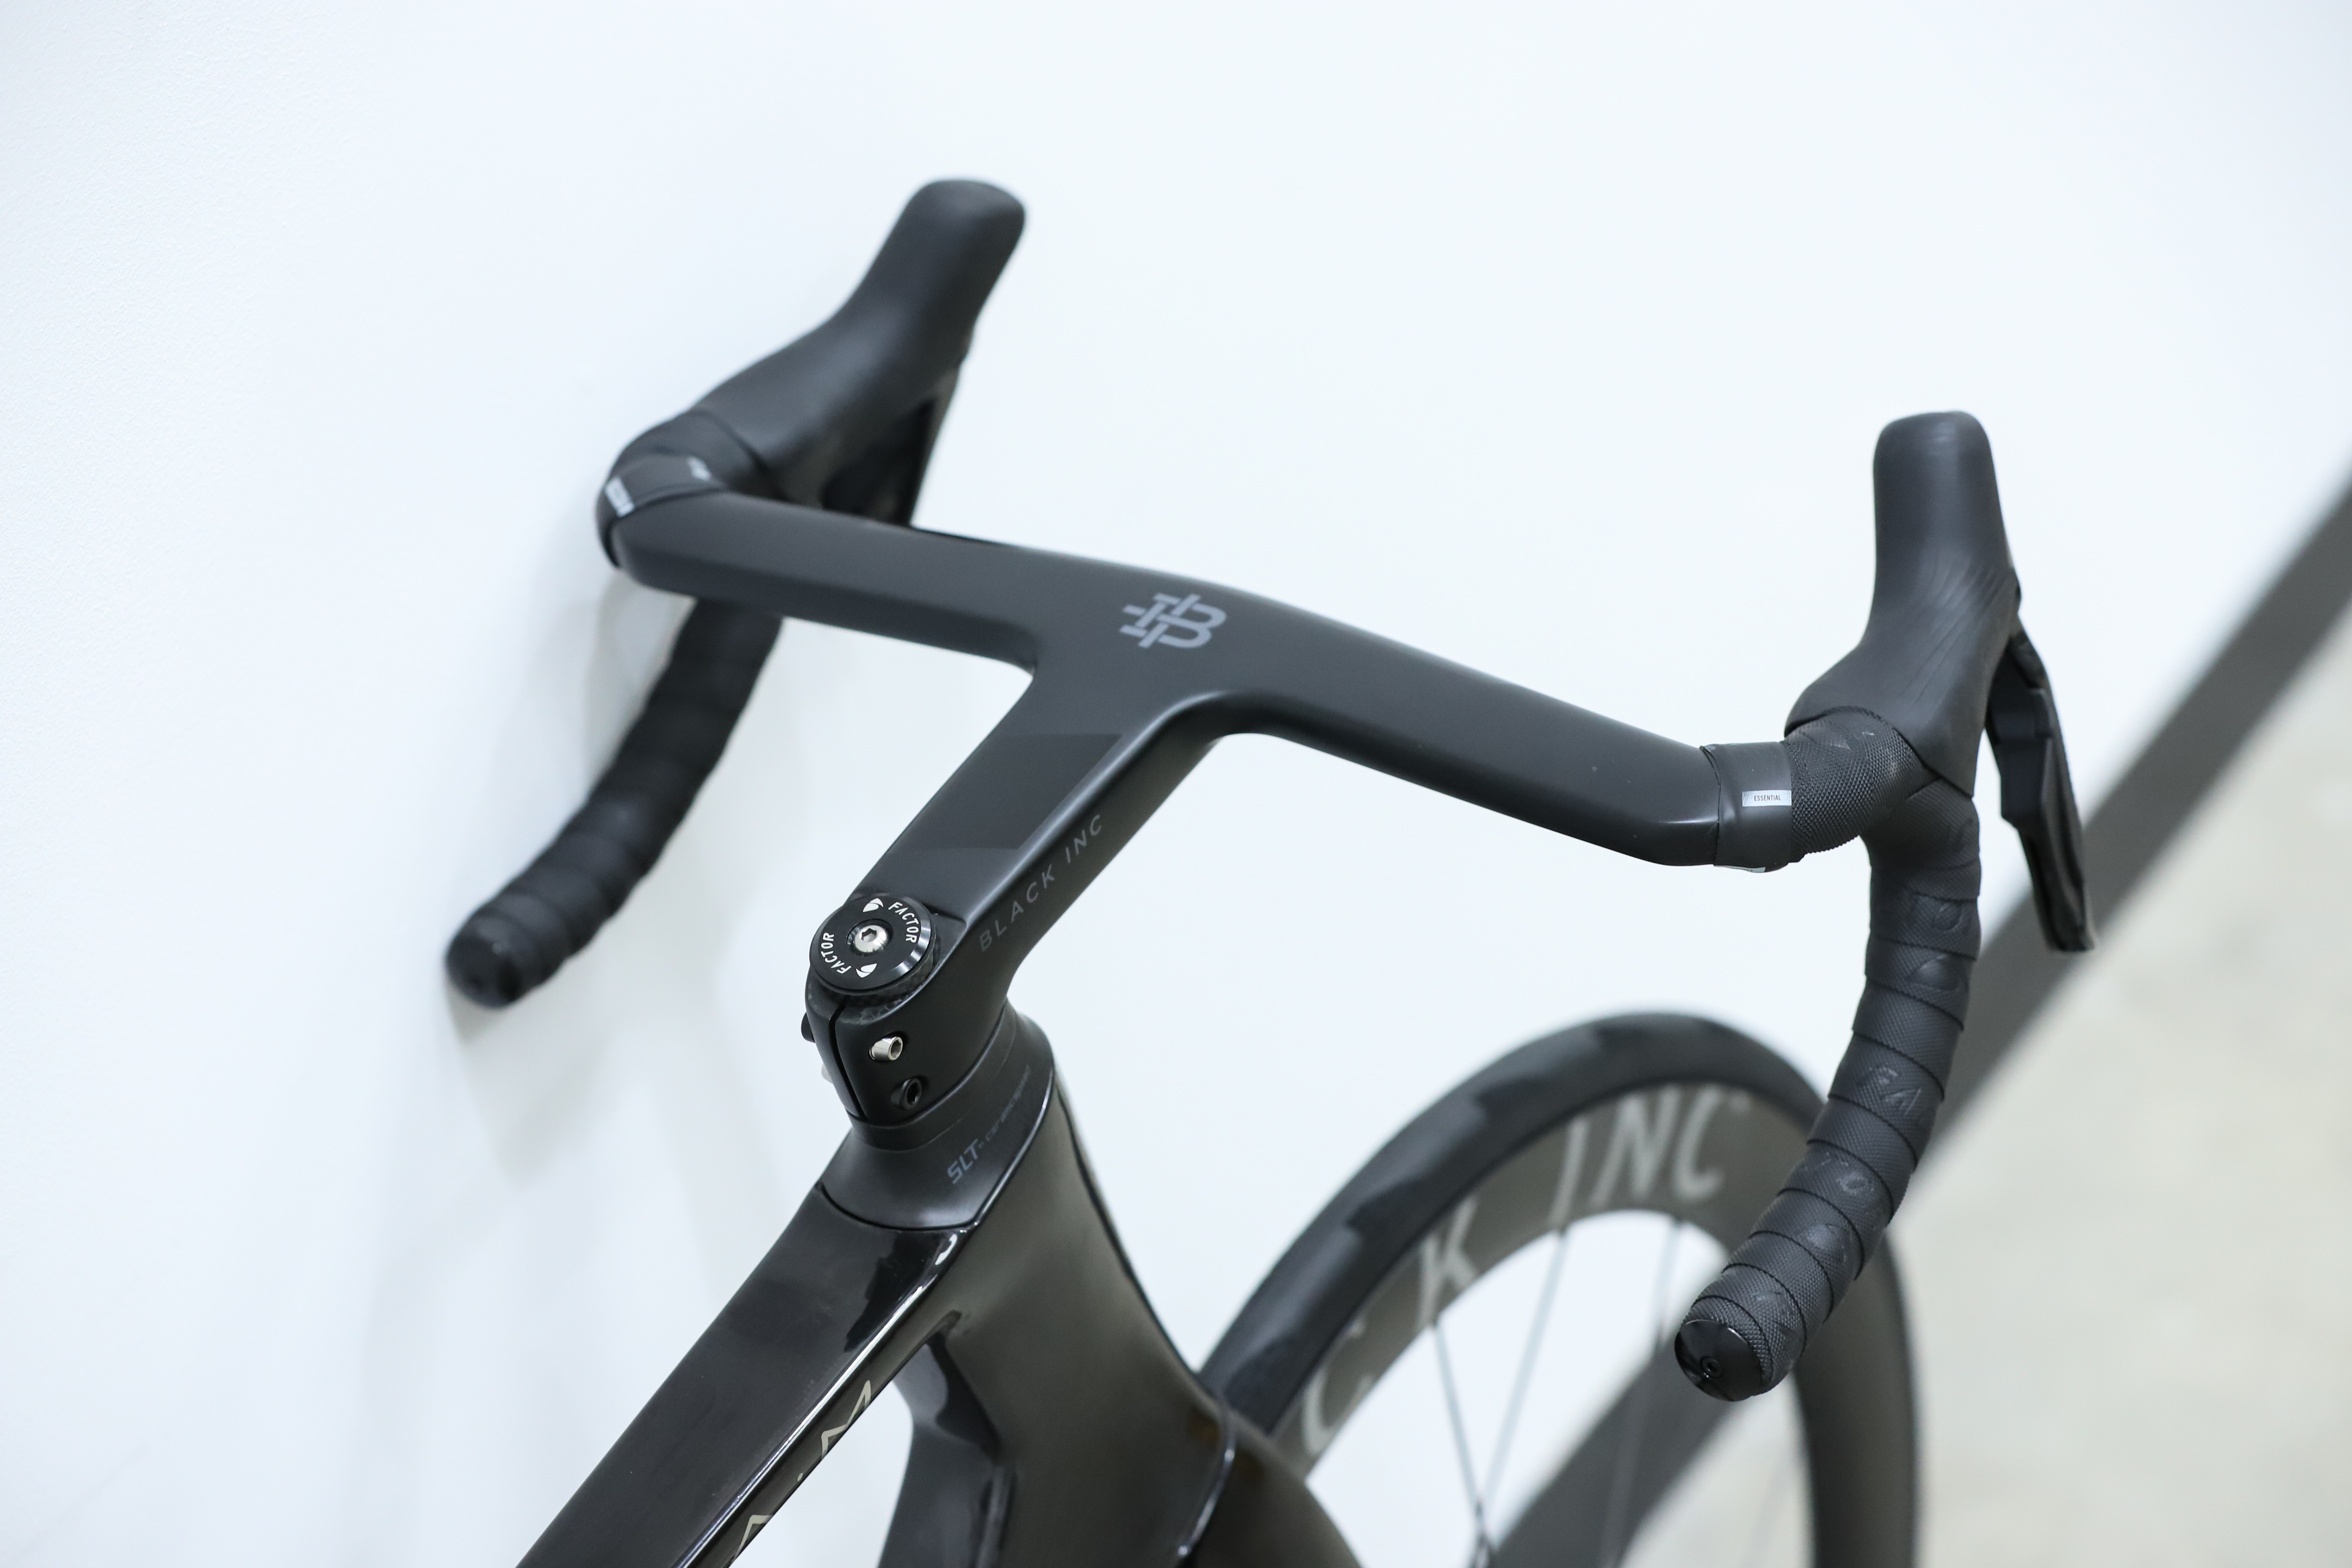
Factor OSTRO VAM


Average CdA
0.3407
Watts saved at 40km/h
24.25
Time saved over 40km at 250w
00:01:45
Average CdA
0.0882
Watts saved at 40km/h
40.15
Time saved over 40km at 250w
00:06:17
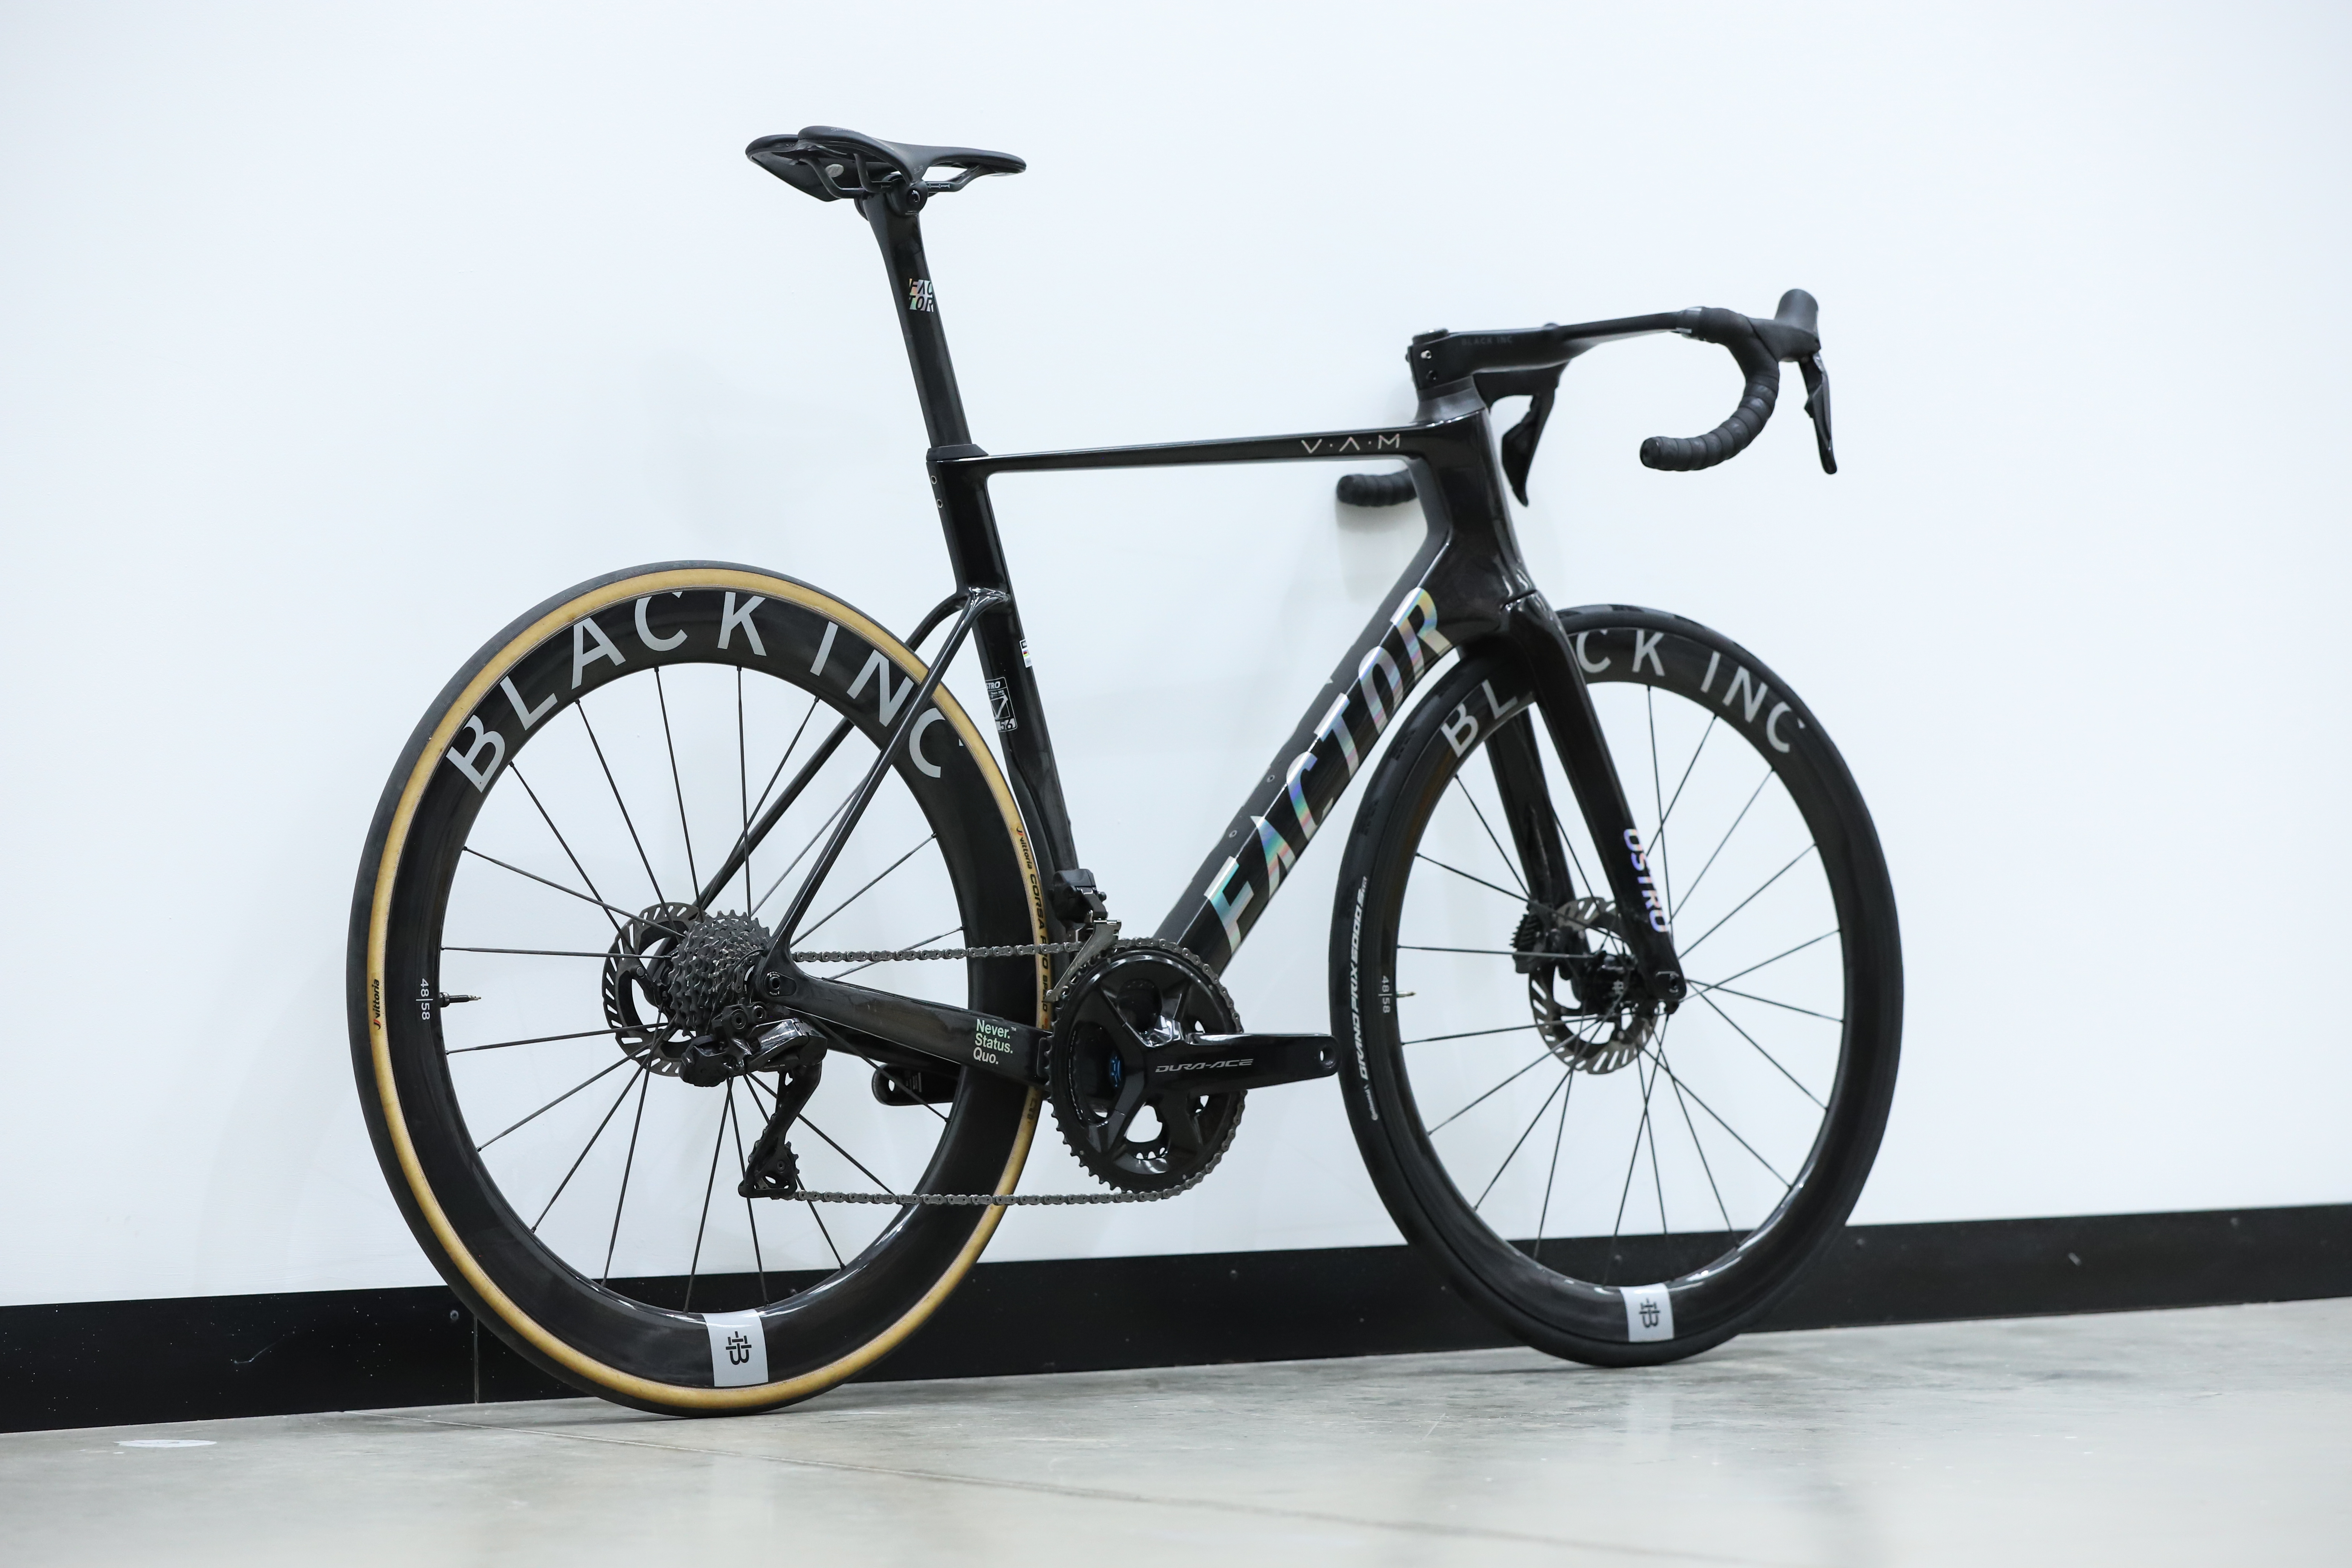
The fastest bike in our bike-only test, the Factor OSTRO VAM is also the second lightest, just 50 grams heavier than the Tarmac SL8. With our error margin factored in, it is still guaranteed a podium finish, only the Cervelo and the Scott can usurp it; an impressive result for a comparatively small brand.
Unfortunately, we were unable to get hold of the aero bottle cages that the bike will traditionally ship with, so for anyone buying it, it might be even faster.
I recently interviewed the brand's founder and CEO, Rob Gitelis, who spoke of his own career, how Factor came to be, and his loyalty to his employees through the tough COVID period.
Given the performance of this bike, that loyalty is seemingly paying off.
The takeaways
There we have it, 11 superbikes plus my old winter bike as a baseline comparison.
We've drawn out the conclusions above, highlighting some interesting differences in the bike-only tests, as well as concluding that the differences are small enough with a rider on that modern bikes are all within a ballpark, but that ballpark still stands to save you a good few watts against a budget-friendly bike.
Or to put it another way, you can save watts by upgrading your bike, but when it comes to deciding what to upgrade to, other factors such as weight and ride quality are more important than the one or two watts you might (or might not) save.
With these conclusions in mind, what have we learned?
1. Aero isn't everything
Despite aerodynamics (rightly) taking precedence when comparing bike performance, one thing we can learn here is that once you are confident that you are in the ballpark, you can focus your attention elsewhere.
Whether that means you focus on weight, spec, or simply the bike you like the colour of most, it doesn't really matter. You do you.
2. Buy a new helmet first
This isn't the first time we've been to the wind tunnel to test cycling tech. You might recall that we went to a wind tunnel in May to test road bike helmets, and back in 2022 to aero test road wheels.
The winner of our helmet test was the POC Procen Air, which saved 12.76 watts against the slowest on test at 40km/h.
The winner of our wheel test was the DT Swiss ARC 1100 Dicut, at 62mm deep. Compared to the slowest on test, they would save you 3.87 watts at 40km/h. The caveat there is that the 'slowest' were still high-quality aero wheels from Reserve.
As the data came out of our wind tunnel (ignoring our margin for a second), the difference between the Tarmac SL8 here and our baseline Emonda is 24.47 watts (with a rider on) but when compared to the least aero of the new bikes, the Look Blade 795 RS, the difference is much less, at just 6.09 watts.
It's worth noting that somewhere around 3-4 watts is about as little a difference in wattage as it's possible to 'feel', and this is only in the context of something back to back like switching a dynamo powered light on or off.
Given a new helmet will cost you three figures, whereas a bike and wheels will cost you four, that's where we'd spend our money first.
As always, the gains on the table are totally dependent on what you're starting with, so common sense shall prevail. Or you could treat yourself and upgrade everything!
3. You don't have to be a pro to ride a fast bike
The watt savings here have been calculated at 40km/h for reasons outlined above, but we can extrapolate the CdA to different speeds to calculate the savings.
Most keen amateurs will be able to hold 30km/h for extended periods of time, and the difference on offer here at that speed is still significant. Upgrading from the Trek Emonda ALR to the fastest bike on test, you stand to save between 7.03 and 13.62 watts.
Thank yous
To round off, I wanted to end this feature with a few thank yous to those who helped make it possible.
Each of the brands featured: For the loan of the bikes shown
Silverstone Sports Engineering Hub: For their guidance on protocol, running the wind tunnel for us, and for spending the evening prior to the test working out how to mount the Pinarello Dogma F, with its blind dropouts, so we could make the most of the following day's testing.
Special thanks to Canyon, who sent its drilled-out Aeroad used in its own wind tunnel testing, to help us get around the blind dropouts.
Special thanks to Cannondale, who shipped the brand's drilled-out fork overnight from the USA to the UK, to help us get around the blind dropout.
Madison UK: For the loan of Elite Vico Carbon bottle cages and Elite Fly bottles.
Continental Tyres: For the loan of GP5000 S TR tyres.
If you subscribe to Cyclingnews, you should sign up for our new subscriber-only newsletter. From exclusive interviews and tech galleries to race analysis and in-depth features, the Musette means you'll never miss out on member-exclusive content. Sign up now.

