
There’s no longer such a thing as a “one-size-fits-all” volatility measure (if there ever was), and the extreme market circumstances of the past two years underscored that point for traders such as Scott Bauer.
The covid pandemic, soaring inflation and the Federal Reserve’s efforts to contain it, Russia’s invasion of Ukraine, and other factors continue to roil the global marketplace and have the U.S. stock market on track for one of its most volatile years ever. But volatility in one market is not necessarily comparable, or useful for quick day-to-day trading decisions, to volatility in another.
That’s made CME Group’s Volatility Indexes (CVOL) a particularly handy tool for gauging varying degrees of volatility across different markets and asset classes, such as energy and treasuries, Bauer said.
In early August, CME Group’s CVOL indexes began streaming in real-time via CME Direct and on the CME Group website (delayed 15 minutes), allowing traders to measure market expectations and also track how markets are responding to certain pivotal events as they occur, including FOMC meetings, CPI data releases, OPEC meetings, WASDE reports, and other market-moving events.
Learn More and Follow CVOL Readings
The indexes measure implied volatility derived from real-time options prices across 27 futures products and six aggregate markets – interest rates, foreign exchange, energy, agricultural products, and metals.
Bauer said CVOL indexes offer a more comprehensive, consolidated view of the global markets’ volatility spectrum, helping him take a more tailored approach that accounts for complex relationships between different asset categories.
CVOL “is really good to have in more volatile environments, where there's potential for two or three standard deviation moves and I'm seeking ways to identify what those risk ‘tails’ look like,” said Bauer, who’s also CEO of Prosper Trading Academy in Chicago. “It’s a really consolidated way of looking at volatility across the entire curve.”
Telling a Market’s Story, Quickly
One of the unique things about CVOL is it applies a simple formula using out-of-the-money put and call options prices in highly liquid markets to produce a “single view” of risk expectations for the next 30 days, said Carrick Pierce, Executive Director, Options Solutions at CME Group.
By distilling heavy amounts of data and other information into a specific risk metric, CVOL indexes aim to “tell a story, very quickly,” Pierce added.
For CME customers, CVOL “really scratched an itch,” Pierce said. “Think of all the options prices traders in a given market are evaluating every day. There weren’t volatility indexes for many of these products, or if there was, it was based on an ETF. Traders were telling us, ‘this is what we want to know on a certain market.’ Both institutions and individuals now have deeper perspectives on volatility.”
A Volatile Year
Stock market volatility tends to make headlines. During the first eight months of 2022, the S&P 500 index posted 80 days in which it rose or fell by 1% or more, compared to an average of 51 days for all years since 1945, according to Sam Stovall, Chief Investment Strategist at market researcher CFRA. If that pace continues, 2022 would total 120 such days, which would rank it third all-time behind 2008 and 2002.
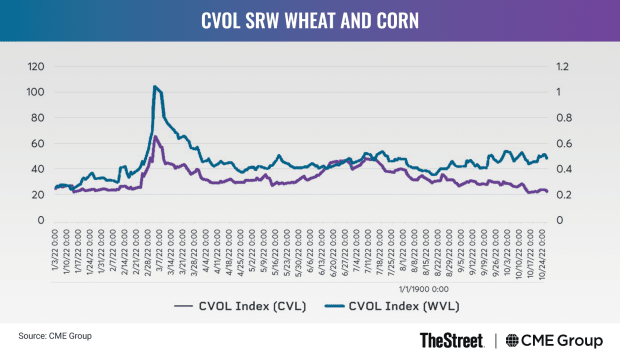
But other markets, such as grains, have been particularly volatile as well, Pierce noted. CVOL for soft red winter wheat futures, a U.S. benchmark, tripled to over 100 after Russia invaded Ukraine in late February, for example. Corn CVOL similarly bounced on the news. However, as indicated in the chart below, wheat has remained a volatile market while corn volatility has decreased as the North American harvest has come in. The wheat market continues to react to news of bottlenecks and potential delays at Black Sea ports.
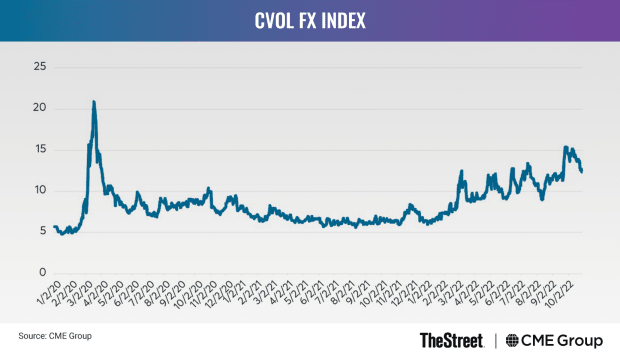
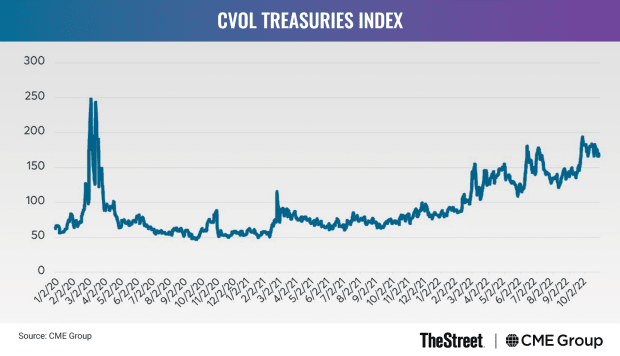
Prices for treasuries and currencies have also swung widely as Fed policy has shifted to fight rising inflation. Since the Federal Reserve started hiking rates in March 2022, the federal funds rate has moved to its highest level since 2008, with more increases expected. By October 2022, CVOL levels in these markets reached their highest level since 2020.
For example, options prices at certain times “may be telling you traders don’t see much potential for volatility,” Pierce said. However, if CVOL diverges from “up variance” and “down variance,” that could be useful information for a trader looking to take a contrarian stance, Pierce said. “If you think there are more geopolitical headwinds and the market is underpricing the possibility of that, CVOL might help inform your trading decisions.” UpVar or “up variance,” and DnVar, or “down variance” are additional indicators calculated with the CVOL indexes.
CVOL Helps Spot Opportunities in Volatile Oil Markets
Bauer cited a steep drop in crude oil futures after the three-day July 4, 2022 holiday weekend as another example where CVOL helped illuminate opportunities during a period of high uncertainty.
On July 5, nearby crude futures based on the West Texas Intermediate (WTI) benchmark tumbled as much as $11 per barrel, or 10%, from the market’s close above $108 the previous Friday as reports of stepped-up COVID lockdowns in China stirred concern over global demand. The sell-off sent premiums for out-of-the-money (OTM) crude oil put options soaring as the WTI-based CVOL surged to 58% after averaging 51% during the previous month.
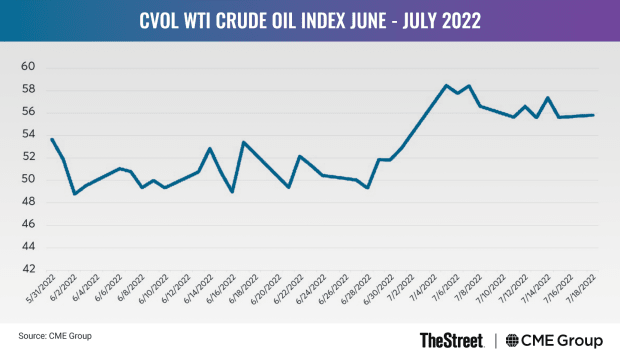
On that day, CVOL provided “a great advantage to see how the premium levels increased in out-of-the-money puts,” relative to at-the-money (ATM) puts, Bauer said. “The opportunity for the ATM/OTM put spread was there.”
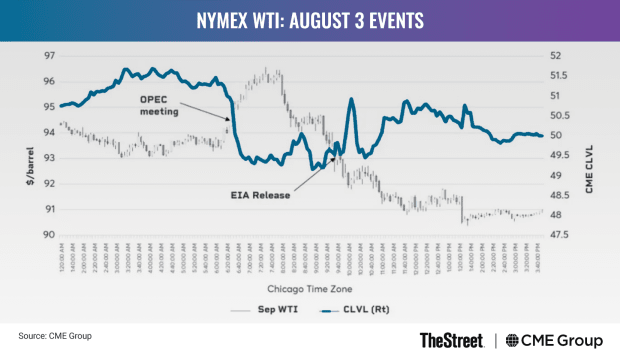
About a month later, what may have seemed to be more “predictable” events – OPEC meetings and U.S. Energy Information Administration (EIA) figures – combined to produce another volatile day in the oil market.
Nearby WTI futures rallied over $2 after OPEC members, following a scheduled meeting, agreed on a small production increase for September. A few hours later, prices tumbled after EIA reported weaker-than-expected U.S. gasoline demand (WTI futures swung more than $6 from the day’s high to the low and ended down $3.76, or 4%).
"CVOL shows me the volatility curve all the way through, rather than just implied volatility for at-the-money options. I can see the whole skew curve all at once, both upside and downside because CVOL puts it all into one place," Bauer said.
Visualizing Volatility
CVOL data can be downloaded from the CME DataMine platform, which helps independent retail traders like Nick Butler (additional real-time accessibility to CVOL via CME Group's Market Data Channel, Google Cloud Platform, and authorized data vendors will be available soon).
Butler said he uses CVOL data to create his own spreadsheets with different standard deviation settings that “allow me to visualize how far out-of-whack the CVOL in a particular market is,” and to gauge whether prices are about to “mean-revert,” or adjust. He then incorporates information from CVOL and other sources into his options trading decisions, aiming to collect premiums through either uncovered (aka, “naked”) positions or through spreads.
Butler claims he's “not very good” at trading futures outright but said CVOL has enhanced his ability to trade options on futures and make steady, consistent gains. “CVOL plays a big role in this.”
Bauer said CVOL also helps him ascertain “skew,” referring to the difference in volatility between at-the-money options, in-the-money options, and out-of-the-money options. A firm grasp of skew is critical for options traders, helping them identify markets where options may be underpriced or overpriced and then buy or sell accordingly.
“CVOL shows me the volatility curve all the way through, rather than just implied volatility for at-the-money options,” Bauer said. “I can see the whole skew curve all at once, both upside and downside because CVOL puts it all into one place. As a volatility trader, CVOL helps me to identify opportunities to buy or sell volatility, and where heightened premiums may be,” Bauer said.
Bauer said he holds most of his trading positions between 10 to 20 days, and because CVOL represents 30 days of forward risk, “it’s pretty spot-on for the type of trading I do.”


