What if many people just don’t bother voting in this election? The polls may suggest a landslide victory for Labour, but the party is worried about the millions of people who still say they are undecided or may think a Labour victory is so certain they don’t need to vote. A look at the history of voter turnout – and what don’t-knows and non-voters are saying – suggests the party is right to be concerned.
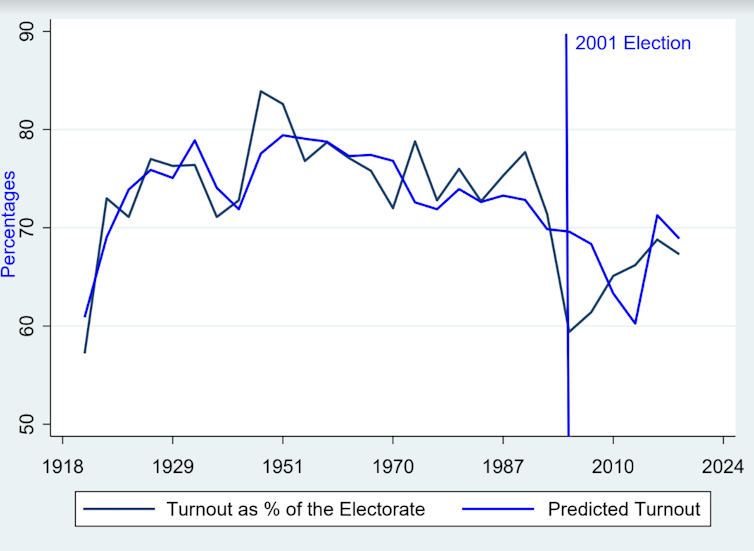
The black line in the chart below shows the turnout in every general election conducted in Britain since 1918. The most striking feature is the huge dip in turnout that occurred in 2001. That year’s turnout of 59% was almost the same as in 1918 (when Britain was still on a wartime footing). That has implications for the current election and helps explain Labour’s biggest anxiety in the final phase of the campaign.
Turnouts in UK general elections 1918 to 2019:

The blue line in the chart shows the predicted turnout using the vote shares of the Conservatives, Labour and the Liberals/Liberal Democrats in these elections. This is created by using these measures in what’s called a regression model to predict turnout.
The idea is that if one or more of the parties have a very good campaign, that should raise the overall turnout. If, on the other hand, the party campaigns are boring and the outcome predictable, we should see a lower turnout.
For example, in the 1959 general election the incumbent Conservative prime minister, Harold Macmillan, won almost 50% of the vote by proclaiming that “most of our people have never had it so good”. The turnout in that election was just under 80%.
In contrast, the 2010 election produced a hung parliament because no party did really well, and this produced a turnout of 65%. So the aim is to find out if one these parties benefits more than the others from a high turnout.
If we look at turnouts across constituencies in Britain, they tend to be higher in Conservative-held seats than in Labour seats. If this is true over time, then we should expect to see the Conservatives doing better in a general election with a high turnout.
However, the modelling shows that this does not happen. Both the Conservative and Labour vote shares have very high correlations with turnout (we can rate these correlations with scores of 0.81 and 0.82 out of 1, respectively). This means they both do equally well with a high turnout.
The relationship is a bit weaker for the Liberals/Liberal Democrats (0.71), but not by much. What stands out is how different the 2001 election was from the rest since the vote shares do not predict the low turnout at all well.
What happened in the 2001 election?
We can probe what happened in 2001 using data from the British Election Study of that year. This was analysed fully in a book I published with colleagues in 2004.
In the analysis we found that 52% of nearly 3,000 survey respondents said they always voted in general elections. A further 27% said they voted in most elections, 9% said they did so in some elections and finally 12% said they never vote in any election.
There are some standard demographic measures associated with turnout which appear regularly in surveys. Older people turn out more than younger people. The ethnic majority population turns out more than ethnic minorities. Owner-occupiers turn out more than people who rent accommodation. And finally middle-class people turn out more than working-class people.
These are features of all elections and so they don’t really explain why the 2001 election was different.
Want more election coverage from The Conversation’s academic experts? Over the coming weeks, we’ll bring you informed analysis of developments in the campaign and we’ll fact check the claims being made.
Sign up for our new, weekly election newsletter, delivered every Friday throughout the campaign and beyond.
To find out why it was different we can use questions in the survey aimed specifically at non-voters. Identifying them is a tricky exercise because there are always respondents who say that they voted in an election when in fact they did not. This is, in part, explained in terms of a social desirability bias, or wanting to appear as a good citizen to the interviewer.
Fortunately, in 2001 it was possible to verify if respondents did actually vote, since records were kept after the election in case of legal challenges. This meant that researchers could find out if people voted, even though they could not find out how they voted.
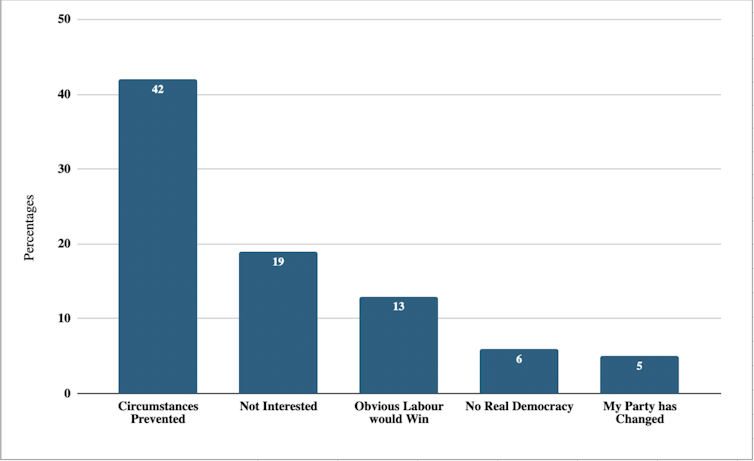
The chart below shows the top five reasons given for not voting in the survey. The most popular one was that respondents were prevented by circumstances. This is vague, but takes in issues like being away, working long hours, having transport problems, mobility issues and so on.
Reasons for not voting in the 2001 election:

The interesting responses came from people who said that they were simply not interested in the election, or, alternatively, that they thought that Labour was sure to win. These two made up about a third of respondents. A further 6% were dissatisfied with the state of democracy in Britain, and 5% thought their party had changed in a way they disliked.
The relevance of these findings for the current election are apparent. A YouGov poll conducted for the Times and completed on June 20 asked respondents how likely they were to vote, using a scale from zero to ten, where zero meant certain not to vote, and ten meant certain to vote. A total of 63% scored themselves ten. This is only 1% more than respondents to the same question in the 2001 survey.
In addition, in the YouGov survey only 43% of those saying they don’t know how they will vote scored ten and they made up 11% of survey respondents, which translated into voters is about 4.9 million people. In short there are many undecideds at the present time who will not vote, a number who think that Labour is bound to win and so will not bother, or have lost interest in the election.
These findings point in the direction of a low turnout in the general election – and a reason for Labour to feel less sure of a breezy victory.
Paul Whiteley has received funding from the British Academy and the ESRC.
This article was originally published on The Conversation. Read the original article.


