Exxon Mobil Corp (NYSE:XOM) was shooting up more than 4% higher on Tuesday after two analysts raised their price targets on the stock.
The energy sector has enjoyed a bull market recently while the general markets have experienced a great deal of volatility, with the S&P entering into a bear market in mid-March, when the 50-day simple moving average (SMA) crossed below the 200-day SMA.
As the old adage goes “there’s always a bull market somewhere” and the gas and oil sectors have experienced a long-term push due to Russia’s invasion of Ukraine, which prompted numerous countries to ban the import of Russian oil. The geopolitical tensions have caused pain at the pumps, where gasoline prices have reached record highs heading into summer.
On Monday, a gallon of gas averaged $4.86 in the U.S. and the seasonally strong demand for gas during warmer months, as people look to travel, means costs could rise further.
The news may be welcomed by traders and investors who are participating in energy stocks and on Tuesday, Exxon looked to be headed for a new all-time high.
Want direct analysis? Find me in the BZ Pro lounge! Click here for a free trial.
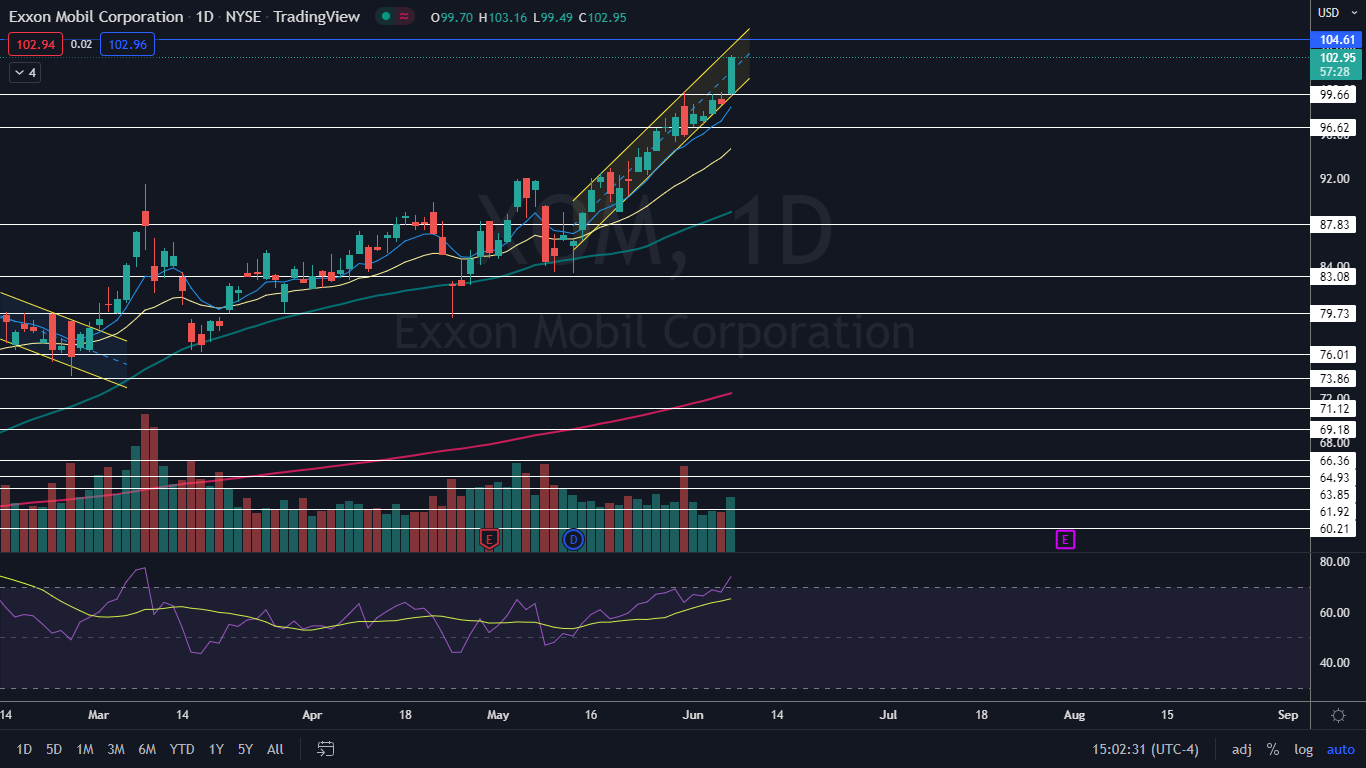
The Exxon Chart: On Tuesday, Exxon was trading just $2 from its all-time high of $104.61, which was printed in June and July of 2014. The stock was also working its way up to the top ascending trendline of a rising channel pattern, which Exxon has been trading in since May 12.
- If Exxon reaches the top trendline of the pattern, the stock may find resistance near the area because it’s acted as heavy resistance in the past. If Exxon rejects the level as resistance, the stock may retrace lower to form another higher low, which could give bullish traders who aren’t already in a position a solid entry point.
- If Exxon closes the trading day near its high-of-day price, the stock will print a bullish kicker candlestick, which could indicate higher prices will come on Wednesday. If that happens, Exxon may blow through the resistance at both the rising channel and the previous all-time high.
- If the stock retraces slightly and closes the trading session with an upper wick, it may indicate Exxon will trade lower on Wednesday. There’s also a chance Exxon forms an inside bar pattern, which would lean bullish for a break on Thursday.
- Eventually, either lower prices or sideways consolidation is likely to take place because Exxon’s relative strength index (RSI) reached 74% on Tuesday. When a stock’s RSI reaches above the 70% level it becomes overbought, which can be a sell signal for technical traders.
- There is no resistance above the upper trendline and the previous all-time high. Exxon has support below at $99.66 and $96.62.